-
Policy
Policy
Exclusive interviews with leading policymakers that convey the true policy message that impacts markets.
LATEST FROM POLICY: -
EM Policy
EM Policy
Exclusive interviews with leading policymakers that convey the true policy message that impacts markets.
LATEST FROM EM POLICY: -
G10 Markets
G10 Markets
Real-time insight on key fixed income and fx markets.
Launch MNI PodcastsFixed IncomeFI Markets AnalysisCentral Bank PreviewsFI PiFixed Income Technical AnalysisUS$ Credit Supply PipelineGilt Week AheadGlobal IssuanceEurozoneUKUSDeep DiveGlobal Issuance CalendarsEZ/UK Bond Auction CalendarEZ/UK T-bill Auction CalendarUS Treasury Auction CalendarPolitical RiskMNI Political Risk AnalysisMNI Political Risk - US Daily BriefMNI Political Risk - The week AheadElection Previews -
Emerging Markets
Emerging Markets
Real-time insight of emerging markets in CEMEA, Asia and LatAm region
-
Commodities
-
Credit
Credit
Real time insight of credit markets
-
Data
-
Global Macro
Global Macro
Actionable insight on monetary policy, balance sheet and inflation with focus on global issuance. Analysis on key political risk impacting the global markets.
Global MacroDM Central Bank PreviewsDM Central Bank ReviewsEM Central Bank PreviewsEM Central Bank ReviewsBalance Sheet AnalysisData AnalysisEurozone DataUK DataUS DataAPAC DataInflation InsightEmployment InsightGlobal IssuanceEurozoneUKUSDeep DiveGlobal Issuance Calendars EZ/UK Bond Auction Calendar EZ/UK T-bill Auction Calendar US Treasury Auction Calendar Global Macro Weekly -
About Us
To read the full story
Sign up now for free trial access to this content.
Please enter your details below.
Why MNI
MNI is the leading provider
of intelligence and analysis on the Global Fixed Income, Foreign Exchange and Energy markets. We use an innovative combination of real-time analysis, deep fundamental research and journalism to provide unique and actionable insights for traders and investors. Our "All signal, no noise" approach drives an intelligence service that is succinct and timely, which is highly regarded by our time constrained client base.Our Head Office is in London with offices in Chicago, Washington and Beijing, as well as an on the ground presence in other major financial centres across the world.
Real-time Actionable Insight
Get the latest on Central Bank Policy and FX & FI Markets to help inform both your strategic and tactical decision-making.
Free AccessMNI UST Issuance Deep Dive: Dec 2024
MNI US Employment Insight: Soft Enough To Keep Fed Cutting
MNI ASIA MARKETS ANALYSIS: Jobs Data Green Lights Rate Cuts
MNI Europe Morning FX Analysis: Too Close to Call
FOREX: Markets Swing as US Election Too Close to Call
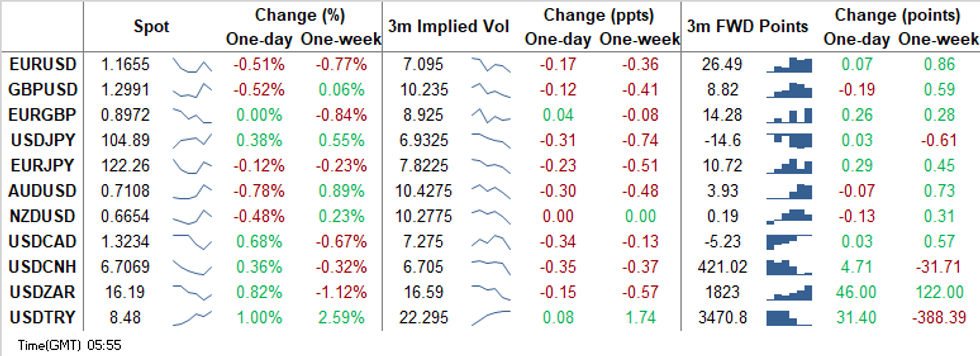
Pretty much everything else took the back seat overnight, as the U.S. elections stole the show. Betting markets drove the choppy price action, with initial risk-on impetus dissipating as Trump took over as the betting favourite, even as the general view is that it remains a very tight race. A tech-driven rebound in e-minis offered risk some relief, but a sense of broader caution remained, amid expectations that the winner of the White House race won't be known today. The greenback shook off its initial weakness and shot higher, outperforming all of its G10 peers, with the DXY showing at best levels since Sep 28.
- Riskier currencies swung to a loss vs. USD as early results boosted perceived odds of Trump's re-election. AUD & NOK led losses in G10 FX space, with above-forecast Australian retail sales overshadowed by election jitters.
- Markets in Asia were taking their lead from Betfair US election outcome. Early USD losses quickly pared as betting suggested a closer race than polls suggested.
- Officials remain vigilant over the ramifications of today's poll. BoJ Gov Kuroda underlined the importance of FX markets stability, while the BoK is set to hold a meeting today to take stock of the impact of the election.
- USD/CNH saw some violent moves, which resulted in a brief move above the 50-DMA. The moving average remained intact since early Jun. Weaker than exp. PBoC fix was overshadowed by broader cross-currents. The rate is still elevated, but sits off highs as we type.
- MXN got battered by the aforementioned betting markets dynamics. However, USD/MXN eased off highs after rejecting resistance from the 23.6% retracement of Apr 6 - Oct 27 slide/round fig. of MXN22.0000, as a spill-over from firmer equity markets kicked in.
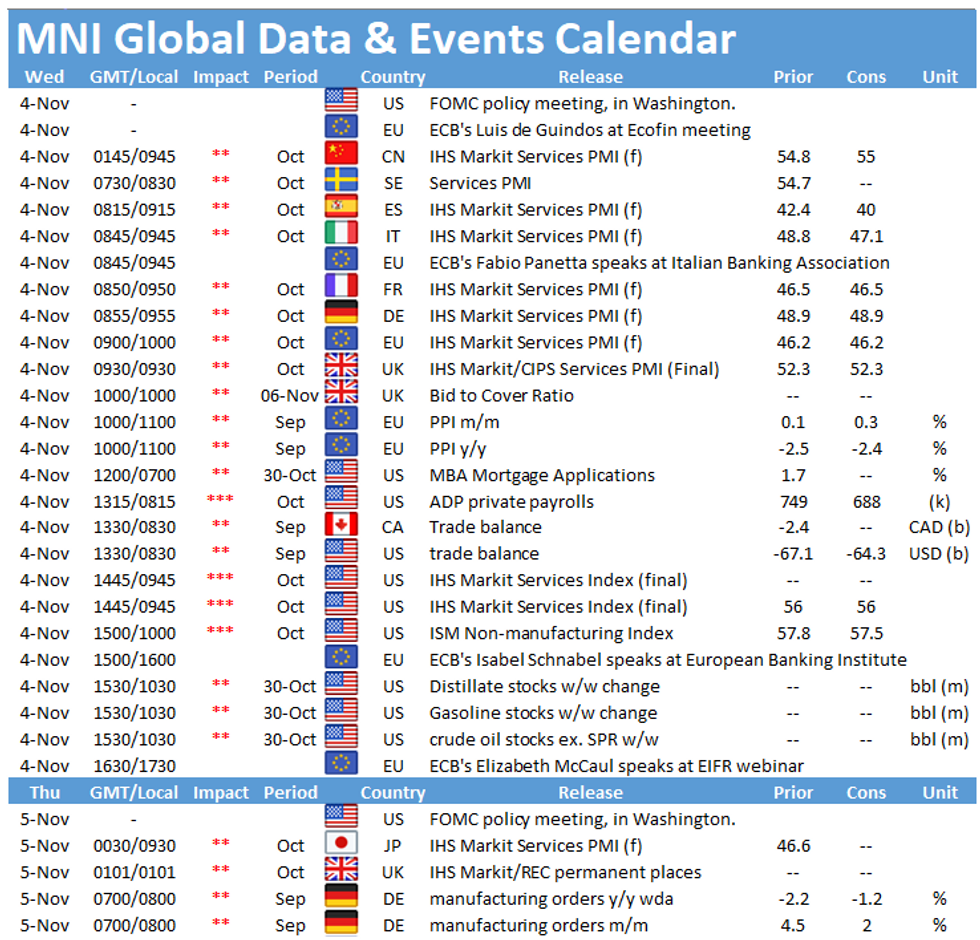
- Today's data highlights include global Services PMIs, while central bank speaker slate features ECB's de Cos, Panetta, Muller & Schnabel. It goes without saying that election matters remain front and centre, with further results trickling in.
MNI FX TECHNICALS
EUR/USD: Probes 1.1612 Support
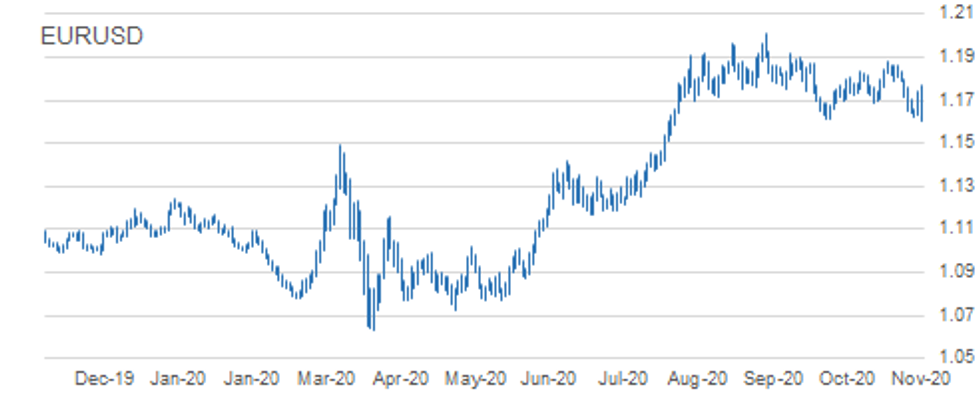
- RES 4: 1.1881 High Oct 21 and the bull trigger
- RES 3: 1.1861 Oct 26 high
- RES 2: 1.1798 High Oct 28
- RES 1: 1.1770 Intraday high
- PRICE: 1.1659 @ 05:47 GMT Nov 4
- SUP 1: 1.1603 Intraday low
- SUP 2: 1.1576 0.764 proj of Sep 1 - 25 sell-off from Oct 21 high
- SUP 3: 1.1541 Low Jul 23
- SUP 4: 1.1482 1.000 proj of Sep 1 - 25 sell-off from Oct 21 high
EURUSD is volatile. Technical signals continue to highlight a bearish backdrop though and today's low print of 1.1603 highlights an extension of the recent downleg with price probing key support at 1.1612, Sep 25 low. A clear break of 1.1612 would signal potential for weakness towards 1.1576 next, a Fibonacci projection. On the upside, today's initial resistance is at the overnight high of 1.1770.
GBP/USD: Volatile And Off Overnight Highs
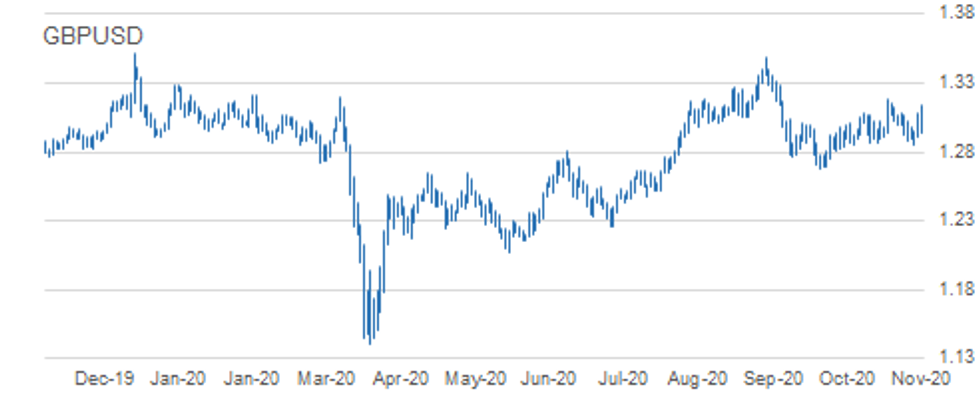
- RES 4: 1.3357 High Sep 3
- RES 3: 1.3278 2.0% 10-dma envelope
- RES 2: 1.3177 High Oct 21 and the bull trigger
- RES 1: 1.3140 Intraday high
- PRICE: 1.2990 @ 05:57 GMT Nov 4
- SUP 1: 1.2911/2855 Low Nov 3 / Low Nov 2
- SUP 2: 1.2863 Low Oct 14 and key near-term support
- SUP 3: 1.2806 Low Sep 30
- SUP 4: 1.2794 76.4% retracement of the Sep 23 - Oct 21 rally
GBPUSD is volatile, finding resistance at the overnight high of 1.3140. The outlook remains bearish following last week's extension lower. However a move below key near-term support at 1.2855, Nov 2 low is required to reinforce bearish conditions. This would pave the way for a move towards 1.2676, Sep 23 low. On the upside, clearance of key resistance at 1.3177, Oct 21 high would reinstate a bullish theme.
EUR/GBP: Bearish Trend Sequence Extends
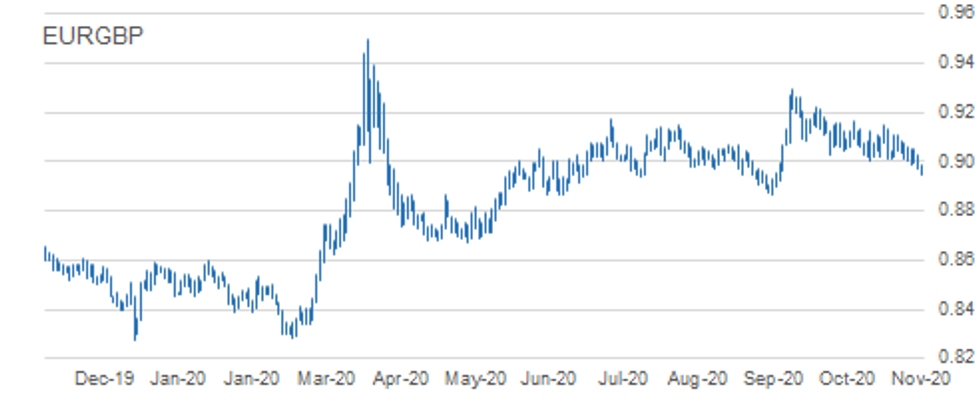
- RES 4: 0.9149 Oct 20 high
- RES 3: 0.9107 High Oct 23
- RES 2: 0.9058 50-day EMA
- RES 1: 0.9025 High Nov 3
- PRICE: 0.8976 @ 06:06 GMT Nov 4
- SUP 1: 0.8946 Intraday low
- SUP 2: 0.8924 Low Sep 7
- SUP 3: 0.8900 Low Sep 4
- SUP 4: 0.8866 Low Sep 11 and a major support
EURGBP traded lower overnight confirming an extension of the current downtrend. The cross has cleared 0.8967, 76.4% retracement of the Sep 3 - 11 rally and attention turns to 0.8900 ahead of the key support at 0.8866, Sep 3 low. The break lower overnight maintains the current bearish price sequence of lower lows and lower highs that defines a downtrend. On the upside, initial firm resistance is seen at 0.9058, the 50-day EMA.
USD/JPY: Trading Above Recent Lows
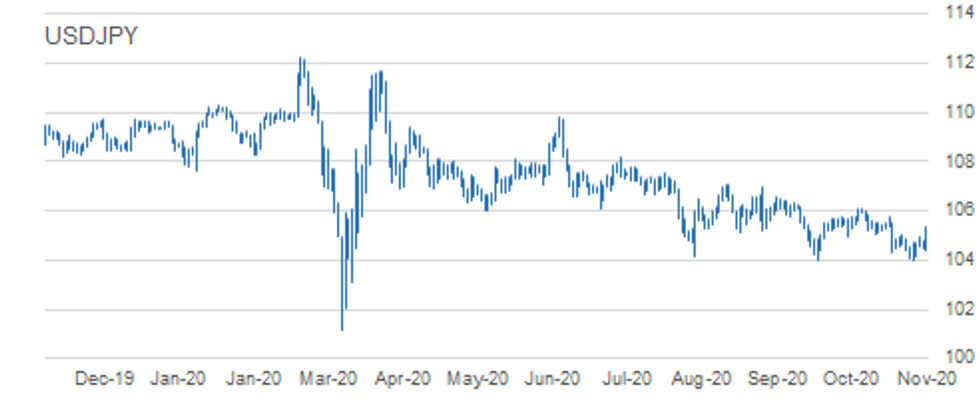
- RES 4: 105.85 High Oct 12
- RES 3: 105.75 High Oct 20
- RES 2: 105.37 50-day EMA
- RES 1: 105.34 Intraday high
- PRICE: 104.92 @ 06:17 GMT Nov 4
- SUP 1: 104.37 Intraday low
- SUP 2: 104.00 Low Sep 21 and the bear trigger
- SUP 3: 103.67 76.4% retracement of the Mar 9 - 24 rally
- SUP 4: 103.09 Low Mar 12
USDJPY gains are still considered corrective. The outlook is bearish with attention on the key 104.00 handle, Sep 21 low. Clearance of this support would suggest scope for a deeper USD sell-off within the bear channel drawn off the Mar 24 high. Price has however recovered off recent lows. A break above the overnight high of 105.34 would undermine the bearish theme and expose 105.75 instead, Oct 20 high.
EUR/JPY: Focus Is On Support
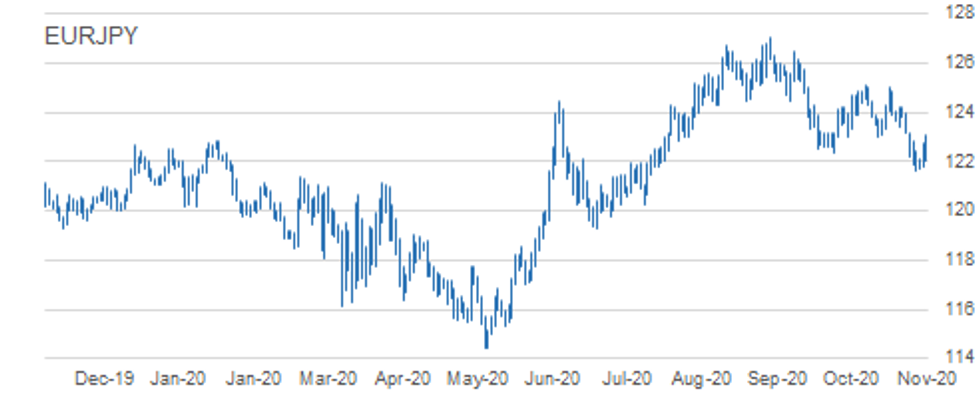
- RES 4: 123.69 50-day EMA
- RES 3: 123.27 20-day EMA
- RES 2: 123.19 High Oct 28
- RES 1: 123.07 Intraday high
- PRICE: 122.31 @ 06:21 GMT Nov 4
- SUP 1: 121.62 Low Oct 30
- SUP 2: 121.50 0.764 proj of Sep 1 - 28 decline from Oct 9 high
- SUP 3: 120.68 Bear channel base drawn off the Sep 1 high
- SUP 4: 120.39 1.000 proj of Sep 1 - 28 decline from Oct 9 high
EURJPY is off recent lows but despite this maintains a bearish tone following last week's sell-off. The cross has recently cleared support at 123.03/02 and 122.38, Sep 28 low. This move lower confirmed a resumption of the downleg that started Sep 1. Scope is seen for weakness towards 121.50 next, a Fibonacci projection. Further out, 120.39 is on the radar, also a Fibonacci projection. Initial resistance is at 123.07, today's intraday high.
AUD/USD: Clears Key Trendline Resistance
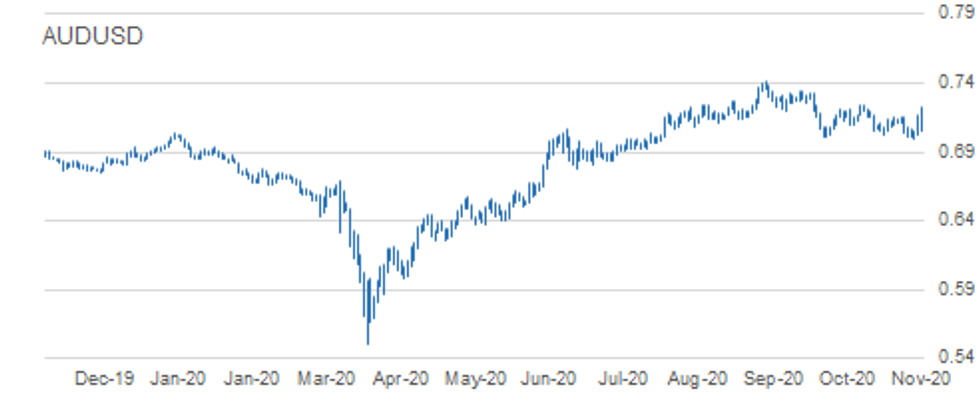
- RES 4: 0.7314 76.4% retracement of the Sep 1 - Nov 2 downleg
- RES 3: 0.7252 61.8% retracement of the Sep 1 - Nov 2 downleg
- RES 2: 0.7243 High Oct 10 and a key resistance
- RES 1: 0.7222 Intraday high
- PRICE: 0.7103 @ 06:32 GMT Nov 4
- SUP 1: 0.7049 Intraday low
- SUP 2: 0.6991 Low Nov 2
- SUP 3: 0.6965 23.6% retracement of the Mar - Sep rally
- SUP 4: 0.6931 0.764 proj of Sep 1 - 25 sell-off from Oct 9 high
AUDUSD traded firmer Tuesday but has started today's session in a volatile manner. The Aussie has cleared its key short-term trendline resistance drawn off the Sep 1 high. This signals a potential reversal, exposing resistance at 0.7243, Oct 9 high. Clearance of this hurdle would strengthen bullish conditions. On the downside, key support has been defined at 0.6991, Nov 2 low. This is also the bear trigger.
USD/CAD: Holding Above Support
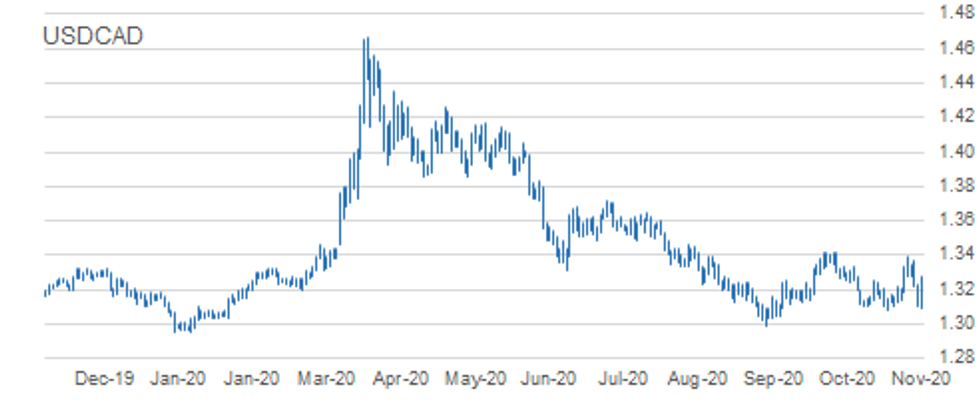
- RES 4: 1.3476 2.0% 10-dma envelope
- RES 3: 1.3421 High Sep 30 and primary resistance
- RES 2: 1.3390 High Oct 29
- RES 1: 1.3278 Intraday high
- PRICE: 1.3133 @ 06:38 GMT Nov 4
- SUP 1: 1.3096 Intraday low
- SUP 2: 1.3081 Low Oct 21 and the bear trigger
- SUP 3: 1.3047 Low Sep 7
- SUP 4: 1.2949 2.0% 10-dma envelope
USDCAD sold off sharply Monday and that trend extended well into the Tuesday close. Price action is choppy today though with the pair rebounding off the overnight low. A bullish outlook remains intact while support at 1.3081 Oct 21 low holds. Last week's break of resistance at 1.3259, Oct 15 high and of 1.3341, Oct 7 high signals scope for a climb to 1.3421, Sep 30 high and a key resistance. Sub 1.3081 level would instead expose 1.2994, Sep 1 low.
MNI KEY LEVELS
EUR/USD: MNI Key Levels
- $1.1854/61/67 Upper 1.0% 10-dma env/Oct26 high/Oct22 high
- $1.1839/49 Oct27 high/100-mma
- $1.1777/81 50-dma, Cloud top/55-dma
- $1.1757/70 21-dma/Intraday high
- $1.1736/37 38.2% 1.3993-1.0341/200-hma
- $1.1707 Cloud base
- $1.1666/70 100-dma/100-hma
- $1.1655 ***CURRENT MARKET PRICE 05:06BST WEDNESDAY***
- $1.1619/18 Lower 1.0% 10-dma env/Lower Boll Band (2%)
- $1.1603 Intraday low
- $1.1581 Jul24 low
- $1.1549/41 Lower Boll Band (3%)/Jul23 low
- $1.1507/01 Jul22 low/Lower 2.0% 10-dma env
- $1.1423/13 Jul21 low/200-wma
- $1.1403/90 Jul20 low/50-mma
GBP/USD: MNI Key Levels
- $1.3280 Sep07 high
- $1.3264 Upper 2.0% 10-dma envelope
- $1.3196 Upper Bollinger Band (3%)
- $1.3177 Oct21 high
- $1.3153 Oct22 high
- $1.3140 Intraday high
- $1.3129/34 Upper Boll Band (2%)/Upper 1.0% 10-dma env
- $1.3011 ***CURRENT MARKET PRICE 05:13BST WEDNESDAY***
- $1.3003/00 55-dma/Cloud top
- $1.2991/90/89 21-dma/200-hma/50-dma
- $1.2959/52/51 Cloud base/100-hma/50-mma
- $1.2950 200-wma
- $1.2935 Intraday low
- $1.2911 Nov03 low
- $1.2888 100-dma
EUR/GBP: MNI Key Levels
- Gbp0.9117/31 Upper 1.0% 10-dma env/Upper Boll Band (2%)
- Gbp0.9101 Cloud top
- Gbp0.9068/79 50-dma/Cloud base
- Gbp0.9051/52/61 21-dma/100-dma/55-dma
- Gbp0.9025/36 10-dma/200-hma
- Gbp0.9011 100-hma
- Gbp0.8990 Intraday high
- Gbp0.8973 ***CURRENT MARKET PRICE 05:17BST WEDNESDAY***
- Gbp0.8966 Lower Bollinger Band (2%)
- Gbp0.8945/37 Intraday low/Lower 1.0% 10-dma env
- Gbp0.8924/13 Lower Boll Band (3%)/200-dma
- Gbp0.8847 Lower 2.0% 10-dma envelope
- Gbp0.8821/14 100-wma/200-wma
- Gbp0.8796 50-mma
- Gbp0.8756 Lower 3.0% 10-dma envelope
USD/JPY: MNI Key Levels
- Y105.75 Oct20 high
- Y105.70 Upper 1.0% 10-dma envelope
- Y105.53 Oct21 high
- Y105.45 55-dma
- Y105.40 50-dma
- Y105.34 Intraday high, 76.4% 105.75-104.03
- Y105.07/17 21-dma, Cloud Kijun Sen/Cloud base
- Y104.86 ***CURRENT MARKET PRICE 05:27BST WEDNESDAY***
- Y104.69/62 Cloud Tenkan Sen/200-hma, 100-hma
- Y104.37 Intraday low
- Y104.13 Oct30 low
- Y104.07 Lower Bollinger Band (2%)
- Y104.03 Oct29 low
- Y104.00 Sep21 low
- Y103.94 200-mma
EUR/JPY: MNI Key Levels
- Y124.20 76.4% 125.00-121.62
- Y124.00/04/07 Oct27 high/Cloud base/Upper 1.0% 10-dma env
- Y123.63/71 100-dma/61.8% 125.00-121.62
- Y123.41/54 Oct23 low/21-dma
- Y123.31/36 50% 125.00-121.62/Cloud Kijun Sen
- Y123.07/19 Intraday high/Oct28 high
- Y122.79/93 200-hma/Cloud Tenkan Sen
- Y122.34 ***CURRENT MARKET PRICE 05:33BST WEDNESDAY***
- Y122.09/04 100-hma/Intraday low
- Y121.81/78/70 Nov03 low/100-wma/Nov02 low
- Y121.62/61 Oct30 low/Lower 1.0% 10-dma env
- Y121.55 Lower Bollinger Band (2%)
- Y121.47 Jul14 low
- Y121.19 200-dma
- Y120.70 Jul13 low
AUD/USD: MNI Key Levels
- $0.7249/54 50-mma/Sep17 low
- $0.7236/42/43 Upper 2.0% 10-dma env/200-wma/Oct09 high
- $0.7222/32/35 Intraday high/Upper Boll Band (2%)/Sep22 high, Oct12 high
- $0.7194 Cloud top
- $0.7181/82/90 50-dma/55-dma/Cloud base
- $0.7165 Upper 1.0% 10-dma envelope
- $0.7116/20 21-dma/100-dma
- $0.7111 ***CURRENT MARKET PRICE 05:46BST WEDNESDAY***
- $0.7086 200-hma
- $0.7057/49 100-hma/Intraday low
- $0.7028/23 Nov03 low/Lower 1.0% 10-dma env
- $0.6997/91 Lower Boll Band (2%)/Nov02 low
- $0.6973/63 Jul20 low/Jul16 low
- $0.6952/38 Lower 2.0% 10-dma env/Lower Boll Band (3%)
- $0.6921 Jul14 low
USD/CAD: MNI Key Levels
- C$1.3390/94 Oct29 high/Upper Boll Band (3%)
- C$1.3370/76 Nov02 high/100-wma
- C$1.3355 Upper 1.0% 10-dma envelope
- C$1.3320/26 100-dma/Upper Boll Band (2%)
- C$1.3297 Cloud top
- C$1.3272/78 100-hma/Intraday high, Oct29 low, 61.8% 1.3398-1.3096
- C$1.3242 Cloud base
- C$1.3235 ***CURRENT MARKET PRICE 05:52BST WEDNESDAY***
- C$1.3234 200-hma
- C$1.3208/05/94 50-dma/55-dma/21-dma
- C$1.3181/80 50-mma/Oct28 low
- C$1.3160 200-wma
- C$1.3142 Oct27 low
- C$1.3126/24 Oct26 low/Oct22 low
- C$1.3109/96 Oct23 low/Intraday low
OPTIONS: Expiries for Nov4 NY cut 1000ET (Source DTCC)
- EUR/USD: $1.1725-50(E883mln)
- USD/JPY: Y104.50($535mln), Y105.00($1.4bln), Y105.23-30($703mln), Y105.35-50($759mln), Y106.00-10($1.3bln)
- AUD/USD: $0.6930-40(A$665mln)
- USD/CNY: Cny6.56($520mln), Cny6.78($715mln)
Larger Option Pipeline
- EUR/USD: Nov06 $1.1600(E1.8bln), $1.1795-05(E1.5bln); Nov09 $1.1900(E1.5bln-EUR calls); Nov10 $1.1800(E1.2bln)
- USD/JPY: Nov05 Y105.00($964mln), Y106.06-09($1.6bln); Nov06 Y104.89-00($1.2bln); Nov10 Y104.50($1.2bln), Y105.00-05($1.1bln); Nov12 Y103.00($1.4bln)
- EUR/JPY: Nov05 Y124.50(E1.1bln)
- EUR/AUD: Nov12 A$1.6520(E973mln)
- USD/CNY: Nov05 Cny6.75($1.2bln), Cny6.80($1.9bln), Cny6.85($1.3bln); Nov06 Cny6.70($1.2bln)
To read the full story
Sign up now for free trial access to this content.
Please enter your details below.
Why MNI
MNI is the leading provider
of intelligence and analysis on the Global Fixed Income, Foreign Exchange and Energy markets. We use an innovative combination of real-time analysis, deep fundamental research and journalism to provide unique and actionable insights for traders and investors. Our "All signal, no noise" approach drives an intelligence service that is succinct and timely, which is highly regarded by our time constrained client base.Our Head Office is in London with offices in Chicago, Washington and Beijing, as well as an on the ground presence in other major financial centres across the world.
