
Why MNI
MNI is the leading provider
of intelligence and analysis on the Global Fixed Income, Foreign Exchange and Energy markets. We use an innovative combination of real-time analysis, deep fundamental research and journalism to provide unique and actionable insights for traders and investors. Our "All signal, no noise" approach drives an intelligence service that is succinct and timely, which is highly regarded by our time constrained client base.Our Head Office is in London with offices in Chicago, Washington and Beijing, as well as an on the ground presence in other major financial centres across the world.
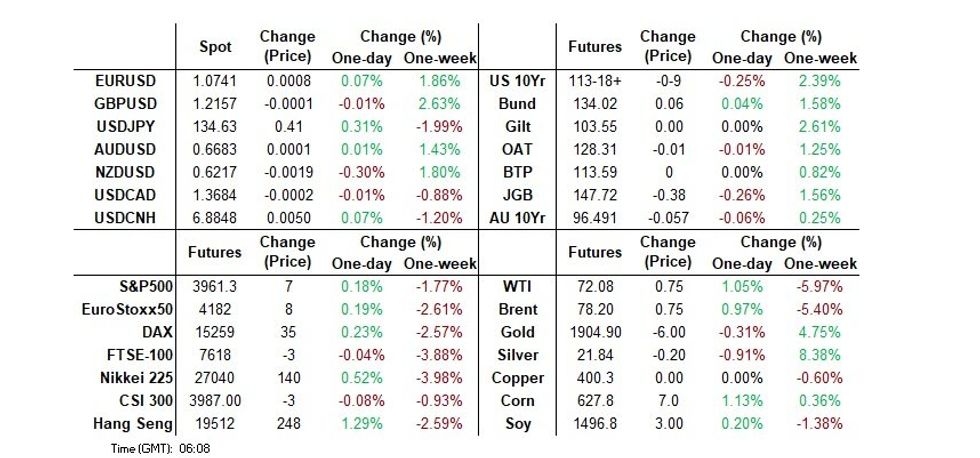
- Idiosyncracies drove NZGBs cheaper & JGBs steeper In Asia. The U.s. Tsy curve saw some light (in recent relative terms) twist flattening.
- BBDXY is little changed, NZD and JPY are both marginally pressured.
- The UK Budget headlines the London docket. Further out we have U.S. Business Inventories, Retail Sales, PPI and Empire Manufacturing.
MNI UK Issuance Deep Dive: Budget 2023 Preview
MNI View: No Rabbits from the Hat; Focus on Gilt Issuance
- There is little expectation that Hunt will deliver ‘rabbits from the hat' in the form of notable tax cuts or public sector spending hikes. The focus for investors may therefore be more on the gilt remit and the economic projections from the OBR as well as the underlying assumptions used.
- We discuss what this means for the remit, the maturity split and outline which new gilts we expect to see issued in the upcoming fiscal year.
- We also discuss the political implications.
- Finally, we summarise key analyst views.
- For the full document see:UK_Budget_Preview_Mar23.pdf

US TSYS: Curve Flattens In Asia
TYH3 deals at 110-28+, -0-01, operating in a limited 0-06 range on volume of ~70K.
- Cash Tsys sit 2bps cheaper to 1bp richer, the curve has twist flattened pivoting around 10s, with Friday's post-PCE flattening impulse ultimately proving somewhat sticky.
- Asia-Pac participants faded Friday's post-PCE cheapening in early dealing, perhaps using the opportunity to square short positions as we approach month end.
- The lingering impact of Friday's PCE print then saw Tsys retreat from session highs as the front end of the curve was pressured. However, Friday's lows remain intact in TU futures.
- We also saw some light steepener flow in the STIR space.
- Little meaningful macro headline flow was seen through the Asia-Pac session.
- In Europe today the Eurozone Economic Sentiment Indicator is the highlight of an otherwise thin data calendar, with ECB's Lane & De Cos, as well as BoE's Broadbent, headlining the regional speaker slate. Further out we will see Durable Goods Orders, Pending Home Sales and Dallas Fed Manf Activity. Fedspeak from Governor Jefferson will also cross.
JGBS: Curve Steeper On BoJ Rinban Tweak, Shunto Outcome Eyed
Weakness in the super-long end of the JGB curve dominated, with 20+-Year paper 13-16bp cheaper into the close. The remainder of the JGB benchmarks show 1bp richer to 6bp cheaper as the curve twist steepens. 10-Year JGB yields print ~0.33%.
- The long end weakness was seen on the back of the Y50bn purchases that were deployed in the BoJ’s Rinban covering the 25+-Year zone. This amount is below the lower boundary of the Y100-300bn purchase band for the sector set out in the Bank’s monthly Rinban plan. Prevailing market conditions seemingly emboldened the BoJ when it came to trimming the size of longer dated purchases (there was also a trimming of the Bank’s 5- to 10-Year JGB purchases, to the lower bound of its purchase band in that sector). Weakness in the longer end seemingly capped a rally in the intermediate zone, with futures operating within the lower half of the overnight session range, -44into the bell.
- Swap rates sit 3-11bp higher, with swap spreads wider through 5s then tighter beyond that point.
- One other factor that may have applied pressure to JGBs was growing expectations for a multi-year high round of pay rises in the shunto wage talks.
- Policymaker rhetoric continued to play down any worry surrounding the Japanese banking sector in the wake of the SVB meltdown.
- Lower tier economic data and 20-Year JGB supply headline tomorrow’s local docket.
AUSSIE BONDS: Curve Twist Flattens Ahead Of Employment Data Tomorrow
ACGBs close at or near session bests (YMM3 -3.2 & XMM3 +1.5) largely following the direction of U.S. Tsys as the cash curve twist flattened in Asia-Pac trade. Cash ACGB curve also twist flattened with the 3-year benchmark 3bp cheaper and the 10-year 2bp richer. Some leakage from NZGB cheapening on current account deficit and bond rating concerns was also likely at play. AU/US 10-year yield differential narrowed 11bp to -23bp.
- Swaps closed with rates +1bp to -2bp with the 3s10s curve 3bp flatter and the 3/10 EFP box flatter.
- Bills strip twist flattened with pricing +2 to -10bp.
- RBA dated OIS softened 5-16bp across meetings with April returning to pricing a tightening, albeit small (15% chance of a 25bp hike).
- After focusing on developments abroad for much of the week, February’s Employment Report is slated for release tomorrow. After two consecutive monthly declines the market is looking for a strong result (BBG consensus +50k) to defuse expectations of labour market stagnation. Complicating matters is the larger-than-normal number of people who indicated that they had a job to go to in the January report.
- Until then, the market will likely keep an eye on U.S. Tsys through the release of U.S. PPI and Retail Sales data.
NZGBS: Weaker As S&P Warns About Current Account Deficit
NZGBs close 16-17bp weaker with bond rating comments from S&P regarding the current account deficit weighing on the market going into the bell. NZ/US and NZ/AU 10-year yield differentials pushed respectively 5bp and 12bp wider.
- Q4 Current Account data released today showed a worse-than-expected deterioration with a -8.9% of GDP print (8.5% expected).
- BBG ran with comments from S&P that it would need to see the current account deficit narrow over the next 12 to 18 months otherwise there would be “increased pressure on the AA+ rating.”
- Swaps are 11-19bp cheaper, implying wider short-end and tighter long-end, with the 2s10s curve 8bp flatter.
- RBNZ dated OIS firms 5-22bp. April meeting pricing closed with 25bp of tightening. Terminal OCR expectations closed at 5.36%.
- Locally, Q4 GDP is slated for release tomorrow. After remaining surprisingly resilient in the face of aggressive tightening, recent data has become patchier.
- With BBG consensus expecting -0.2% Q/Q versus the +0.7% forecast by the RBNZ in its February MPS the local market has potentially another domestic driver to focus on tomorrow.
- In the interim, the market will likely keep an eye on U.S. Tsys through the release of U.S. PPI and Retail Sales data.
NEW ZEALAND: Current Account Deficit Approaches 9% Of GDP
The Q4 current account deficit came in larger than expected at $9.46bn but narrower than Q3’s upwardly revised $11.4bn deficit. But seasonally adjusted it widened to $8.5bn from $7.1bn. The year to date deficit was 8.9% of GDP up from 8.5% (revised from 7.9%), the highest since the series began in 1988 and 2.9pp wider than Q4 2022.
- While NZ is unlikely to face problems financing its large current account deficit, renewed concerns around a global recession this year could leave NZD more sensitive to external developments compared to other currencies, where current account balances are in a healthier position. According to the IMF NZ and Cyprus had the largest current account deficits in the OECD in 2022.
- The widening of the NZ deficit was due to a $10bn increase in the trade deficit and +$2.7bn in the income deficit.
- Imports of goods and services rose 25.8% y/y, driven by travel, transport, petrol and machinery. Exports increased 16.8% y/y with dairy, meat and tourism the main contributors.

Source: MNI - Market News/Refinitiv
Fig. 2: OECD 2022 current accounts % GDP

Source: MNI - Market News/IMF *NZ is today's Q4 YTD data, others are IMF 2022 estimates
NZGBS: Current Account Weighs On AU/NZ 10-year Differential
Messaging from the RBA and the RBNZ since their respective policy meeting has been at different ends of the tightening spectrum, with RBA Governor Lowe signalling a willingness to consider a policy pause and RBNZ Governor Orr retaining his hawkish anti-inflation rhetoric.
- It should therefore surprise few that AU-NZ short-end yield differentials have narrowed substantially over the past week or so. Take for example the 12-month forward OIS differential. That spread has pushed to around -150bp, its lowest level since early 2022. For reference, the differential was around -110bp at the start of the month.
- The more noteworthy development today however has been the AU-NZ 10-year differential which narrowed 11bp to around -100bp, its lowest level since the late 1990s. The larger-than-expected deterioration in NZ’s current account deficit (-8.9% of GDP Vs. -8.5% expected) and the resultant comments from S&P about bond ratings were the catalysts. With Australia’s current account at multi-decade surplus highs as a share of GDP the difference couldn’t be starker.
- While there are normally many factors at play a simple regression of the NZ/AU 10-year yield differential versus the AU-NZ 12-month forward OIS differential (over the current tightening cycle) gives a guide to the impact of needing to fund a current account deficit. At current levels, the AU/NZ 10-year differential is around 20-25bp too low.
Fig 1: AU/NZ 10-Year Yield Differential (% Y-Axis) Vs. Au/NZ 12M Fwd OIS Differential (% X-Axis)
 Source: MNI-Market News / Bloomberg
FOREX: Greenback Little Changed In Asia
BBDXY is little changed in Asia today, NZD and JPY are both marginally pressured.
- USD/JPY prints at ¥134.50/60 ~0.3% firmer today. Higher Yields in the short end of the US Treasury curves are weighing on the yen.
- Kiwi is pressured, printing at $0.6220/25. The pair fell from session highs, which were just ahead of the 200-day EMA ($0.6267) as S&P flagged that New Zealand's credit rating could come under pressure, link here. Early in the session Q4 Balance of Payments printed at -$9.458bn, wider than the 7.675bn deficit forecast. The prior read was also revised wider to -$11.403bn.
- AUD/USD was firmer post China activity data, which showed better than expected housing related outcomes. Other prints were close to expectations and A$ gains weren't sustained, now back sub 0.6690 (although AUD/NZD is still higher, last near 1.0750). For AUD/USD Upside resistance comes in at $0.6739, 20-Day EMA.
- Elsewhere moves have been modest with little follow through, EUR and GBP are marginally firmer.
- Regional equities are firmer, Hang Seng is ~1% firmer and US Equity futures are marginally firmer. The US Treasury curve is flatter.
- Final read of French CPI and EU Industrial Production headline an otherwise thin docket in Europe. Further out we have US Business Inventories, Retail Sales, PPI and Empire Manufacturing.
AUD/NZD: Relative Current Accounts Offsetting Lower Yield Spreads To Some Degree
The AUD/NZD cross is slightly higher in early dealings, with the pair last near 1.0730. We got close to 1.0740 earlier, with NZ's weaker than expected Q4 current account position weighing on NZD at the margins. See this link for more details, but NZ's current account is among the weakest in the OECD.
- The chart below overlays the AUD/NZD cross against the AU-NZ current account differential (as a % of GDP). There can be meaningful divergences between the two series, with the current backdrop a case in point, where the cross should be materially higher.
- Still, the relative balances may be one factor why the cross hasn't weakened as much as implied by rate differentials in recent weeks. It should also leave the AUD more resilient to external shocks, relative to NZD, all else equal.
- Of course, tomorrow delivers two important data outcomes in both countries with NZ Q4 GDP due (the market expects a -0.2% contraction), along with AU Feb employment (+50k forecast). These outcomes can obviously dominate near term AUD/NZD sentiment.
- In terms of levels, bears now target the 76.4% retracement of the Dec-Feb bull leg ($1.0617), a break through there opens 2022 lows at $1.0471. Bulls target the 20-Day EMA ($1.0830) to turn the tide.
Fig 1: AUD/NZD Versus AU-NZ Current Account Differential (% of GDP)
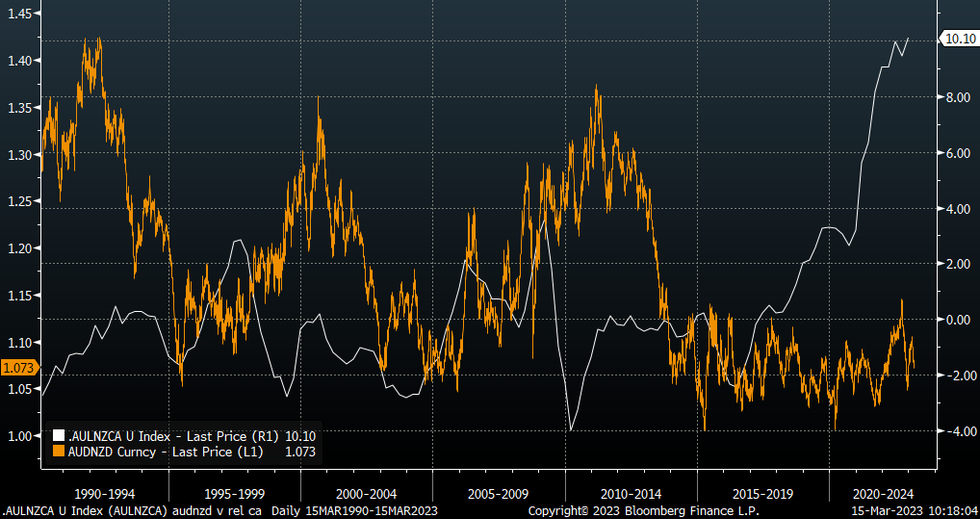
Source: MNI - Market News/Bloomberg
FX OPTIONS: Expiries for Mar15 NY cut 1000ET (Source DTCC)
- EUR/USD: $1.0500(E1.7bln), $1.0696-00(E1.8bln), $1.0730-50(E3.5bln), $1.0800-10(E932mln), $1.0830-50(E1.8bln)
- USD/JPY: Y126.00($2.5bln), Y130.00($1.0bln), Y133.00($1.6bln), Y134.00($541mln), Y135.00($668mln)
- GBP/USD: $1.1895-00(Gbp1.0bln)
- AUD/USD: $0.6675(A$502mln), $0.6720(A$926mln)
- USD/CAD: C$1.3500($744mln), C$1.3575-00($1.5bln), C$1.3725($837mln), C$1.3930-45($1.1bln)
- USD/CNY: Cny6.8600($1.2bln), Cny6.9500($1.9bln)
ASIA FX: USD/Asia Losses Trimmed As Session Progressed
USD/Asia pairs are once again mixed. Overall ranges have been modest, at least compared to earlier in the week. The early tone was for USD weakness, but this has given way to a more cautious tone this afternoon, with firmer US yields at the front end and waning equity gains, supporting the dollar. Still to come is India trade figures. Tomorrow, BI is expected to remain on hold, while China house prices are also due.
- USD/CNH got to a low near 6.8700 post the Jan-Feb activity data. The housing related measure for investment and sales were more encouraging but this was offset by as expected retail sales and slightly lower than forecast IP growth. Earlier the 1 yr MLF rate was held steady, but a larger injection in terms of MLF volumes was evident. The CNY fixing trend is near neutral. USD/CNH is back closer to 6.8850 this afternoon.
- 1 month USD/KRW got to recent lows around 1293/94 at the time of the China data outcomes, but has recovered back to +1300 now. Onshore equities are higher (+1%), but gains have been trimmed as the session progressed.
- USD/TWD spot is holding close to the 200-day MA, last around 30.58. The better equity tone helping, but higher yields are supporting the USD. Geopolitics is likely to be the other focus point. Headlines crossing that a US Congressional delegation will visit Taiwan today and tomorrow. Earlier Honduras stated it would look to establish ties with China, which would end its relations with Taiwan.
- The SGD NEER (per Goldman Sachs estimates) is marginally firmer today, recovering from recent lows post the fallout from the shift lower in global tightening expectations. The chart below shows the SGD NEER deviation from the top end of the band. We sit ~0.9% below the top end of the band currently. For USD/SGD, the pair is pressured today, down ~0.2%. The pair last prints at $1.3420/25 as the broad based USD/Asia moves spills over to SGD.
- USD/INR was offered earlier but hasn't seen much follow through. The pair is back to 82.45/50, little changed for the session. We remain within recent ranges, but be mindful of RBI intervention if we see a spike towards 83.00. The trade balance for February is on the wires today, the Bloomberg survey shows a deficit of $19.2bn is expected, slightly wider than the $17.75bn deficit seen in January.
- USD/IDR couldn't sustain the earlier dip sub 15350. The pair last tracking near 15370, around 0.10% sub yesterday's closing levels. On the downside, the 20-day EMA come in at 15304, while the simple 100-day MA is around 15420. Recall earlier in the month authorities intervened back on March 8th when we were above 15460.
MNI Bank Indonesia Preview - March 2023: BI Unchanged, Other Tools To Defend IDR
EXECUTIVE SUMMARY
- Bank Indonesia (BI) is widely expected to leave rates unchanged at 5.75% for the second consecutive month. This cycle it tightened a cumulative 225bp bringing the 7-day reverse repo rate to one of the highest in Asia. However, the previous BI statement and comments from Governor Warjiyo suggest that there isn’t any more tightening in the pipeline and that the central bank has other tools to defend the currency.
- In February underlying inflation eased to close to the mid-point of the target band and the rise in headline is expected to be temporary. BI believes it has done "sufficient" tightening to bring inflation back to the corridor in H2 2023.
- While the IDR has depreciated since the February meeting, it has made some gains in recent days as the USD weakened following banking troubles which also reduced Fed tightening expectations. If this sentiment persists, then the BI should have less to do to support the rupiah but it has said it is committed to currency stability and it has tools, other than the policy rate, to defend it.
- For the full piece, see here: BI Preview - March 2023.pdf
CHINA: Data Mixed But Economy Recovering
The swathe of China data released for February was mixed, signalling an economy recovering but still facing hurdles. Property sector results were better than expected but IP was softer. Reopening has driven a solid recovery in retail sales but there was an unexpected seasonal tick up in the unemployment rate.
- Property investment in February fell 5.7% y/y YTD after contracting 10% y/y in December, which now looks like it was the trough. Commercialised building sales rose 3.5% y/y after slumping 28.3% y/y in December. Overall non-rural investment rose 5.5%, which was stronger than expected and up from 5.1% y/y YTD.
- Retail sales rose a robust 3.5% y/y YTD in February, in line with expectations, after having been lacklustre for most of 2022. But the surveyed unemployment rate rose to 5.6% from 5.5% due to seasonal factors, whereas it was expected to decline to 5.3%.
- IP growth was disappointing moderating to 2.4% y/y YTD in February from 3.6% at the end of 2022. Output of energy-related products rose at the start of 2023 with coal ouput up 5.8% y/y and crude processing +3.3% y/y.
EQUITIES: Signs Of Life In China Housing Market Doesn't Shift Sentiment
All major regional markets are higher in the equity space, but gains have been trimmed as the session has progressed. Some markets are comfortably away from best levels, while US equity futures have tracked close to flat. The firmer US cash Tsy yield backdrop in the front end this afternoon (2yr near session highs around 4.32/4.33%, before edging lower) has likely curbed sentiment to a degree.
- The HSI is close to +1% firmer at this stage. China developers are doing better, a Bloomberg gauge up 2.43%, the first gain in 8 sessions. China's activity data showed less of a drag from property investment, while property sales rose. Part of this is likely base effects, but it may also signal a trough point from late last year for the troubled sector.
- Other China activity figures were much closer to expectations, with IP slightly softer than forecast. The market may have been hoping for more upside surprises given the recent PMI prints. The CSI 300 is +0.20% at this stage.
- Elsewhere relief in the financial sector has benefited regional banks. The Topic is up 0.75% at this stage. Tech gains are also helped. The Kospi +1.30%, while the Taiex is +0.42%.
- In SEA, Indonesian stocks are somewhat lagging, the JCI only just in positive territory. At the other end of the spectrum, Thailand stocks are up +2.60%.
GOLD: Bullion Stabilises With Increased Pricing Of Fed March Hike
Gold prices have been moving in a very narrow range during the APAC session after falling 0.5% on Tuesday following the post-SVB rally. It is currently around $1903.50/oz after an intraday high of $1905.68 and low of $1900.04 earlier. Prices are up 5% from last week’s low. The USD index is down slightly.
- Bullion’s upward momentum lost steam when a larger probability of a 25bp hike at the Fed’s March 22 meeting was priced in by the market. Prices remain above the 50-day simple moving average. Support is at $1871.60, the March 13 low, and resistance is at $1923.20.
- US February retail sales print later and are expected to decline after January’s very strong readings. The PPI for February is also released and expected to post smaller monthly rises than in January.
OIL: Crude Begins Recovery During Session, But Volatility Likely To Persist
Oil prices are up over a percent today after falling almost consistently since March 6. WTI is up 1.5% during APAC trading to be around $72.35/bbl after falling 4.4% on Tuesday. It is down 10% since last week’s peak. Brent is heading towards $80 and is currently up 1.4% to $78.50, close to the intraday high. The USD index is flat.
- Crude was supported today by stronger equities across the region and data from China indicating that the economic recovery is underway. Oil prices sank on fears that US banking problems would lead to a drop in demand. Volatility in the market is likely to continue while it waits for clarification on the banking sector and the Fed.
- China’s IP data today showed that production of energy-related products rose at the start of 2023 with crude oil up 1.8% y/y and crude processing +3.3% y/y.
- US February retail sales print later and are expected to decline after January’s very strong readings. The PPI for February is also published and expected to post smaller monthly rises than in January. Official EIA crude stocks and the IEA monthly report are released later today.
UP TODAY (TIMES GMT/LOCAL)
| Date | GMT/Local | Impact | Flag | Country | Event |
| 15/03/2023 | 0700/0800 | *** |  | SE | Inflation report |
| 15/03/2023 | 0745/0845 | *** |  | FR | HICP (f) |
| 15/03/2023 | 1000/1000 | ** |  | UK | Gilt Outright Auction Result |
| 15/03/2023 | 1000/1100 | ** |  | EU | Industrial Production |
| 15/03/2023 | 1100/0700 | ** |  | US | MBA Weekly Applications Index |
| 15/03/2023 | - | | UK | Chancellor Delivers Spring Budget, OBR Forecasts, Likely DMO Remit | |
| 15/03/2023 | 1215/0815 | ** |  | CA | CMHC Housing Starts |
| 15/03/2023 | 1230/0830 | *** | | US | Retail Sales |
| 15/03/2023 | 1230/0830 | *** | | US | PPI |
| 15/03/2023 | 1230/0830 | ** | | US | Empire State Manufacturing Survey |
| 15/03/2023 | 1300/0900 | * | | CA | CREA Existing Home Sales |
| 15/03/2023 | 1400/1000 | * | | US | Business Inventories |
| 15/03/2023 | 1400/1000 | ** | | US | NAHB Home Builder Index |
| 15/03/2023 | 1430/1030 | ** | | US | DOE Weekly Crude Oil Stocks |
| 15/03/2023 | 2000/1600 | ** | | US | TICS |
Why MNI
MNI is the leading provider
of intelligence and analysis on the Global Fixed Income, Foreign Exchange and Energy markets. We use an innovative combination of real-time analysis, deep fundamental research and journalism to provide unique and actionable insights for traders and investors. Our "All signal, no noise" approach drives an intelligence service that is succinct and timely, which is highly regarded by our time constrained client base.Our Head Office is in London with offices in Chicago, Washington and Beijing, as well as an on the ground presence in other major financial centres across the world.