
Why MNI
MNI is the leading provider
of intelligence and analysis on the Global Fixed Income, Foreign Exchange and Energy markets. We use an innovative combination of real-time analysis, deep fundamental research and journalism to provide unique and actionable insights for traders and investors. Our "All signal, no noise" approach drives an intelligence service that is succinct and timely, which is highly regarded by our time constrained client base.Our Head Office is in London with offices in Chicago, Washington and Beijing, as well as an on the ground presence in other major financial centres across the world.
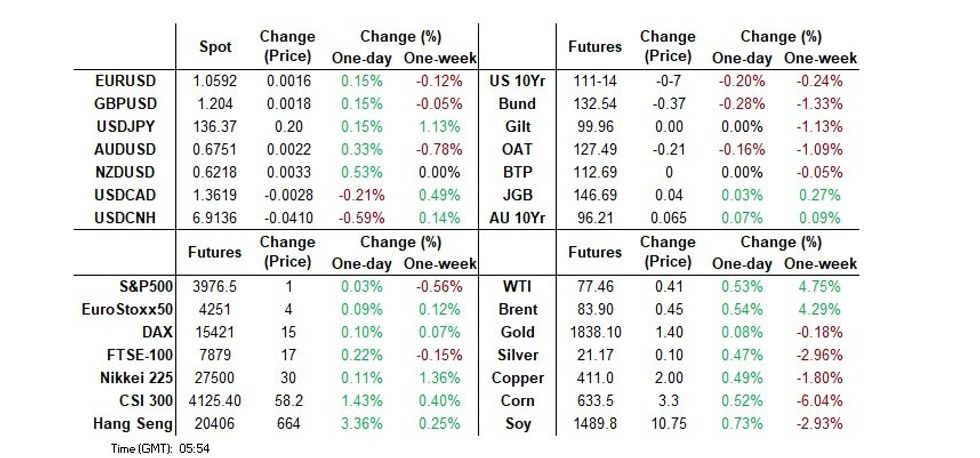
- ACGBs outperformed on much softer than expected CPI data, with RBA OIS pricing on the backfoot.
- The yuan and Chinese equities jumped on firmer than expected PMI data.
- Fed, ECB & BoE speak is due today, while regional and national CPI data out of Germany headlines the European docket.
US TSYS: Marginally Cheaper In Asia, Regional Data Drives Contained Two-Way Flows
TYM3 deals at 111-14, -0-07, just below the middle of its 0-06 range on volume of ~99K.
- Cash Tsys sit ~1bp cheaper across the major benchmarks.
- In early dealing Asia-Pac participants faded the month end flow-induced rally seen late in the NY session, also seemingly looking through the weak Consumer Confidence and MNI Chicago PMI prints.
- A recovery from session lows was facilitated by a bid in ACGBs in lieu of softer than expected monthly inflation data out of Australia.
- Gains were capped, with light pressure then see, in the wake of firmer than expected Chinese PMI data.
- In Europe today regional German and then national CPI, as well as final European Manufacturing PMIs headline. Further out U.S. Construction Spending and the ISM Manufacturing Survey will cross. We will also hear from Minneapolis Fed President Kashkari.
JGBS: Holding Firmer, Just
Events offshore largely drove JGBs on Wednesday. Initially, we saw cross-market spill over surrounding Australian data, as well as potential short trimming in lieu of reduced expectations for meaningful BoJ policy shifts in the immediate term (outside of YCC tweaks), support the JGB space in the Tokyo morning. Firmer than expected Chinese PMI data helped to cap the bid ahead of the lunch break, before applying some light pressure early in the Tokyo afternoon. That move extended into the close, with a lack of overt drivers present.
- Futures finished +4, comfortably shy of best levels. Technically, the contract is in a holding pattern.
- Cash JGBs sit little changed to ~1bp richer late on, with 7s leading, aided by the bid in futures. 10-Year JGB yields continue to hover incrementally below the BoJ’s YCC cap of 0.50%.
- BoJ board member Nakagawa stuck to the BoJ’s central line re: the need for continued monetary easing at present, while outlining question marks re: the scale of broad wage hikes that will be implemented in the immediate term and pointing to a fairly concentrated inflationary spike, which he expects to moderate soon.
- 10-Year JGB supply, an appearance from BoJ’s Takata and Q4 corporate performance data headline the domestic docket tomorrow.
AUSSIE BONDS: CPI & GDP Data Spark Rally, RBA Terminal Pricing Pulls Back
The market moving potential of today’s data didn’t disappoint with downside surprises from GDP and CPI sparking a short-end led ACGB rally as it threw weight behind the RBA’s forecast that inflation peaked in Q422. YM +9.0 & XM +6.5 at the close. Cash ACGBs close near session highs 6-9bp richer. AU/US cash yield differential tightens 6bp to -14bp, its lowest level since the RBA’s February meeting.
- Swaps strengthen with rates 7-9bp lower with the 3s10s curve 2bp steeper.
- Bills were +6-10bp richer (except IRH3) through the reds, with the back end of the whites leading.
- RBA-dated OIS pricing softens 7-15bp for meetings beyond May, with the front meetings -1 to -4bp. Terminal rate pricing closes at ~4.18% versus 4.35% yesterday.

- While substantial, it is important to remember that monthly CPI is volatile. Rather than a proper monthly series it is a rolling release measure, with the first month of the quarter only updating 62% of the basket.
- While largely ignored, China’s manufacturing PMIs beat. Commodity prices have to some extent factored in China’s reopening, but the RBA will be aware of the typical relationship between China PMIs, commodity demand, the terms of trade, and ultimately Australia’s nominal growth.
- With the market scaling back tightening expectations, ACGBs appear set for a period of outperformance. Nonetheless, the outright direction is still likely to be determined by events abroad.
AUSTRALIA: Early Sign That Inflation Has Peaked, 38% Of Index Unchanged
January CPI came in significantly lower than expected at 7.4% y/y compared with the projected 8.1% and December’s 8.4%. This is still a new series and the RBA continues to put more weight on the quarterly series. The first month of the quarter has updates for 62% of the basket and the rest is carried forward. The RBA are likely to be cautiously optimistic that this signals a Q4 peak in inflation but more data is needed and inflation remains elevated. Q1 CPI is published on April 26 and February’s on March 29.
- In the first month of Q4 2022, annual inflation fell 0.5pp and then rebounded 0.8pp the next month. Therefore, we could see some recovery from 7.4% in February. The January data didn’t contain updates on utilities (which have been rising), medical services, child care, autos or restaurant meals.
- Headline CPI fell 0.1% m/m seasonally adjusted. The trimmed mean series continues to be suspended. The CPI ex volatile items eased to 7.2% from 8.1% the previous month.
- The main contributors to the rise in inflation were housing and food. Recreation prices fell sharply on the month after rising strongly in December. The ABS notes that this component tends to be volatile. CPI ex holiday travel also eased though to 6.7% y/y from 7.4% in December.

Source: MNI - Market News/ABS/MI
NZGBS: Mid-Session Reversal On Aussie Data
NZGBs reversed morning weakness in line with the post-data rally in ACGBs. Trans-Tasman downside surprises in Q4 GDP and more importantly, monthly CPI, sparked a short-end led rally in ACGBs as it threw weight behind the RBA’s forecast that inflation peaked in Q422. NZGBs followed suit with yields 4-5bp lower at the close, versus 4-5bp higher in early trade. The 2/10 cash curve was 1bp steeper. There was no real reaction to firmer than expected Chinese PMI data.
- NZGBs added to yesterday’s outperformance versus U.S. Tsys with the NZ/US cash yield differential narrowing 9bp for the 2-year and 5bp for the 10-year. The NZ-AU 10-year differential did however widen 3bp, unwinding yesterday’s narrowing.
- Swaps close 4-7bp lower, implying a slight narrowing in swap spreads, with the 2s10s curve 1bp flatter.
- RBNZ dated OIS ignored trans-Tasman moves to close a little firmer across meetings. April meeting pricing remains at 38bp of tightening with terminal OCR pricing back close to the RBNZ’s projected OCR peak of 5.50% at 5.47%.
- Today's local data was weak. CoreLogic’s house price index sank -8.9% Y/Y, the steepest annual decline since 2009, while January Building Permits recorded another M/M fall. Some rebound had been expected after the sharp decline in multi-unit consents in December. Today’s data pre-dated much of the recent severe weather.
- Elsewhere, the Treasury announced the appointment of JLMs for the syndication of the new May-30 NZGB, with expectations for the launch to take place next week, subject to market conditions.
FOREX: USD Pressured, Regional Equities Firm Post China PMI
The greenback is pressured in Asia today, higher than expected Chinese PMI data saw regional equities firm and US Equity futures pared early losses weighing on the USD.
- Kiwi is the strongest performer in the G-10 space at the margins. NZD/USD prints at $0.6215/20, ~0.5% firmer today. The pair was pressured in the initial aftermath of weak Australian data, however losses were pared as risk appetite grew post China PMIs. The 20-day EMA at $0.6266 presents the next upside resistance.
- AUD/USD is ~0.3% firmer, printing $0.6750/55. AUD was pressured in the immediate aftermath of softer than expected Jan CPI and Q4 GDP. Support came in below $0.67, and the pair extended gains rallies in regional equities boosted risk flows. The pair sits a touch below yesterday's high at $0.6757.
- Yen is softer with risk-on flows marginally weighing. USD/JPY has observed a narrow 30 pip range and moves have been limited for the majority of the session.
- EUR and GBP are benefitting from the greenback weakness, both are ~0.2% firmer.
- Cross asset wise; S&P500 futures are flat having been down as much as 0.3%, and the Hang Seng is ~3% firmer. BBDXY is ~0.1% softer, US 10 Year Treasury Yields are ~1bp firmer.
- In Europe today regional German CPI and European Manufacturing PMIs headline. Further out US Construction Spending and the ISM Manufacturing Survey will cross.
MACRO: Some Slowing In Global Housing Correction, Momentum Remains Negative
The housing correction continues across developed markets in an orderly fashion but the latest data in a number of countries showed a slowing in the decline in house prices. People may be waiting to sell given the current environment thus reducing supply. But 3-month momentum remains negative and given that and the rally prior to 2022 prices likely have further to go before they trough. Corrections are proceeding at different speeds given mortgages in some countries are more exposed to rate hikes than others and varying indebtedness.
- Australian CoreLogic February house prices fell only 0.1% m/m to be down 9.2% y/y, higher than the average decline of 1.1% despite the RBA hiking 325bp.
- CoreLogic NZ February house prices fell 1% m/m after -0.3% bringing the annual rate to -7.2% (Jan -5%). Prices are now 9.5% off of their peak. Given the recent cyclone, data in the coming months is probably going to be hard to read.
- US FHFA house prices fell another 0.1% m/m in December and the Case-Shiller -0.3%. The US is still early in its correction as it is only 0.9% below the peak and still up 6.6% y/y despite 450bp of Fed tightening.
- Korean house prices rose 25.7% over the pandemic period and the household debt ratio is over 200%. The housing correction began in July 2022 and prices are now 5% below the peak. They fell 0.8% m/m in February to be down 4.4% y/y.
- In Europe, the Netherlands, Sweden and Norway saw house prices rise in January due to seasonal factors. Sweden’s correction is the most advanced with prices down 10.7% from the peak but only down 4.6% y/y. Nationwide house prices fell 0.6% m/m to still be up 1.2% y/y with the UK correction only in the early stages.

Source: MNI - Market News/Refinitiv/CoreLogic
FX OPTIONS: Expiries for Mar01 NY cut 1000ET (Source DTCC)
- EUR/USD: $1.0425-35(E1.7bln), $1.0450(E793mln), $1.0495-10(E1.8bln), $1.0590-00(E1.2bln), $1.0690-05(E1.4bln), $1.0725(E913mln), $1.0850(E704mln)
- USD/JPY: Y134.85-00($1.2bln)
- EUR/GBP: Gbp0.8850(E1.2bln)
- AUD/USD: $0.6776-90(A$1.3bln)
- NZD/USD: $0.6165(N$640mln), $0.6250(N$1.2bln)
- USD/CAD: C$1.3580($500mln), C$1.3600-20($859mln)
- USD/CNY: Cny6.9000($637mln), Cny7.2500($2.0bln)
ASIA FX: CNH Rallies As Growth Outlook Improves
USD/Asia pairs are lower across the board, albeit to varying degrees. CNH and THB have outperformed, while IDR has lagged somewhat. Better than expected China PMIs have been the main impetus for lower USD/Asia levels. Tomorrow, South Korea IP and the PMI is due. Customs trade data for Thailand is also out.
- USD/CNH is tracking back at the 6.9150 region, around 0.60% below NY closing levels. Lows for the session came in just under 6.9100. China equities are outperforming, while Northbound stock connect flows have returned today, for the first time since last Tuesday. For USD/CNH we are very close to the simple 200-day MA.
- 1 month USD/KRW is 0.60% lower, last near 1313/14, with onshore markets closed today. South Korea export growth remained weak in Feb, but there is scope for improvement given China's rebound.
- USD/INR has slipped in early trade, following the lead of USD/Asia lower. The pair prints at 82.50/50, around 0.20% sub yesterday's closing levels. This is still lagging broader USD/Asia moves though. The manufacturing PMI was close to last month's outcome (55.3 versus 55.4). March is a stronger seasonal month for INR, as we head into fiscal year end, although the RBI may use any better flow backdrop to rebuild its FX reserve position.
- USD/IDR has also lagged broader USD moves, with the pair only a touch below Tuesday closing levels (last at 15248). Core CPI printed weaker than expected, reaffirming the case for an on hold BI. Rate differentials with the US are close to recent lows, which may be weighing on IDR at the margin.
- THB is over 1% stronger, with USD/THB back down through 35.00 (last near 34.95). Optimism around the China pick up is fueling hopes of a better tourism picture for Thailand.
CHINA: PMIs Point To Strong Near Term Economic Activity
China official PMIs came in comfortably above expectations. The manufacturing reading at 52.6 (50.6 forecast), while non-manufacturing was 56.3 (54.9 forecast). The Caixin manufacturing PMI also beat market expectations, 51.6, versus 50.7 forecast.
- The detail of the official PMIs were solid as well. For manufacturing, new orders to 54.1 (from 50.9), while employment also rose back into expansion territory (50.2 from 47.7). New export orders also rose to 52.4 from 46.1, while output prices are back at 51.2 from 48.7 last month.
- For the services index it was a similar story, new orders to 55.8, employment to 50.2. Business activity expectations in the services sector remained very firm, 64.9, unchanged from last month.
- The detail for the Caixin print looks similar, albeit with index levels generally sitting lower, as this survey tends to focus more on the SME sector rather than large enterprises.
- These prints point to meaningful improvement in terms of near term data momentum. The first chart below overlays the manufacturing PMI (official) against IP y/y growth. The second chart is the services PMI against retail sales y/y.
Fig 1: China Official Manufacturing PMI Versus IP Growth Y/Y
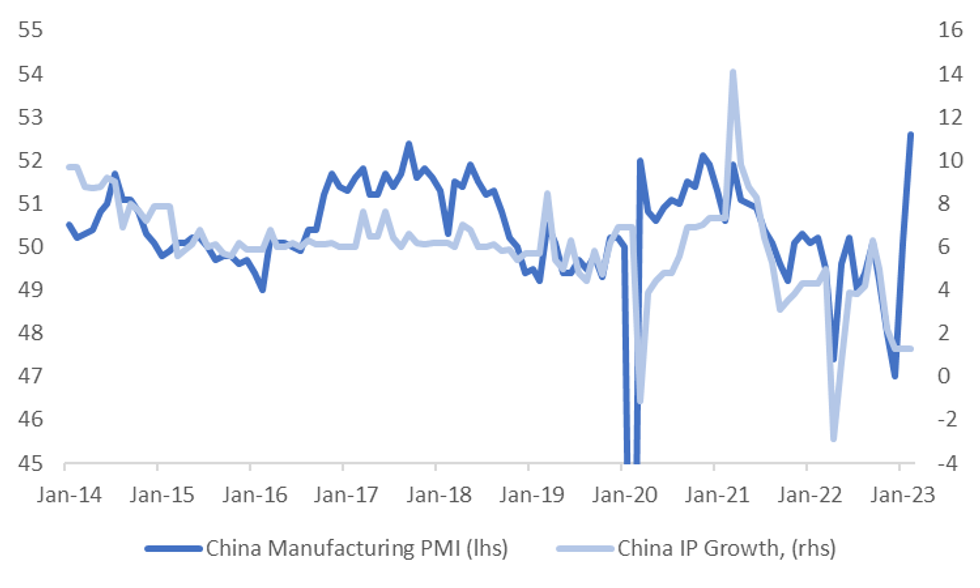
Source: MNI - Market News/Bloomberg
Fig 2: China Services (Non-Manufacturing PMI) Versus Retail Sales Y/Y
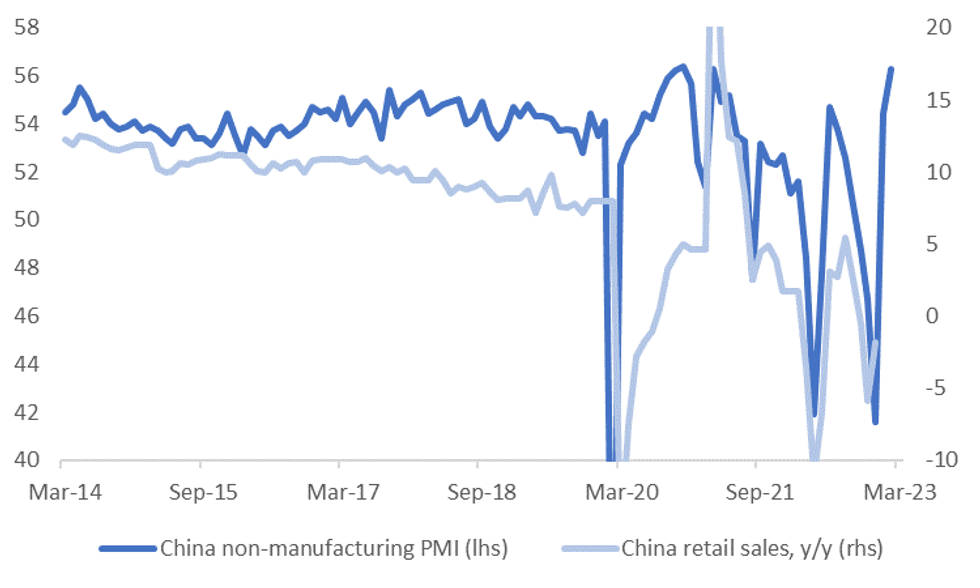
Source: MNI - Market News/Bloomberg
SOUTH KOREA: Underlying Export Data Still Soft, But China Demand May Improve
The headline South Korea export result was slightly better than expected, with exports at -7.5% y/y, versus the -8.8% consensus forecast. Still, as Feb this year had two more workings day compared to Feb last year this inflates the extent of any improvement. Average daily exports were still around recent lows at -15.9% y/y.
- The detail showed similar trends to recent months, with chip exports still weaker, -42.5%. Some offset came from firmer car exports. Imports were slightly lower than expected (+3.6% y/y, +4.1% forecast). This left the trade balance in a slightly better position, -$5.3bn, versus -$6.01bn forecast.
- By country, export growth to China remained fairly downbeat -24.2% y/y. This was a slight improvement in terms of the prior month (-31.4%) but the trend isn't showing the same degree of improvement as reflected in today's manufacturing PMI result for China, see the chart below. The correlation between the two series is around 25% over the past 3 yrs,
- The South Korea authorities do hope for better export growth form China as we progress through 2023.
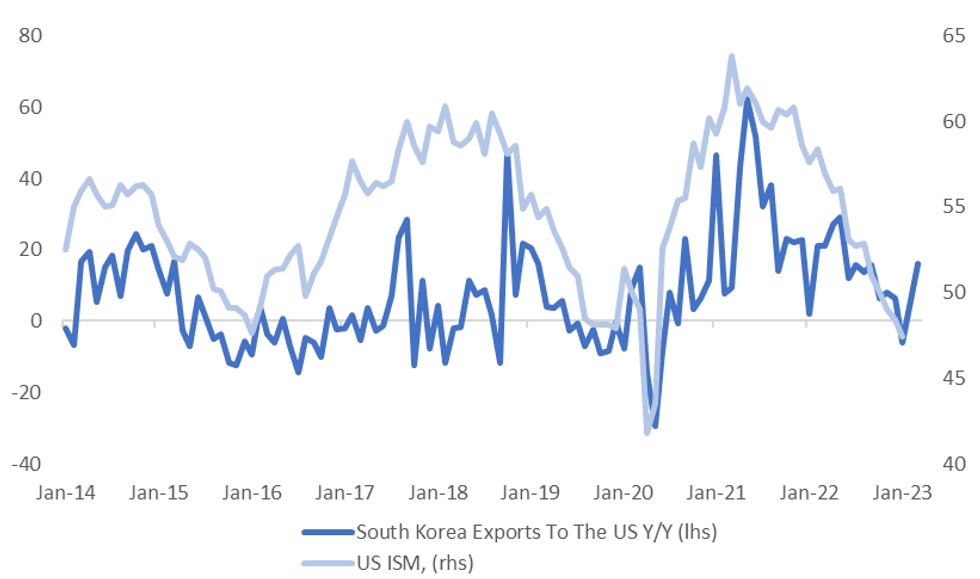
- Trends were better to the US (+16.2%) and the EU (+12.0%). Interestingly, the strength in exports to the US points to a more resilient US ISM picture (which prints late today), see the chart below. The correlation between these two series is around 65% over the past 3 years.
- The obvious caveat is that other survey data has been pointing to a less supportive ISM backdrop.
Fig 1: South Korea Export Growth To China and China PMI
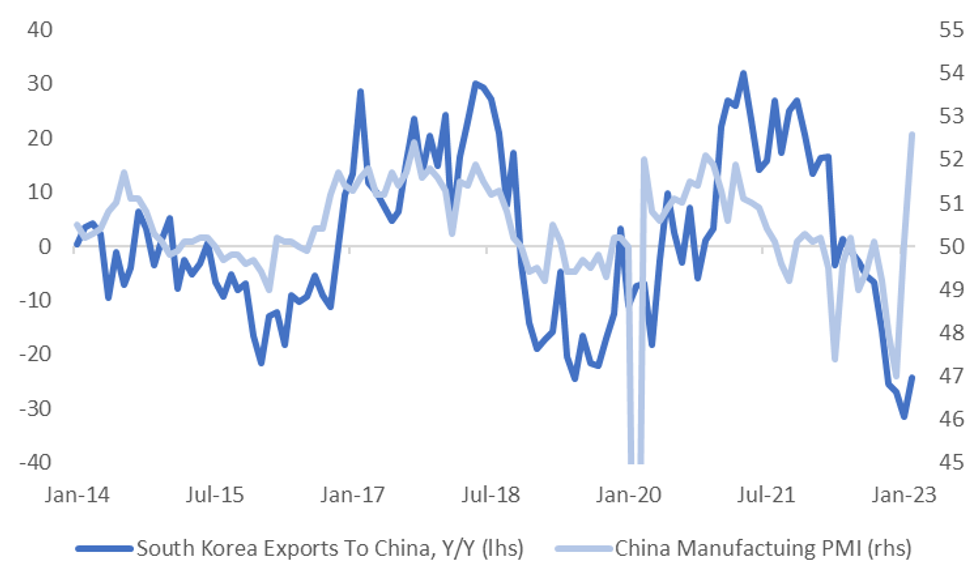
Source: MNI - Market News/Bloomberg
Fig 2: South Korea Export Growth To The US and US ISM
Source: MNI - Market News/Bloomberg
ASIA: ASEAN PMIs Generally Optimistic, Challenging Global Growth Conditions
The February manufacturing S&P Global PMIs in Thailand and Indonesia were fairly stable while the Philippines fell and Malaysia was higher. For ASEAN as a whole the PMI improved to 51.5 from 51.0, driven by new orders and output. It was its 17th consecutive month in expansionary territory. The challenging global growth environment is impacting foreign orders for this region though.
- Thailand’s manufacturing PMI was the strongest in the region rising to 54.8 from 54.5, the fastest since September 2022. However, while new orders improved they remained moderate and producers worked through their order backlog. Foreign orders continued to contract but only slightly. Output growth was its fastest on record. Business confidence improved in February. S&P Global reported that supply constraints persisted in Thailand thus input cost inflation rose and firms are still able to pass those costs on.
- Indonesia’s PMI was stable at 51.2 after 51.3 in January. Business confidence declined to its lowest in almost three years. Output in February was domestically driven as foreign orders continued to fall. There are signs of easing supply constraints with improved shipping efficiency and a shortening of supplier delivery times. Price pressures eased with input cost inflation the slowest since November 2020 and while costs are still being passed onto customers the increase in selling prices was moderate, consistent with BI pausing its tightening.

Source: MNI - Market News/S&P Global/Bloomberg
INDONESIA: Underlying Inflation Moves Down Toward Target Mid-Point, BI On Hold
Headline inflation rose to 5.5% in February from 5.3%, close to expectations. However, core inflation eased to 3.1% y/y in February from 3.3%, the lowest since August and close to the middle of Bank Indonesia’s (BI) 2%-4% target band. BI has said before that it is focused on underlying inflation to assess the extent of second round effects. It will be happy with the February result and it validates its stance of no further rate hikes. It is expected to pause again at the March 16 meeting.
- The increase in headline inflation was driven by the volatile food component. Food, drinks and tobacco rose to 7.2% y/y from 5.8% in January. Transportation moderated slightly to 13.6% from 13.9% and utilities to 3.4% from 3.6%. State-administered prices, which include public transport, fuel & cigarettes, remained high at 12.2% y/y.
- Indonesian core inflation is well below that of non-Japan Asia ex China as the latter continued to rise in January (see chart). Indonesia’s headline was also below in January. They are the first in the region to release CPI data and so Asia’s February inflation trends will evolve over March.

Source: MNI - Market News/Refinitiv/Bloomberg
EQUITIES: China/HK Shares Surge On China PMI Beats
Regional equities received a shot in the arm from the stronger than expected China PMI prints. Most of the benefit has been seen in terms of HK and China related shares, but most major indices are tracking higher at this stage. US futures are away from worst levels, with Eminis back to around flat.
- The HSI is up by 3.4% at this stage, with the high beta Tech sub-index +5% for the session so far. China mainland markets are seeing a more muted response, but the CSI 300 is still +1.50%. Northbound stock connect flows are positive, +6.5bn yuan, the first positive day of inflows since last Tuesday.
- The PMI beats point to stronger near term activity. This comes ahead of the upcoming People's Congress, which begins this weekend.
- Other markets have seen much more modest gains, with the Nikkei 225 +0.20% at this stage, while the ASX200 is around flat. Disappointing Q4 GDP data and concerns around slowed domestic spending weighing at the margins.
- Indian shares are higher, the Nifty +0.65% as it looks to move back above the 200-day MA.
GOLD: Prices Stabilising But February Was Very Negative
Gold prices are up 0.2% during APAC trading after rising 0.5% on Tuesday. This left them down 5.2% in February as Fed hawkishness and sticky US inflation weighed on the yellow metal. It is now around $1830.55/oz, close to the intraday high. The USD index is currently flat.
- Trend conditions remain bearish for gold and it continues to trade under the 50-day EMA. The next key level to watch is $1800 followed by $1787.30. A stronger-for-longer Fed pushes up the USD and Treasury yields which weigh on non-interest bearing bullion.
- Later today the February Global S&P manufacturing PMIs print and the US manufacturing ISM, which is forecast to rise to 48, and construction data. The Fed’s Kashkari is participating in a moderated discussion.
OIL: Crude Higher On China Demand Optimism Following PMIs
Oil has been steadily rising again since last week. Prices are up 0.5% during the APAC session after rising close to 1.5% on Tuesday, as China’s PMIs came in stronger than expected. WTI is currently trading around $77.45/bbl and Brent $83.90, both are close to their intraday highs. The USD index is down slightly.
- Brent has exceeded its 50-day simple moving average again and approaching the 100-day. WTI is approaching the 50-day MA, as it has underperformed Brent due to rising US crude stocks. WTI short-term support is at $73.80, the February 22 low. Moving average studies are in a bear-mode, thus the risks to WTI are pointing to the downside.
- API reported another large crude inventory build in the US of 6.2mn barrels after 9.89mn the previous week. Distillate fell 0.3mn and gasoline -1.8mn. The data reflects continued refining issues. The official EIA data is released later today. WTI reached an intraday low of $76.55 following this data and ahead of the robust February China PMI data, which bolstered commodities generally.
- Later today the February Global S&P manufacturing PMIs print and the US manufacturing ISM, which is forecast to rise to 48, and construction data. The Fed’s Kashkari is participating in a moderated discussion.
UP TODAY (TIMES GMT/LOCAL)
| Date | GMT/Local | Impact | Flag | Country | Event |
| 01/03/2023 | 0630/0730 | *** |  | DE | North Rhine Westphalia CPI |
| 01/03/2023 | 0700/0800 | ** |  | NO | Norway GDP |
| 01/03/2023 | 0815/0915 | ** |  | ES | IHS Markit Manufacturing PMI (f) |
| 01/03/2023 | 0845/0945 | ** |  | IT | S&P Global Manufacturing PMI (f) |
| 01/03/2023 | 0850/0950 | ** |  | FR | IHS Markit Manufacturing PMI (f) |
| 01/03/2023 | 0855/0955 | ** | | DE | Unemployment |
| 01/03/2023 | 0855/0955 | ** | | DE | IHS Markit Manufacturing PMI (f) |
| 01/03/2023 | 0900/1000 | ** |  | EU | IHS Markit Manufacturing PMI (f) |
| 01/03/2023 | 0900/1000 | *** | | DE | Bavaria CPI |
| 01/03/2023 | 0930/0930 | ** |  | UK | S&P Global Manufacturing PMI (Final) |
| 01/03/2023 | 0930/0930 | ** | | UK | BOE M4 |
| 01/03/2023 | 0930/0930 | ** | | UK | BOE Lending to Individuals |
| 01/03/2023 | 1000/1000 | ** | | UK | Gilt Outright Auction Result |
| 01/03/2023 | 1000/1000 | | UK | BOE Bailey Speech at Cost of Living Crisis Conference | |
| 01/03/2023 | 1000/1100 | *** | | DE | Saxony CPI |
| 01/03/2023 | 1200/0700 | ** |  | US | MBA Weekly Applications Index |
| 01/03/2023 | 1300/1400 | *** | | DE | HICP (p) |
| 01/03/2023 | 1400/0900 | | US | Minneapolis Fed's Neel Kashkari | |
| 01/03/2023 | 1445/0945 | *** | | US | IHS Markit Manufacturing Index (final) |
| 01/03/2023 | 1500/1000 | *** | | US | ISM Manufacturing Index |
| 01/03/2023 | 1500/1000 | * | | US | Construction Spending |
| 01/03/2023 | - | *** | | US | Domestic-Made Vehicle Sales |
| 01/03/2023 | 1530/1030 | ** | | US | DOE Weekly Crude Oil Stocks |
Why MNI
MNI is the leading provider
of intelligence and analysis on the Global Fixed Income, Foreign Exchange and Energy markets. We use an innovative combination of real-time analysis, deep fundamental research and journalism to provide unique and actionable insights for traders and investors. Our "All signal, no noise" approach drives an intelligence service that is succinct and timely, which is highly regarded by our time constrained client base.Our Head Office is in London with offices in Chicago, Washington and Beijing, as well as an on the ground presence in other major financial centres across the world.