
Why MNI
MNI is the leading provider
of intelligence and analysis on the Global Fixed Income, Foreign Exchange and Energy markets. We use an innovative combination of real-time analysis, deep fundamental research and journalism to provide unique and actionable insights for traders and investors. Our "All signal, no noise" approach drives an intelligence service that is succinct and timely, which is highly regarded by our time constrained client base.Our Head Office is in London with offices in Chicago, Washington and Beijing, as well as an on the ground presence in other major financial centres across the world.
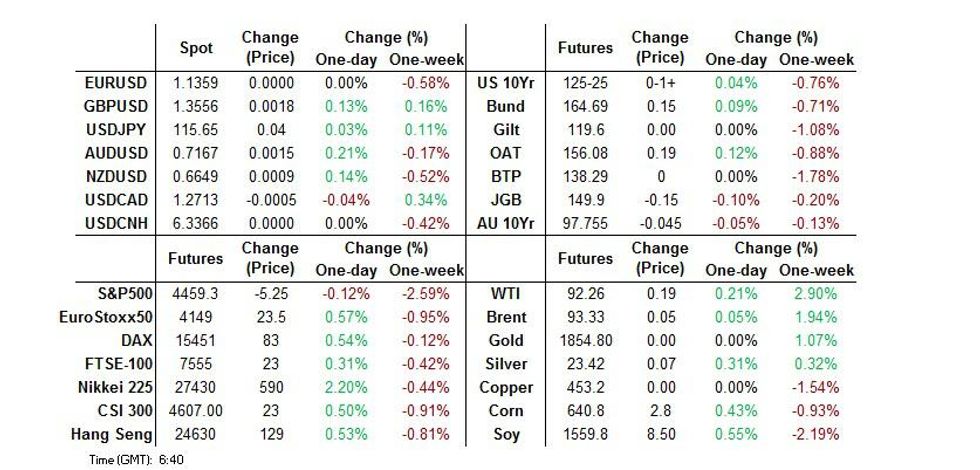
- The geopolitical angst surrounding the Ukraine situation moderated a little overnight, with U.S. Secretary of State Blinken & Russian Foreign Minister Lavrov agreeing to meet next week.
- The above headlines allowed an unwind of the early risk-off feel to the session, with a more positive tone in play thereafter.
- Friday's data docket is headlined by UK & Canadian retail sales as well as U.S. existing home sales. Speeches are due from Fed's Evans, Williams & Brainard and ECB's Vasle & Panetta.
BOND SUMMARY: Up & Down For Bonds In Asia
Early Asia trade saw flow-related regional reaction to Thursday’s NY risk-off price action (a reminder that risk-off moves pared back from their regional extremes as Asia went home on Thursday). Broader price action then flicked to risk-on as a meeting between U.S. Secretary of State Blinken & Russian counterpart Lavrov was confirmed (it will take place next week, providing there is no Russian invasion of Ukraine), which pressured core FI markets. Note that several overnight reports out of Russia pointed to a continued, partial pullback of troops and military equipment from the Ukrainian border.
- TYH2 pushed through its Thursday peak at the re-open, before the confirmation of the aforementioned Blinken-Lavrov meeting weighed. TYH2 -0-02+ at 126-11 as a result, 0-04 off worst levels, operating within a 0-15 range, on ~185K lots. Cashs Tsys sit 1.0-1.5bp cheaper across the curve. Friday’s NY docket will see the release of existing home sales data, as well as Fedspeak from Brainard, Waller, Williams & Evans (Evans is a ’23 voter, while the remainder hold permanent voting status).
- Early outperformance in the super-long end of the JGB curve stuck, even with broader risk appetite flicked back to “on.” Indeed, super-long benchmarks hit the richest levels of the session into the Tokyo close, with 40-Year JGB yields back below 1.00%. A reminder that the Japanese curve has steepened aggressively in recent weeks, with a lack of interest in the super-long end on the part of life insurers apparent, even with super-long yields tapping multi-year highs (note that yesterday’s 20-Year JGB was well-received, which surprised most). Cash JGBs were ~1.0-5.5bp richer on the day, bull flattening. Meanwhile, futures tracked wider risk appetite before moving back towards their early Tokyo peak into the bell, closing +10.
- Aussie bonds marched to the beat of the wider drum, with YM -2.0 & XM down 4.0. A WSJ interview with RBA’s Harper largely stuck to the central RBA thought process i.e. a want to push unemployment lower to foster wage growth & sustainable underlying inflation. Harper also pushed back against market pricing when it comes to RBA rate hikes, pointing to the need for delineation between RBA & U.S. Fed policy given differences in inflation in Australia & the U.S. The latest round of ACGB issuance and the release of next week’s AOFM issuance slate had no tangible impact on the wider space.
JGBS AUCTION: Japanese MOF sells Y4.6209tn 3-Month Bills:
The Japanese Ministry of Finance (MOF) sells Y4.6209tn 3-Month Bills:
- Average Yield -0.0819% (prev. -0.0908%)
- Average Price 100.0220 (prev. 100.0244)
- High Yield: -0.0763% (prev. -0.0819%)
- Low Price 100.0205 (prev. 100.0220)
- % Allotted At High Yield: 1.7558% (prev. 4.5460%)
- Bid/Cover: 2.799x (prev. 2.502x)
AUSSIE BONDS: The AOFM sells A$1.0bn of the 3.25% 21 Apr ‘25 Bond, issue #TB139:
The Australian Office of Financial Management (AOFM) sells A$1.0bn of the 3.25% 21 April 2025 Bond, issue #TB139:
- Average Yield: 1.5843% (prev. 1.3298%)
- High Yield: 1.5850% (prev. 1.3300%)
- Bid/Cover: 5.5050x (prev. 2.9433x)
- Amount allotted at highest accepted yield as percentage of amount bid at that yield 50.7% (prev. 77.8%)
- Bidders 46 (prev. 45), successful 17 (prev. 9), allocated in full 6 (prev. 1)
AUSSIE BONDS: AOFM Weekly Issuance Slate
The AOFM has released its weekly issuance slate:
- On Monday 21 February it plans to sell A$500mn of the 2.75% 21 June 2035 Bond.
- On Tuesday 22 February it plans to sell A$150mn of the 3.00% 20 September 2025 Indexed Bond.
- On Wednesday 23 February it plans to sell A$1.0bn of the 1.25% 21 May 2032 Bond.
- On Thursday 24 February it plans to sell A$1.0bn of the 27 May 2022 Note & A$1.0bn of the 24 June 2022 Note.
- On Friday 25 February it plans to sell A$500mn of the 2.75% 21 November 2029 Bond.
FOREX: Safe Havens Lose Appeal On Prospect Of Blinken/Lavrov Talks Over Ukraine
Political risk pendulum swung towards optimism after the U.S. confirmed that its chief diplomat will meet with his Russian counterpart next week for diplomatic talks on the Ukraine crisis. The news assuaged fears of imminent military escalation, even as Western press reports continued to raise the prospect of Russian false flag operations, while the Donbas rebels blamed Kyiv for renewed shelling.
- High-beta currencies regained poise after headlines re: Blinken/Lavrov negotiations hit the wires, with the kiwi leading gains after showing resilience to geopolitical risk in early trade. Safe havens fell out of favour, with USD/JPY bouncing off its 50-DMA. The rouble edged higher but its appreciation was fairly limited in comparison with yesterday's sell-off.
- The data docket is headlined by UK & Canadian retail sales as well as U.S. existing home sales. Speeches are due from Fed's Evans, Williams & Brainard and ECB's Vasle & Panetta.
FOREX OPTIONS: Expiries for Feb18 NY cut 1000ET (Source DTCC)
- EUR/USD: $1.1275-80(E959mln), $1.1325-40(E1.6bln), $1.1345-55(E2.1bln), $1.1375-90(E3.6bln), $1.1450-60(E775mln)
- USD/JPY: Y113.95-05($1.7bln), Y114.20-40($1.5bln), Y114.45-60($2.2bln), Y115.00($635mln), Y115.45-50($1.1bln), Y117.00($1.9bln)
- EUR/GBP: Gbp0.8350(E1.3bln)
- EUR/JPY: Y132.00(E510mln)
- AUD/USD: $0.7045-55(A$705mln)
- AUD/NZD: N$1.0755(A$2.0bln)
- USD/CAD: C$1.2595-00($572mln), C$1.2615-35($1.5bln), C$1.2700($1.2bln), C$1.2740-60($1.2bln), C$1.2795-00($1.1bln)
- USD/CNY: Cny6.3500-20($1.1bln)
ASIA FX: Won Leads Gains On Moderation In Geopolitical Angst
Risk sentiment improved on the back of a confirmation that U.S. & Russian chief diplomats will hold diplomatic talks next week.
- CNH: Spot USD/CNH held a particularly tight range, as Chinese headline flow failed to offer much of real note, leaving Eastern European geopolitical developments in focus.
- KRW: The won caught a bid on risk-positive headlines re: upcoming Blinken/Lavrov talks. South Korea eased Covid-19 curbs at the margin, even as daily cases topped 100k for the first time.
- IDR: The rupiah extended losses as Indonesia's BoP current account surplus shrank more than projected. Elsewhere, FinMin Indrawati said that she expects 2022 budget deficit to be equal to 4% of GDP rather than 4.1% forecast before.
- MYR: Spot USD/MYR slipped on broader risk recovery. Malaysia tweaked its policy on releasing Covid-19 data and will now report daily cases the following day, along hospital occupancy & ICU utilisation rates.
- PHP: The Philippine peso inched higher after the BSP flagged works on policy normalisation on Thursday. Bangko Sentral kept its main policy rate unchanged, in line with expectations.
- THB: Spot USD/THB trimmed some of its initial losses. The government said it will take a balanced approach in managing Covid-19 outbreak as calls for further relaxation of curbs grew louder.
EQUITIES: Off Worst Levels In Asia
Major Asia-Pac equity indices are 0.2% to 0.7% softer at writing, rising from session lows following news of US Secretary of State Blinken agreeing to meet Russian FM Lavrov next week. Most Asia-Pac equity indices had opened sharply lower on a strong negative lead from Wall St. owing to heightened Russia-Ukraine tensions during Thursday’s session (with the aforementioned Blinken-Lavrov meeting subsequently unwinding some of the geopolitical risk priced into markets).
- While the CSI300 sits 0.3% lower, its real estate sub-index notched notable gains following reports of state-run banks in the city of Heze cutting mortgage down payments for some home buyers - in a move seemingly aimed at boosting demand in the property space. Real estate developers in Hong Kong also benefited from the news, with the Hang Seng Properties Index adding 0.7% at typing.
- High-beta Chinese tech struggled, with the tech-heavy ChiNext and STAR50 sitting 1.0% and 0.6% worse off, respectively.
- U.S. e-mini equity index futures turned bid on the Blinken-Lavrov meeting news, dealing 0.7%-0.8% higher heading into the European session. Note that the 3 major e-mini contracts struggled, or indeed failed, to print below their respective Thursday troughs in overnight trade.
EQUITIES/EMERGING MARKETS: Will The Strong Decline In Chinese Real M1 Weigh on EM Financials?
- The surge in ST rates amid aggressive tightening cycles run by EM central banks (Latam/CEEMEA ex-Turkey) to combat inflation has been driving financial equities to new highs in recent months.
- EM MSCI Financials (MXEF0FN index) broke above its key resistance at 351.10 (61.8% Fibo retracement of the 223.80 – 429.80 range) in January and recently tested its 366.74 resistance, which corresponds to the June 2018 highs.
- While new highs in ST rates combined with 'easing' geopolitical tensions could continue to support EM financial equities in the short term, the sharp contraction in China M1 money supply questions the sustainability of the momentum in EM cyclical stocks.
- We saw earlier this month that China M1 money supply contracted sharply by 1.9% YoY in January (vs. +3.2% exp.), down from +3.5% the previous month, its first decline in data since 1997.
- The downturn in M1 was mainly driven by a 5.3% drop in corporate deposits (represents 80% of M1 supply) attributed to the Lunar New Year as companies generally give employees bonuses before the holiday (transferring money from corporate to consumer accounts).
- Even though there is a strong seasonality in January data due to the Lunar New Year, momentum on money supply (M1) has been falling in the past year, which historically had strong implications for domestic and international asset prices.
- The chart below shows that China real M1 money growth, which we compute as the difference between M1 YoY and PPI inflation, has strongly led EM cyclical stocks (financials) by 6 months in the past cycle.
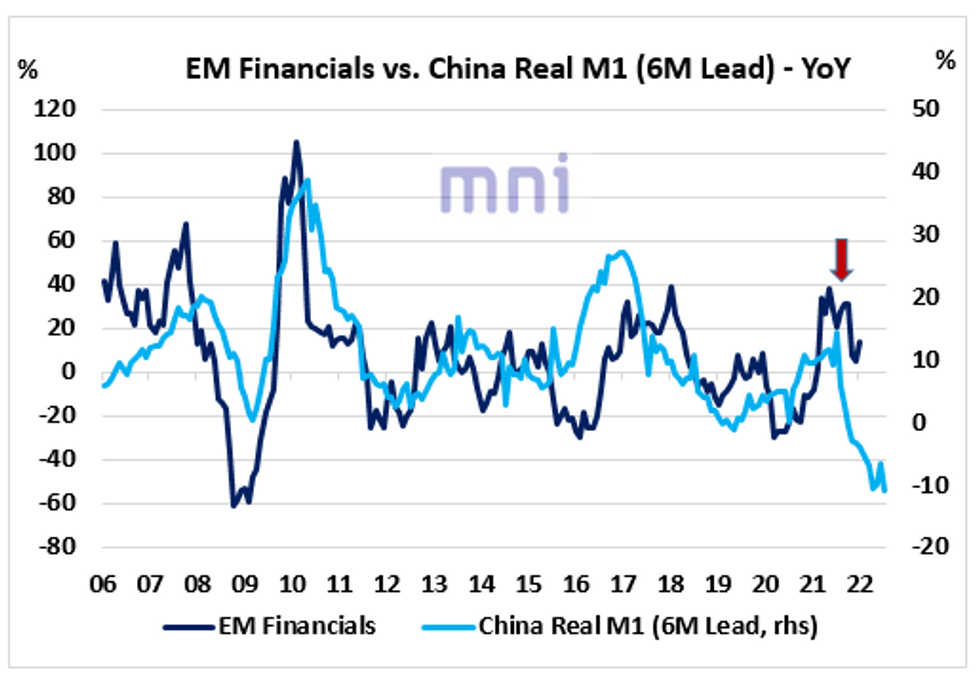
Source: Bloomberg/MNI
GOLD: Fresh Highs In Asia Amidst Ukraine Risk
Gold is ~$7/oz lower, printing $1,891.5/oz at writing, backing off from fresh eight-month highs made earlier in the session. The pullback came as Ukraine-induced safe haven demand eased a little overnight, following news of U.S. Secretary of State Blinken accepting an invitation to meet with Russian FM Lavrov late next week. Still, the proximity to multi-month highs points to continued worry when it comes to the Russia-Ukraine standoff.
- To recap, gold added the best part of $30/oz on Thursday as reports of indirect fire between Ukraine and pro-Russian separatists (within the separatist region of Luhansk) kicked geopolitical tensions higher. U.S. warnings of a possible Russian invasion of Ukraine continued to resonate, with spill over into early Asia trade evident, before the aforementioned pullback took place.
- Looking to technical levels, bullion remains a long way from support at $1,844.7 (Feb 15 low), while resistance at $1,903.1 (Jun 11 ’21 high) remains intact. A break through the latter would expose $1,916.6 (Jun 1 ’21 high).
OIL: Lower In Asia
WTI is ~-$0.70 and Brent is ~-$0.50 at typing. News of U.S. Secretary of State Blinken accepting an invitation to meet Russian FM Lavrov next week weighed on both benchmarks in Asia-Pac dealing. Note that the benchmarks still operate comfortably above their respective Wednesday troughs.
- Meanwhile, hope surrounding the potential for a U.S.-Iran nuclear deal remain elevated after a draft agreement re: the matter was flagged by Reuters on Thursday. The news agency suggested that most of the terms have been finalised, with some “thorny issues” still outstanding.
- In crude-specific news, the near-term supply outlook remains tight. U.S. shale producers continue to be wary when it comes to ramping up production, even in the wake of the recent surge in crude prices, with Devon Energy Corp. CEO Muncrief telling Bloomberg that the company has “had enough head fakes that we’re going to be very thoughtful in ramping activity up”.
- Looking to technical levels, recent dips in both benchmarks remain corrective. WTI and Brent sit above support at $88.41 (Feb 9 low) and $89.93 (Feb 8) respectively, while resistance remains situated at Feb 14 highs ($95.82 for WTI and $96.78 for Brent).
COMMODITIES: Nat Gas and Oil Confirm Once Again Their ‘Inflation-Hedge’ Status
- Historically, investors have viewed energy commodities as the best 'inflation hedges' when inflationary pressures start to rise.
- The bottom chart shows the average monthly performance of 10 of the most traded commodities since 1980 (Times series start in 1983 for oil, 1989 for copper and 1990 for Nat gas) when inflation is accelerating (i.e. 1Y change in CPI inflation is positive).
- Oil and Nat gas come at the top, averaging 1.9% and 1.7% in monthly returns.
- Hence, with inflation constantly surprising positively in most of the DM and EM economies in the past year, momentum on energy commodities has remained firm since the beginning of 2021.
- The top chart shows that WTI and Nat gas have been the second and third best performing commodities since the start of last year, up 95% and 82%, respectively.
- The best performing commodity since the start of 2021 has been coffee (up 97.5%), which production has been significantly impacted by the supply chain disruption and natural phenomenon.
- As a reminder, the drought in Brazil last year has been one of the major factors behind the increase in prices, with some of the biggest coffee farms in the world receiving less than half of the usual rainfall that they were expecting.
- According to analysts, drought and severe frost are estimated to have destroyed over 20% of Brazil’s coffee plants (Brazil accounts for half of the world total supply).
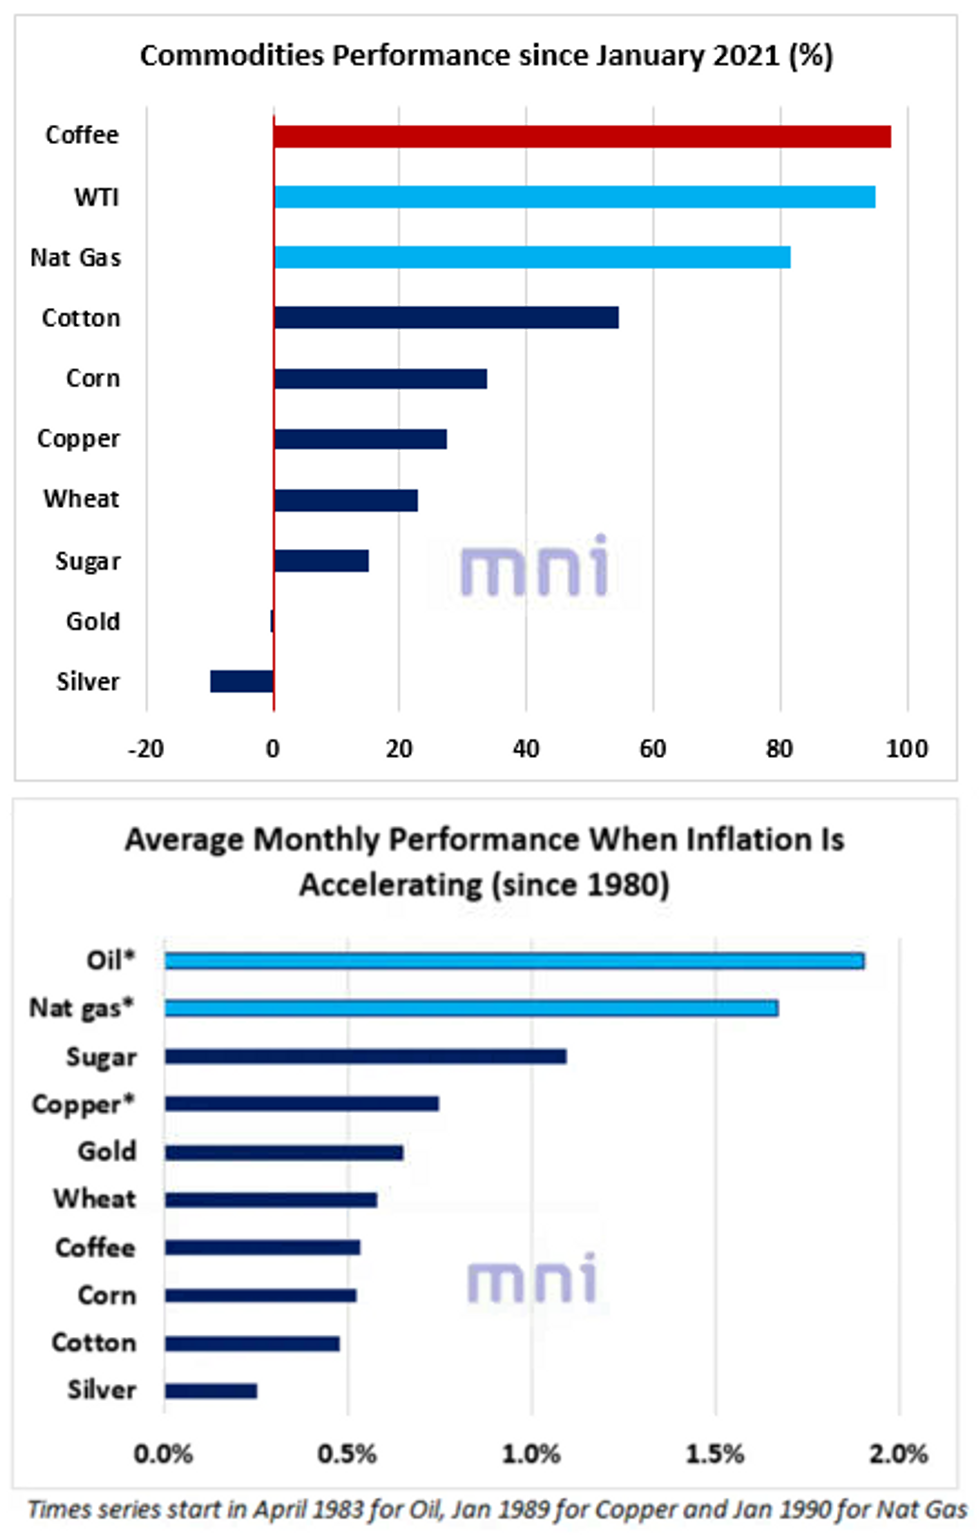
Source: Bloomberg/MNI.
UP TODAY (Times GMT/Local)
| Date | GMT/Local | Impact | Flag | Country | Event |
| 18/02/2022 | 0700/0800 | *** |  | SE | Inflation report |
| 18/02/2022 | 0700/0700 | *** |  | UK | Retail Sales |
| 18/02/2022 | 0745/0845 | *** |  | FR | HICP (f) |
| 18/02/2022 | 0900/1000 | ** |  | EU | EZ Current Acc |
| 18/02/2022 | 1000/1100 | ** | | EU | construction production |
| 18/02/2022 | 1300/1400 | | EU | ECB Elderson speech on industry climate risks | |
| 18/02/2022 | - | | EU | ECB Lagarde at G20 CB Governors Meeting | |
| 18/02/2022 | 1330/0830 | ** |  | CA | Retail Trade |
| 18/02/2022 | 1500/1000 | *** |  | US | NAR existing home sales |
| 18/02/2022 | 1500/1000 | * | | US | Services Revenues |
| 18/02/2022 | 1500/1600 | ** | | EU | consumer confidence indicator (p) |
| 18/02/2022 | 1515/1015 | | US | Chicago Fed's Charles Evans | |
| 18/02/2022 | 1515/1015 | | US | Fed Governor Christopher Waller | |
| 18/02/2022 | 1600/1100 | | US | New York Fed's John Williams | |
| 18/02/2022 | 1830/1930 | | EU | ECB Panetta on CB digital currencies | |
| 18/02/2022 | 1830/1330 | | US | Fed Governor Lael Brainard |
Why MNI
MNI is the leading provider
of intelligence and analysis on the Global Fixed Income, Foreign Exchange and Energy markets. We use an innovative combination of real-time analysis, deep fundamental research and journalism to provide unique and actionable insights for traders and investors. Our "All signal, no noise" approach drives an intelligence service that is succinct and timely, which is highly regarded by our time constrained client base.Our Head Office is in London with offices in Chicago, Washington and Beijing, as well as an on the ground presence in other major financial centres across the world.