
Free Trial
Why MNI
MNI is the leading provider
of intelligence and analysis on the Global Fixed Income, Foreign Exchange and Energy markets. We use an innovative combination of real-time analysis, deep fundamental research and journalism to provide unique and actionable insights for traders and investors. Our "All signal, no noise" approach drives an intelligence service that is succinct and timely, which is highly regarded by our time constrained client base.Our Head Office is in London with offices in Chicago, Washington and Beijing, as well as an on the ground presence in other major financial centres across the world.
Executive Summary:
- We use a moving average (MA) study to monitor long-term trends in the markets.
- This looks at the slope of the MA to determine the direction of a trend.
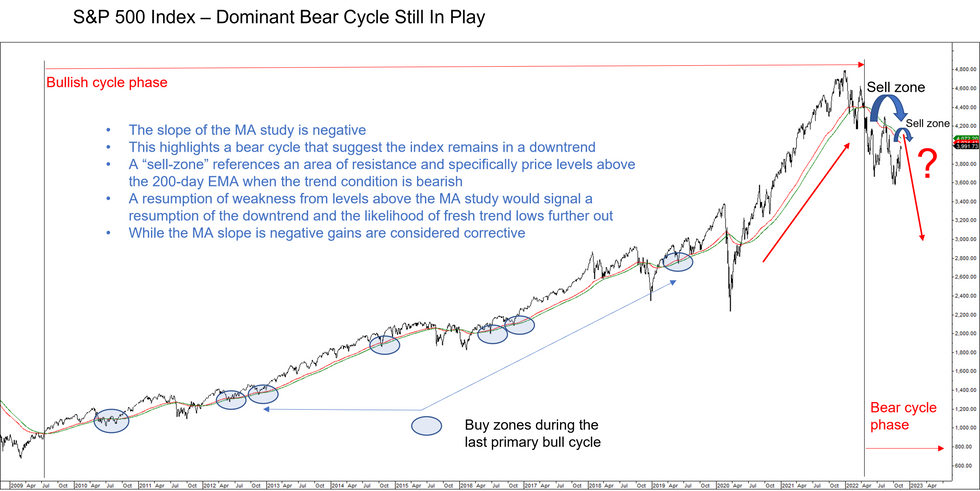
- Currently, this trend indicator highlights a dominant downtrend in the S&P 500 Index and suggests that the latest recovery is a correction.
- Price is approaching an area of resistance known as a sell-zone where a reversal, if seen, would signal a resumption of the medium-term downtrend.
The last major bull cycle in the S&P 500 Index started in November 2009 and ended early January this year.
- We use a moving average (MA) study to monitor long-term trends in the markets. This involves the use of a 200-day exponential MA as the first input. A second average is determined by calculating an EMA of the 200-day period. The position of these two averages determines the slope of the study and the slope defines the direction of the trend.
- When the slope of the MA study is positive the trend is up. A negative slope defines a downtrend.
- In an uptrend, price levels at or below the 200-day EMA, should represent an area where a pick-up in demand ultimately leads to a resumption of the uptrend. Price levels below the 200-day EMA are known as buy-zones. If prices recover from this zone and resume the uptrend, this outcome validates the trend. As long as this condition is met, the uptrend remains intact. This relationship held on a number of occasions (see chart) during the last major bull cycle. Even a number of deep corrections were short-lived and a recovery in prices quickly re-established the uptrend.
- Currently, the picture is different and a bear cycle has been in place since the beginning of this year. In May, the slope of the MA study turned negative and confirmed a downtrend.
- In a downtrend, the focus is on sell-zones - prices levels above the 200-day EMA and is also referred to as a resistance zone. A recovery in the index from the mid-June lows entered the resistance zone in August that started at levels above the 4220.00 area (price levels above the 200-day EMA). The index failed to hold on to the August highs and a reversal resulted in a resumption of the dominant downtrend and fresh trend lows by late September and October. The reversal in August reinforced the primary downtrend.
- The index is currently recovering from its October lows and remains in a short-term bull cycle. However, based on the MA study, the recovery since the October 13 low of 3491.58 is considered corrective and the trend study continues to highlight a medium-term downtrend.
- If during the current bull cycle, the index trades above the 200-day EMA, currently at 4072.00, it will enter the sell-zone (see chart). A subsequent reversal will signal a resumption of this year’s downtrend, leaving the October lows exposed. A break of the October lows would once again reinforce the current downtrend.
To conclude, this year’s bear cycle does not appear to be over. Recent gains are considered corrective. If the index trades above the 200-day EMA and fails to hold on to its gains, a reversal would signal a resumption of the downtrend. The slope of the MA study needs reverse and confirm a positive slope to signal a major reversal of this year's downtrend.
Why MNI
MNI is the leading provider
of intelligence and analysis on the Global Fixed Income, Foreign Exchange and Energy markets. We use an innovative combination of real-time analysis, deep fundamental research and journalism to provide unique and actionable insights for traders and investors. Our "All signal, no noise" approach drives an intelligence service that is succinct and timely, which is highly regarded by our time constrained client base.Our Head Office is in London with offices in Chicago, Washington and Beijing, as well as an on the ground presence in other major financial centres across the world.
We are facing technical issues, please contact our team.
ok
Your request was sent sucessfully! Our team will contact you soon.
ok