
Why MNI
MNI is the leading provider
of intelligence and analysis on the Global Fixed Income, Foreign Exchange and Energy markets. We use an innovative combination of real-time analysis, deep fundamental research and journalism to provide unique and actionable insights for traders and investors. Our "All signal, no noise" approach drives an intelligence service that is succinct and timely, which is highly regarded by our time constrained client base.Our Head Office is in London with offices in Chicago, Washington and Beijing, as well as an on the ground presence in other major financial centres across the world.
Executive Summary:
- USJPY has been in an uptrend since a reversal in early January 2021.
- Looking at various price frequencies, monthly and daily, technical trend signals suggest the direction is likely to remain up.
- This highlights potential for an appreciation towards 120.00 next.
USDJPY has been in an uptrend since early January 2021 where it reversed from a 102.59 low. Technical signals suggest the bull trend remains intact and that during Q1, a continued appreciation in USDJPY is likely ahead of the next psychological level of 120.00.
A point and figure (P&F) chart provides a clear overview of the current uptrend. This chart applies a moving average study to determine the slope of the average. The slope verifies the trend direction and assists in identifying areas of support - the buy zone - where demand is likely to confirm a resumption of the primary uptrend.
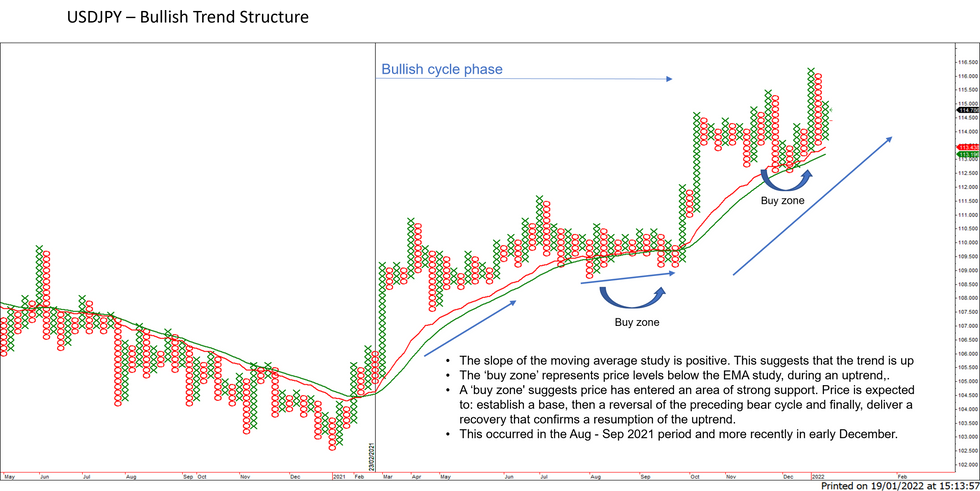
In the P&F chart above, the key observations are:
- The slope of the moving average study is positive.
- This suggests that the trend is up and note that this condition has been in place since February 2021.
- The ‘buy zone’ represents price levels below the EMA study, during an uptrend. A ‘buy zone' highlights an area of strong support. Once in this zone, price is expected to:
- Establish a base.
- Highlight a reversal of the preceding bear cycle.
- Finally, deliver a recovery that confirms a resumption of the uptrend.
- This occurred in the Aug - Sep 2021 period and more recently in early December.
- A key support on this chart has been defined at 112.60, the late Nov early Dec lows. A P&F double bottom on the chart at 112.60 suggests that a break, if seen, would signal a broader top in the trend.
- With the current uptrend intact, potential exists for a climb towards the the psychological 120.00 handle.
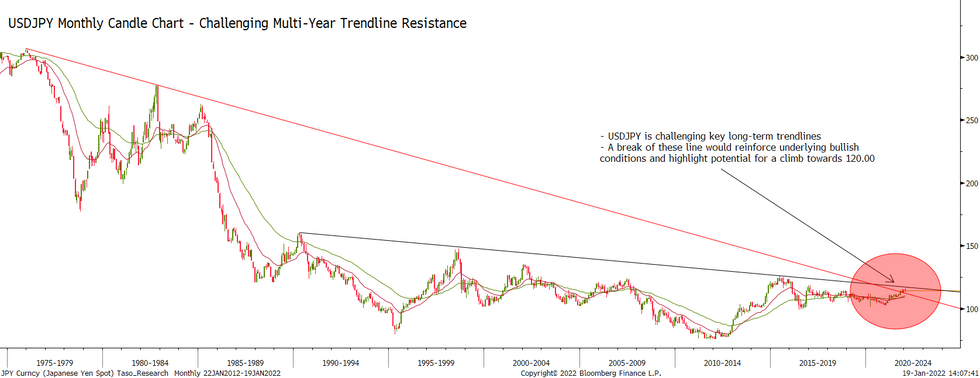
The monthly chart above highlights some interesting trend developments and key chart points.
- A long-term trendline resistance drawn from the Dec 1975 highs has been breached, in Oct last year.
- This has exposed a second flatter line, drawn from the Apr 1990 high. The line intersects at 116.95 this month and a break would reinforce the current bullish set-up.
- Note that these trendlines only highlight important chart points and resistance.
- A break would merely reinforce current conditions and would not represent a major long-term trend reversal.
- Gains above 120.00 would suggest potential for a climb towards a key resistance at 125.86, the Jun 2015 high over the medium-term.
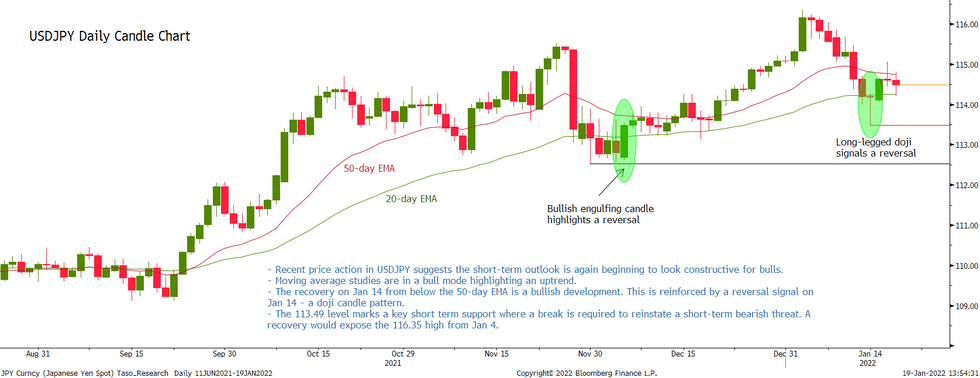
Recent price action in USDJPY in the chart above suggests the short-term outlook is again beginning to appear favourable for bulls.
- Moving average studies are in a bull mode highlighting an uptrend.
- The recovery on Jan 14 from below the 50-day EMA is a bullish development. This is reinforced by a reversal signal on Jan 14 - a doji candle pattern.
- The 113.49 level marks a key short term support where a break is required to reinstate a short-term bearish threat. A recovery would expose the 116.35 high from Jan 4. A break here would confirm a resumption of the uptrend.
Why MNI
MNI is the leading provider
of intelligence and analysis on the Global Fixed Income, Foreign Exchange and Energy markets. We use an innovative combination of real-time analysis, deep fundamental research and journalism to provide unique and actionable insights for traders and investors. Our "All signal, no noise" approach drives an intelligence service that is succinct and timely, which is highly regarded by our time constrained client base.Our Head Office is in London with offices in Chicago, Washington and Beijing, as well as an on the ground presence in other major financial centres across the world.