-
Policy
Policy
Exclusive interviews with leading policymakers that convey the true policy message that impacts markets.
LATEST FROM POLICY: -
EM Policy
EM Policy
Exclusive interviews with leading policymakers that convey the true policy message that impacts markets.
LATEST FROM EM POLICY: -
G10 Markets
G10 Markets
Real-time insight on key fixed income and fx markets.
Launch MNI PodcastsFixed IncomeFI Markets AnalysisCentral Bank PreviewsFI PiFixed Income Technical AnalysisUS$ Credit Supply PipelineGilt Week AheadGlobal IssuanceEurozoneUKUSDeep DiveGlobal Issuance CalendarsEZ/UK Bond Auction CalendarEZ/UK T-bill Auction CalendarUS Treasury Auction CalendarPolitical RiskMNI Political Risk AnalysisMNI Political Risk - US Daily BriefMNI Political Risk - The week AheadElection Previews -
Emerging Markets
Emerging Markets
Real-time insight of emerging markets in CEMEA, Asia and LatAm region
-
Commodities
-
Credit
Credit
Real time insight of credit markets
-
Data
-
Global Macro
Global Macro
Actionable insight on monetary policy, balance sheet and inflation with focus on global issuance. Analysis on key political risk impacting the global markets.
Global MacroDM Central Bank PreviewsDM Central Bank ReviewsEM Central Bank PreviewsEM Central Bank ReviewsBalance Sheet AnalysisData AnalysisEurozone DataUK DataUS DataAPAC DataInflation InsightEmployment InsightGlobal IssuanceEurozoneUKUSDeep DiveGlobal Issuance Calendars EZ/UK Bond Auction Calendar EZ/UK T-bill Auction Calendar US Treasury Auction Calendar Global Macro Weekly -
About Us
To read the full story
Sign up now for free trial access to this content.
Please enter your details below.
Why MNI
MNI is the leading provider
of intelligence and analysis on the Global Fixed Income, Foreign Exchange and Energy markets. We use an innovative combination of real-time analysis, deep fundamental research and journalism to provide unique and actionable insights for traders and investors. Our "All signal, no noise" approach drives an intelligence service that is succinct and timely, which is highly regarded by our time constrained client base.Our Head Office is in London with offices in Chicago, Washington and Beijing, as well as an on the ground presence in other major financial centres across the world.
Real-time Actionable Insight
Get the latest on Central Bank Policy and FX & FI Markets to help inform both your strategic and tactical decision-making.
Free AccessMNI Morning Commodity Analysis
OVERVIEW
OIL: Softer Greenback Allows Crude To Edge Away From Lows
WTI and Brent sit ~$0.20 below their respective settlement levels in early European hours, with a softer USD allowing the major crude benchmarks to recover from worst levels in Asia-Pac hours.
- COVID-19 matters continue to provide headwinds for the space, stalling crude's multi-month recovery, with fresh outbreaks across the globe eyed by participants.
- Elsewhere, in terms of market specifics, Friday saw RTRS sources note that "Mexico has asked top Wall Street banks to submit quotes for its giant oil hedging program." A reminder that the country's hedging scheme is the largest in the world.
GOLD: Gold Continues To Glisten
A softer greenback propelled the yellow metal to fresh all-time highs in Asia-Pac trade, with U.S. fiscal jitters and fresh pockets of COVID-19 worry providing further support for bullion in early trade this week, and little to counter these factors. The rally has continued into European hours with spot last dealing just shy of $1,938/oz.
TECHNICAL UPDATES
Brent Techs (U20): Bulls Pause For Breath
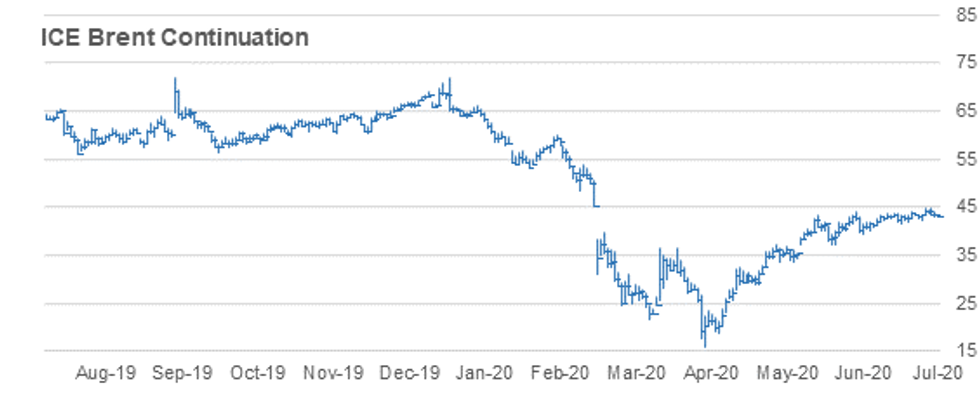
- RES 4: $48.69 - Low Mar 2
- RES 3: $46.34 - Low Mar 6 and gap high on the daily chart
- RES 2: $45.86 - 50.0% retracement of the Jan - Apr sell-off
- RES 1: $44.89 - High Jul 21 and the bull trigger
- PRICE: $43.33 @ 06:46 BST Jul 27
- SUP 1: $42.79 - Low Jul 24
- SUP 2: $42.36 - Low Jul 20 and key intraday support
- SUP 3: $41.32 - Low Jul 10
- SUP 4: $41.17 - 50-day EMA
Brent futures remain bullish although the contract found resistance last week at $44.89, Jul 21 high. Last week's gains resulted in a breach of former key resistance at $43.97, Jun 23 high. This confirmed a resumption of the uptrend that has been in place since Apr 22. It sets the scene for an extension towards $45.86, a Fibonacci retracement and $46.34. Initial firm support has been defined at $42.36, Jul 20 low.
ICE GASOIL (Q20): Bullish Theme Remains Intact
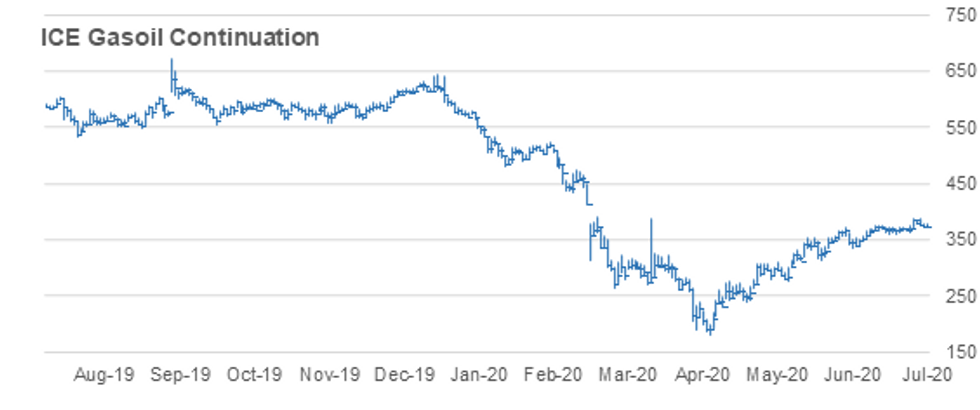
- RES 4: $418.25 - High Apr 2
- RES 3: $401.00 - High Mar 11
- RES 2: $400.00 - Psychological round number
- RES 1: $388.50 - High Jul 21 and the bull trigger
- PRICE: $374.50 @ 08:25 BST Jul 27
- SUP 1: $361.50 - Low Jul 20
- SUP 2: $358.75 - Low Jul 10 and key support
- SUP 3: $354.64 - 50-day EMA
- SUP 4: $340.25 - Low Jun 29
Gasoil futures traded higher last week breaching the former key resistance at $375.75, Jul 6 high. The move through this hurdle confirmed a resumption of the uptrend that has been in place since the reversal on Apr 28. This sets the scene for an extension higher towards the $400.00 psychological level next. On the downside, initial firm support has been defined at $361.50, Jul 20 low. Retracements are considered corrective.
NYMEX HO (Q20): Trendline Support Tested
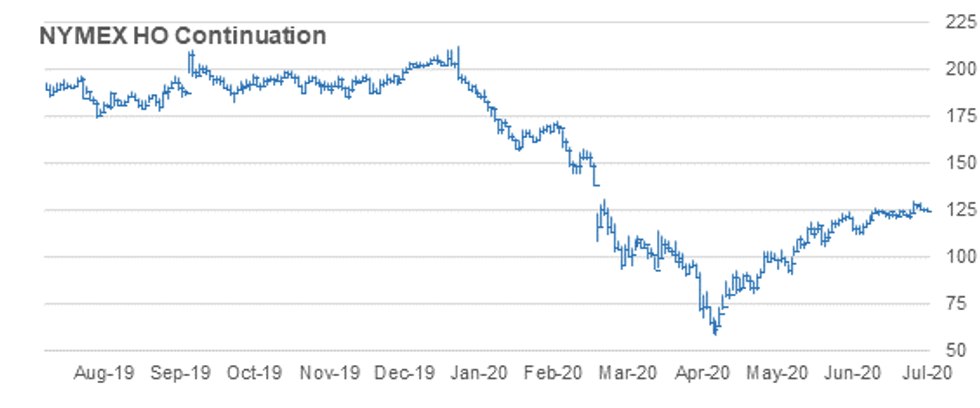
- RES 4: $1.4000 - Round number resistance
- RES 3: $1.3344 - High Mar 11 and gap low on the daily chart
- RES 2: $1.3000 - Round number resistance
- RES 1: $1.2910 - High Jul 21 and the bull trigger
- PRICE: $1.2463 @ 08:36 GMT Jul 27
- SUP 1: $1.2510 - Trendline support drawn off the Apr 28 low
- SUP 2: $1.1994 - Low Jul 10 and key near-term support
- SUP 3: $1.1855 - 50-day EMA
- SUP 4: $1.1296 - Low Jun 29
HO futures traded to fresh trend high last week clearing 1.2583, Jul 6 high. This confirms a resumption of the uptrend and opens the $1.3000 handle next and $1.3344, high Mar 11 and a gap low on the daily chart. Price action has remained above trendline support drawn off the Apr 28 low. The line intersects at $1.2510 today and is being tested. A break would signal a reversal. Watch support at $1.1994, Jul 10 low.
NYMEX RBOB (Q20): Key Resistance Remains Intact
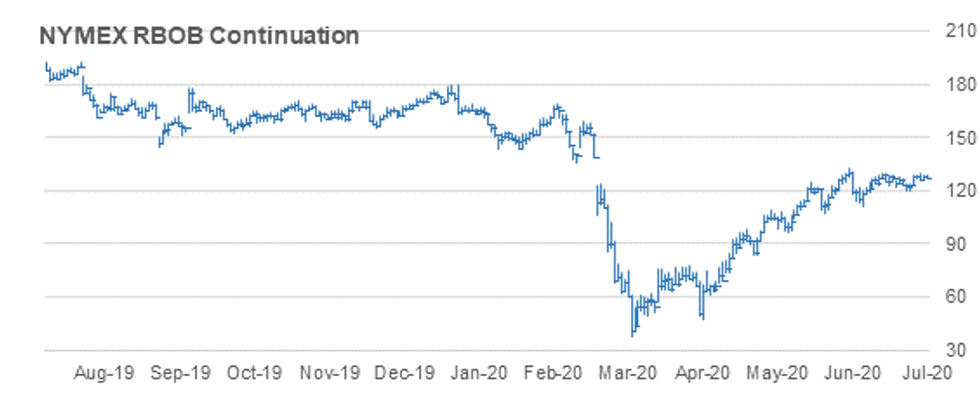
- RES 4: $1.3744 - 2.618 proj of Mar 23 - Apr 9 rally from Apr 22 low
- RES 3: $1.3403 - 2.50 proj of Mar 23 - Apr 9 rally from Apr 22 low
- RES 2: $1.3253 - High Jun 23 and key resistance
- RES 1: $1.2994/3048 - High Jul 23 / High Jun 24
- PRICE: $1.2763 @ 08:53 BST Jul 27
- SUP 1: $1.1939 - Low Jul 17
- SUP 2: $1.1866/00 - 50-day EMA / Low Jun 30
- SUP 3: $1.1128 - Low Jun 29
- SUP 4: $1.0916 - Low Jun 12 and the trend reversal trigger
RBOB futures continue to trade below the key resistance of $1.3253, Jun 23 high. The sharp pullback from $1.3253, between Jun 23 - 29 marked a failure to extend gains beyond $1.2571, Jun 8 high. This highlights a bearish risk with attention on $1.0916, Jun 12 low. A break would confirm a reversal. The initial bear trigger is $1.1128, Jun 29 low. Clearance of $1.3253 would instead resume the uptrend that started in April.
WTI TECHS: (U20) Holding Below The Recent High
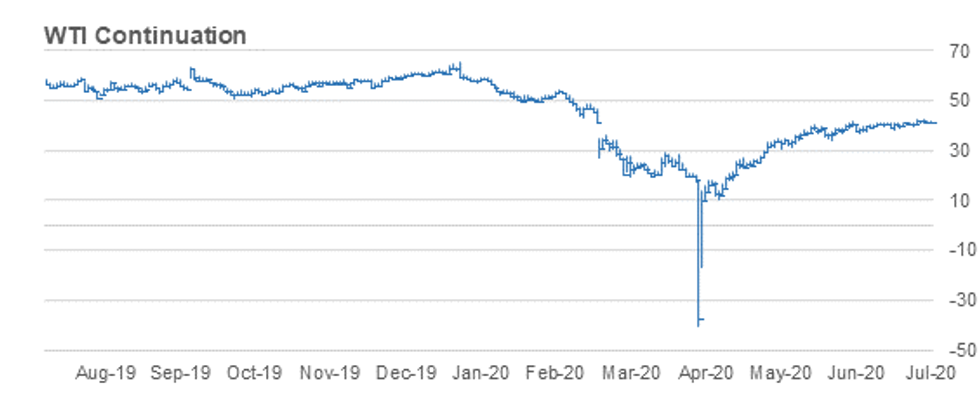
- RES 4: $48.97 - High Mar 3
- RES 3: $46.76 - High Mar 6
- RES 2: $44.38 - Low Mar 2
- RES 1: $42.51 - High Jul 21 and the bull trigger
- PRICE: $41.22 @ 06:52 BST Jul 27
- SUP 1: $39.97 - Low Jul 20
- SUP 2: $38.77 - Low Jul 1
- SUP 3: $38.63/37.32 - 50-day EMA / Low Jun 25 and reversal trigger
- SUP 4: $35.01- Low Jun 15 and key support
WTI futures remain bullish although for now resistance at $42.51, Jul 21 high is holding firm. Last week saw resistance at $41.74 cleared, Jun 23 high. The move confirmed a resumption of the uptrend that has been in place since Apr 22. Furthermore, moving average studies are also in a bull mode reinforcing current conditions. Attention is on $44.38 next, Mar 2 low. Support has been defined at $39.97, Jul 20.
GOLD TECHS: New All-Time Highs!!!
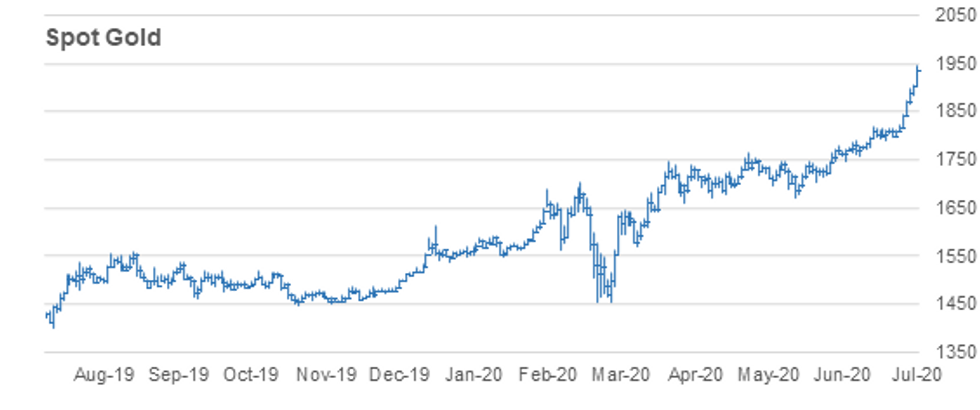
- RES 4: $2027.7 - 2.236 proj of Dec '19 - Mar rally from Mar 16 low
- RES 3: $2000.0 - Psychological round number
- RES 2: $1967.0 - 2.00 proj of Dec '19 - Mar rally from Mar 16 low
- RES 1: $1944.7 - Intraday and all-time high
- PRICE: $1933.2 @ 07:19 BST Jul 27
- SUP 1: $1899.9 - Intraday low
- SUP 2: $1863.8 - Low Jul 23
- SUP 3: $1841.2 - Low Jul 22
- SUP 4: $1817.8 - 20-day EMA
Gold continues to defy gravity. The yellow metal has traded higher overnight and most importantly, registered a new all time high at $1944.7. Last week's strong impulsive gains continue to dominate and despite being in overbought territory, gold looks set to extend the current rally. The next objective is $1967.0, a Fibonacci projection with sights also on the psychological $2000.0 level. $1899.9 is support.
SILVER TECHS: Impulsive Bull Trend Extend
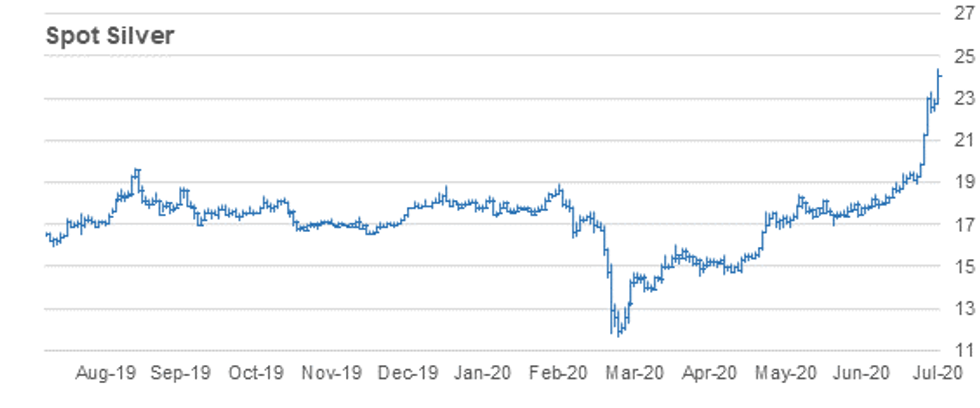
- RES 4: $25.105 - High Aug 2013
- RES 3: $25.000 - Round number resistance
- RES 2: $24.898 - 2.382 proj of Mar 18 - Apr 10 rally from Apr 21 low
- RES 1: $24.400 - Intraday high
- PRICE: $24.085 @ 08:21 BST Jul 27
- SUP 1: $22.710 - Intraday low
- SUP 2: $22.261 - Low Jul 21
- SUP 3: $21.283 - Low Jul 22
- SUP 4: $20.311 - 20-day EMA
Silver bulls remain firmly in charge. The metal has started the week on a firm note, maintaining the strong bullish conditions that dominated last week. Today's gains have achieved an objective set at $24.264, a Fibonacci projection paving the way for a climb towards $25.00 and $25.105, the Aug 2013 high. On the downside, firm near-term support has been defined at $22.261, Jul 23 low.
To read the full story
Sign up now for free trial access to this content.
Please enter your details below.
Why MNI
MNI is the leading provider
of intelligence and analysis on the Global Fixed Income, Foreign Exchange and Energy markets. We use an innovative combination of real-time analysis, deep fundamental research and journalism to provide unique and actionable insights for traders and investors. Our "All signal, no noise" approach drives an intelligence service that is succinct and timely, which is highly regarded by our time constrained client base.Our Head Office is in London with offices in Chicago, Washington and Beijing, as well as an on the ground presence in other major financial centres across the world.
