
Why MNI
MNI is the leading provider
of intelligence and analysis on the Global Fixed Income, Foreign Exchange and Energy markets. We use an innovative combination of real-time analysis, deep fundamental research and journalism to provide unique and actionable insights for traders and investors. Our "All signal, no noise" approach drives an intelligence service that is succinct and timely, which is highly regarded by our time constrained client base.Our Head Office is in London with offices in Chicago, Washington and Beijing, as well as an on the ground presence in other major financial centres across the world.
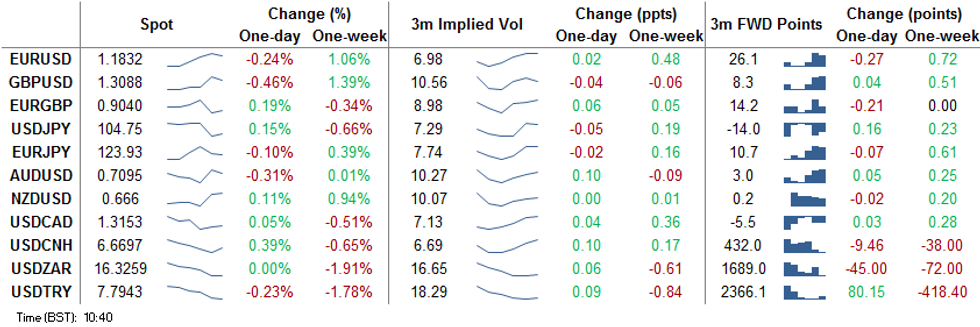
Markets Consolidating After Wednesday's Volatility
Markets are far more stable Thursday after yesterday's cross-market volatility. GBP is softer as markets take profit on one of the strongest sessions for the currency in months. GBP/USD has inched back below 1.31, but losses are muted at this stage. UK/EU negotiating teams meet in London later today.
Equities are softer in Europe as well as futures in the US, with the e-mini S&P hitting new weekly lows in Asia-Pacific hours. The final Presidential debate between Trump and Biden takes place after the close Thursday, with polling averages still leaning heavily in favour of a blue wave at November's election.
The USD is clawing back some of the recent losses, with NZD and CAD also stronger. GBP, SEK and AUD are the poorest performers so far today.
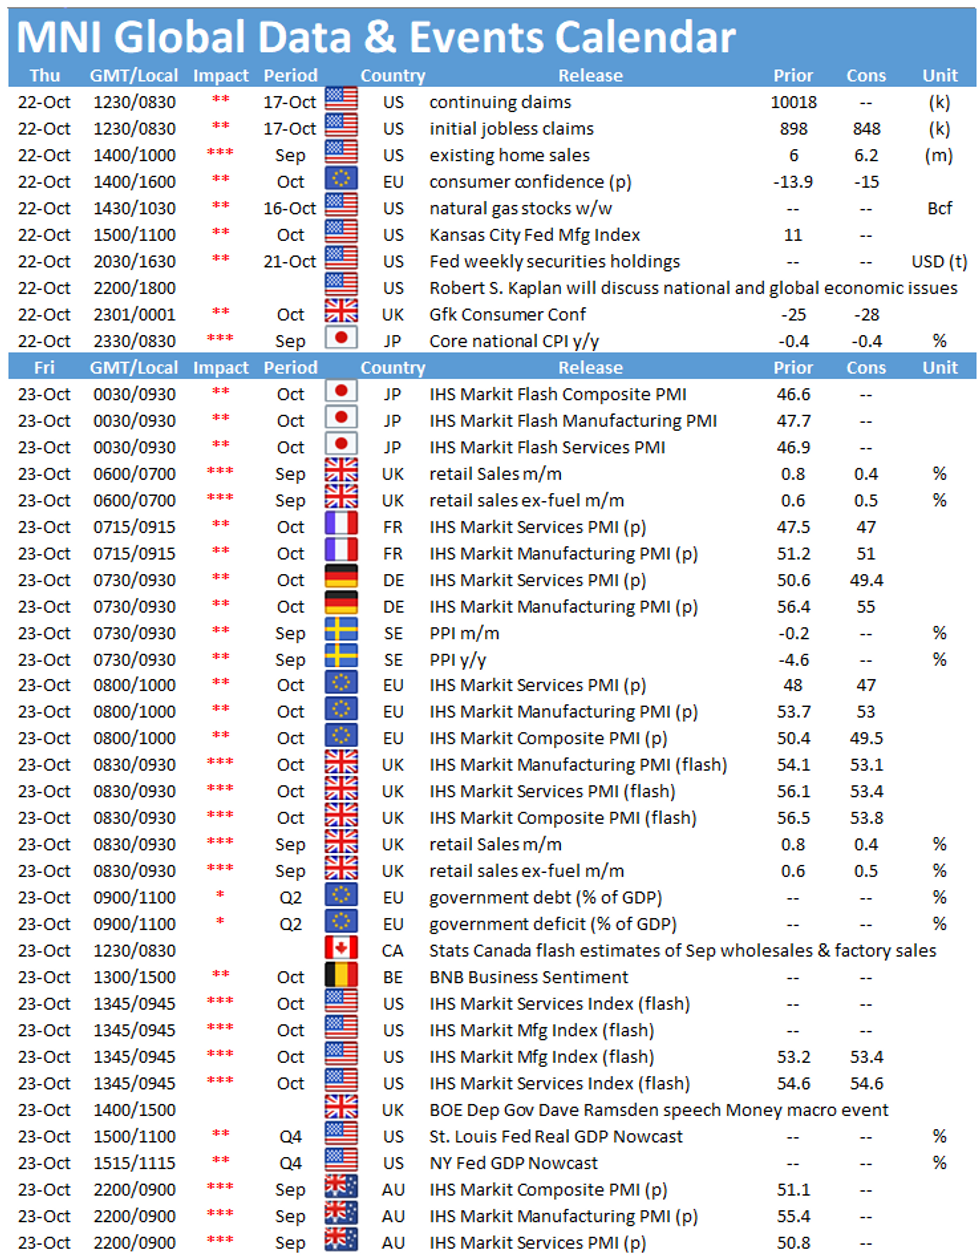
Weekly US jobless claims and existing home sales data are the calendar highlights, with advance Eurozone consumer confidence also due. Speeches from BoE's Bailey, Fed's Barkin, Daly and Kaplan may draw focus.
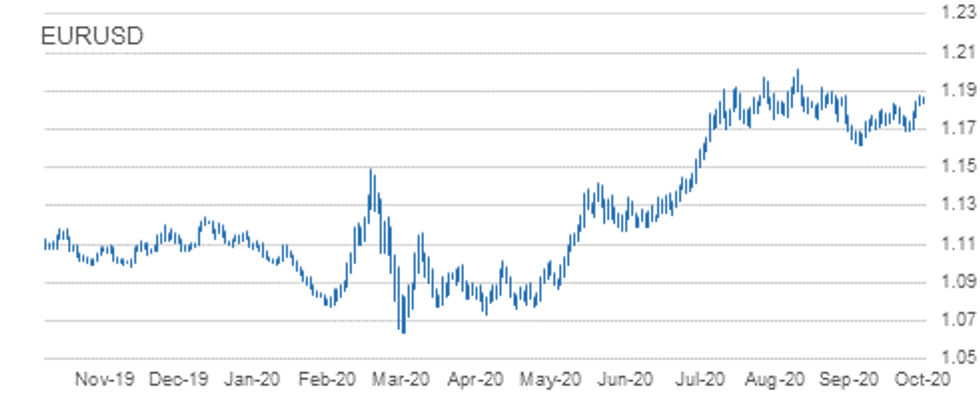
EUR/USD TECHS: Bullish Theme Intact
- RES 4: 1.2011 High Sep and key resistance
- RES 3: 1.1917 76.4% retracement of the Sep 1 - 25 sell-off
- RES 2: 1.1895 1.0% 10-dma envelope
- RES 1: 1.1881 High Oct 21
- PRICE: 1.1841 @ 10:17 BST Oct 22
- SUP 1: 1.1822 Low Oct 21
- SUP 2: 1.1760 Low Oct 20
- SUP 3: 1.1739 50-day EMA
- SUP 4: 1.1717 Trendline support drawn off the Sep 28 low
EURUSD maintains a bullish tone despite this morning's move lower. This week's positive theme has been reinforced by the break of the bull trigger at 1.1831, Oct 9 high. The breach signals scope for an extension towards 1.1917, a Fibonacci retracement level with the major resistance and hurdle for bulls at 1.2011, Sep 1 high. On the downside, initial firm support lies at 1.1760, Tuesday's low.
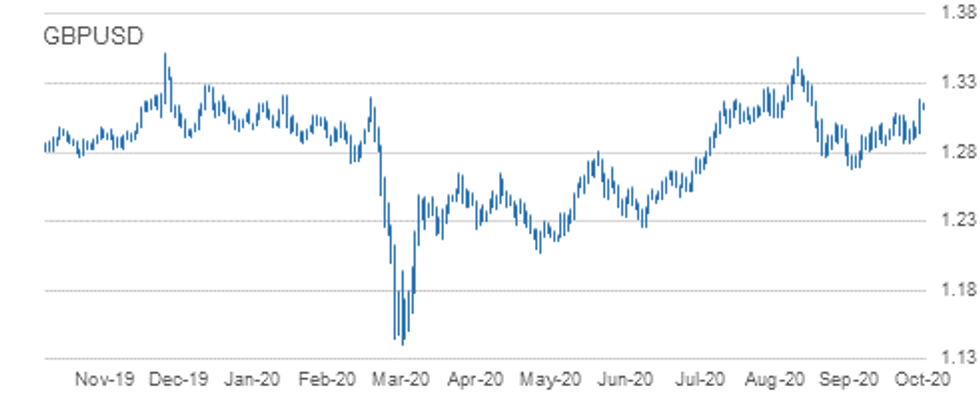
GBP/USD TECHS: Focus Is On Former Trendline Support-Now-Resistance
- RES 4: 1.3292 76.4% retracement of the Sep 1 - 23 sell-off
- RES 3: 1.3245 1.0% 10-dma envelope
- RES 2: 1.3222 Former trendline support drawn off the Mar 20 low
- RES 1: 1.3177 High Oct 21
- PRICE: 1.3102 @ 10:26 BST Oct 22
- SUP 1: 1.3025 High Oct 19
- SUP 2: 1.2863 Low Oct 14 and key near-term support
- SUP 3: 1.2846 Low Oct 7
- SUP 4: 1.2806 Low Sep 30
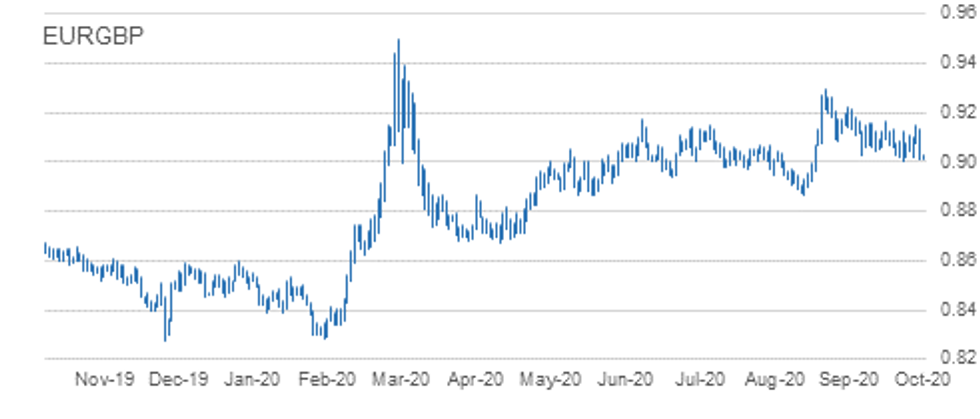
All Eyes On Key Support
- RES 4: 0.9162 High Oct 7
- RES 3: 0.9160 1.0% 10-dma envelope
- RES 2: 0.9149 Oct 20 high
- RES 1: 0.9083 20-day EMA
- PRICE: 0.9040 @ 10:29 BST Oct 22
- SUP 1: 0.9012 Low Oct 21
- SUP 2: 0.9007 Low Oct 14 and the bear trigger
- SUP 3: 0.8967 76.4% retracement of the Sep 3 - 11 rally
- SUP 4: 0.8925 Low Sep 7
EURGBP traded sharply lower yesterday and closed near session lows. The cross has moved below the 50-day EMA once again and attention turns to support at 0.9007, Oct 14 low and the near-term bear trigger. A break of 0.9007 would confirm a resumption of the downtrend that started Sep11 and open 0.8967, a retracement point. Key resistance has been defined at 0.9149, Tuesday's high. The outlook is bearish below this level.
USD/JPY TECHS: Bearish Following Sharp Sell-Off
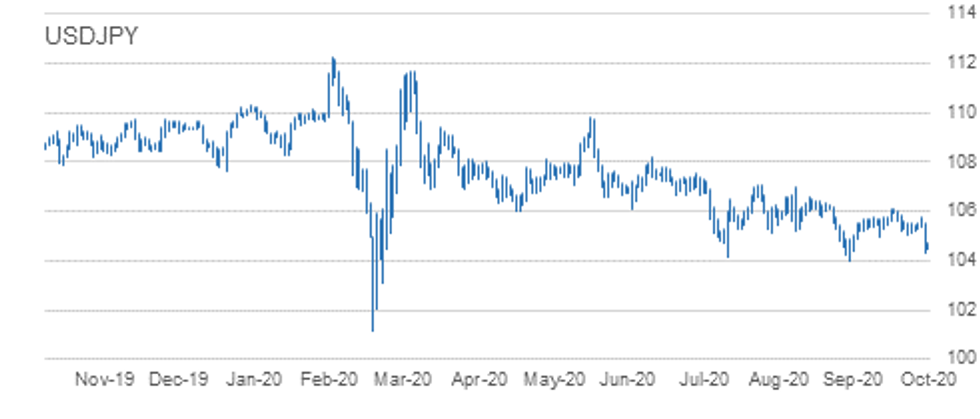
- RES 4: 106.11 High Oct 7 and key resistance
- RES 3: 105.75 High Oct 20
- RES 2: 105.53/69 High Oct 21 / 50-dma / High Oct 20
- RES 1: 105.04 Low Oct 4 and a recent breakout level
- PRICE: 104.75 @ 10:38 BST Oct 22
- SUP 1: 104.34 Low Oct 21
- SUP 2: 104.00 Low Sep 21 and the bear trigger
- SUP 3: 103.67 76.4% retracement of the Mar 9 - 24 rally
- SUP 4: 103.09 Low Mar 12
USDJPY remains weaker following yesterday's sharp sell-off and the confirmation of a resumption of the downleg from 106.11, Oct 7 high. A number of important supports were cleared yesterday signalling scope for a deeper pullback towards the key 104.00 handle, Sep 21 low. A break of 104.00 would signal scope for further USD depreciation within the bear channel drawn off the Mar 24 high. Initial resistance is at 105.04.
EUR/JPY TECHS: Corrective Pullback
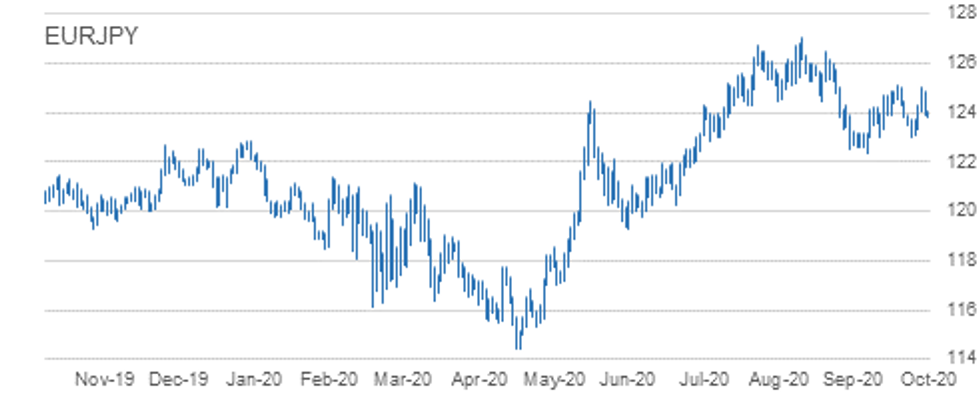
- RES 4: 126.46 High Sep 10
- RES 3: 125.97 76.4% retracement of the Sep 1 - 28 sell-off
- RES 2: 125.77 High Sep 15
- RES 1: 125.09/28 High Oct 9 / 61.8% of the Sep 1 - 28 sell-off
- PRICE: 123.93 @ 10:41 BST Oct 22
- SUP 1: 123.90 Intraday low
- SUP 2: 123.03/02 Low Sep 29 and Oct 2 / Low Oct 15
- SUP 3: 122.38/28 Low Sep 28 / 61.8% of the Jun 22 - Sep 1 rally
- SUP 4: 122.25 38.2% retracement of the May - Sep rally
EURJPY is trading lower. The outlook however remains positive following recent gains that saw the cross pull away from support at 123.03/02, low prints between Sep 29 and Oct 15. The extension through 124.00 opens 125.09, Oct 9 high and the bull trigger. A break of 125.09 would expose 125.28 and 125.97, both retracement levels. On the downside, a 123.03/02 breach would trigger bearish pressure and open 122.38.
AUD/USD TECHS: Remains Below Trendline Resistance
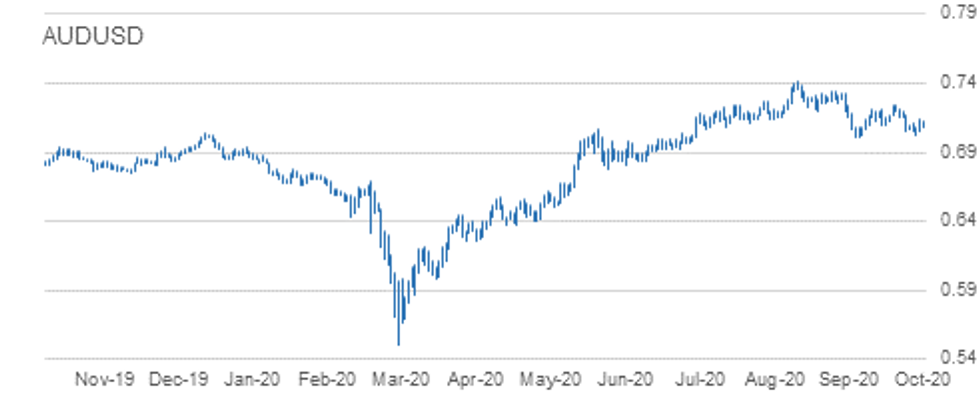
- RES 4: 0.7243 High Oct 10 and the intraday bull trigger
- RES 3: 0.7182 Trendline resistance drawn off the Sep 1 high
- RES 2: 0.7170 High Oct 15
- RES 1: 0.7137 High Oct 21
- PRICE: 0.7095 @ 10:45 BST Oct 22
- SUP 1: 0.7021 Low Oct 20
- SUP 2: 0.7006 Low Sep 25 and the bear trigger
- SUP 3: 0.6965 23.6% retracement of the Mar - Sep rally
- SUP 4: 0.6931 0.764 projection of Sep 1 - 25 sell-off from Oct 9 high
AUDUSD remains vulnerable despite yesterday's decent recovery. The pair continues to trade below trendline resistance drawn off the Sep 1 high. The line intersects at 0.7182 and the recent failure at the trendline continues to weigh on the pair. Attention is on the primary support and bear trigger at 0.7006, Sep 25 low. A trendline resistance break is needed to alter the picture and signal a stronger reversal.
USD/CAD TECHS: Bearish Conditions Intact
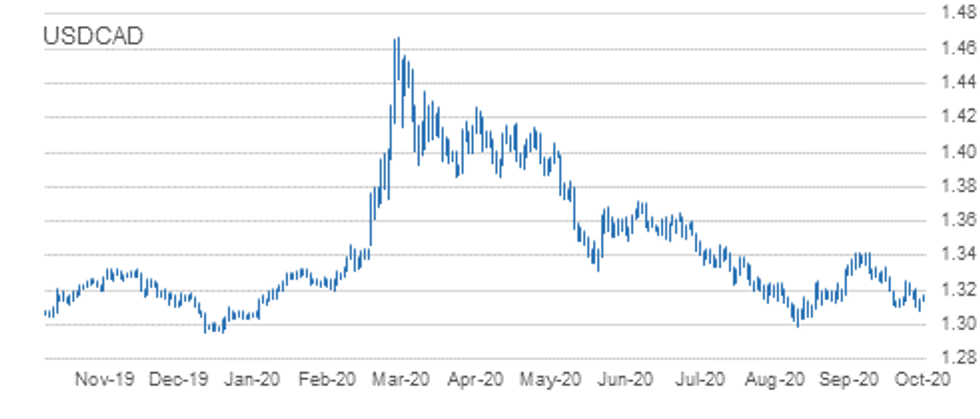
- RES 4: 1.3421 High Sep 30 and primary resistance
- RES 3: 1.3341 High Oct 7
- RES 2: 1.3251/59 50-day EMA / High Oct 15 and the bull trigger
- RES 1: 1. 3204 20-day EMA
- PRICE: 1.3151 @ 10:47 BST Oct 22
- SUP 1: 1.3081 Low Oct 21 and the intraday bear trigger
- SUP 2: 1.3047 Low Sep 7
- SUP 3: 1.3038 Low Sep 2
- SUP 4: 1.2994 Low Sep 1 and the major support
USDCAD bearish conditions remain intact despite the most recent bounce. The pair has weakened through key support at 1.3099, Oct 13 low. The move lower confirms a resumption of current downtrend that started off the 1.3421 high on Sep 30. Moving average studies are bearish too, reinforcing the current climate. Scope is for a move towards the major support at 1.2994, Sep 1 low. Key resistance has been defined at 1.3259, Oct 15 high.
EUR/USD: MNI KEY LEVELS
- *$1.2133 Broken Up Trendline from Jan03-2017
- *$1.2084 May01-2018 high
- *$1.2032 May02-2018 high
- *$1.2023 Upper 2.0% 10-dma envelope
- *$1.2009/11 May03-2018 high/YTD Sep01 high
- *$1.1996 May14-2018 high
- *$1.1935/38 Upper Boll Band (3%)/May15-2018 high
- *$1.1905 Upper 1.0% 10-dma envelope
- *$1.1875 Upper Bollinger Band (2%)
- *$1.1867 Intraday high
- *$1.1862 ***CURRENT MARKET PRICE 08:45BST THURSDAY***
- *$1.1857 100-mma
- *$1.1851/48 Jun14-2018 high/Cloud top
- *$1.1838 Intraday low
- *$1.1815 Sep24-2018 high
- *$1.1799/96 50-dma/55-dma
- *$1.1792 100-hma
- *$1.1774 200-hma
- *$1.1757/53 Sep27-2018 high/21-dma
- *$1.1736 Fibo 38.2% 1.3993-1.0341
- *$1.1669 Lower 1.0% 10-dma envelope
GBP/USD: MNI KEY LEVELS
- *$1.3311 Mar19-2019 high
- *$1.3276 Mar20-2019 high
- *$1.3266/69 Upper 2.0% 10-dma env/Mar27-2019 high
- *$1.3238 Upper Bollinger Band (3%)
- *$1.3213 Mar28-2019 high
- *$1.3196 Apr03-2019 high
- *$1.3191 Apr04-2019 high
- *$1.3185 May06-2019 high
- *$1.3153 Intraday high
- *$1.3141/44 Upper Boll Band (2%)/38.2% 1.4377-1.2382
- *$1.3140 ***CURRENT MARKET PRICE 08:45BST THURSDAY***
- *$1.3136/33 Upper 1.0% 10-dma env/Apr12-2019 high
- *$1.3131 May07-2019 high
- *$1.3117 Intraday low
- *$1.3109 Fibo 50% 1.1841-1.4377
- *$1.3082/80 Cloud top/May08-2019 high
- *$1.3041 May13-2019 high
- *$1.3020/16 55-dma/50-dma
- *$1.2999 Fibo 61.8% 1.3381-1.2382
- *$1.2993/91/89 100-hma/May10-2019 low/200-hma
- *$1.2973/70 Cloud base/May14-2019 high
EUR/GBP: MNI KEY LEVELS
- *Gbp0.9148 Upper Bollinger Band (2%)
- *Gbp0.9134 Sep11-2017 high
- *Gbp0.9108 Jan03-2019 high
- *Gbp0.9084/87 21-dma/Cloud top
- *Gbp0.9075/79 100-hma/Cloud base
- *Gbp0.9062/64/65 55-dma, Jan11-2019 high/200-hma/50-dma
- *Gbp0.9051 Jul17-2019 high
- *Gbp0.9045/48 100-dma/Jul16-2019 high
- *Gbp0.9039 Jul18-2019 high
- *Gbp0.9031 Intraday high
- *Gbp0.9027 ***CURRENT MARKET PRICE 08:45BST THURSDAY***
- *Gbp0.9014/13 Intraday low/Lower Boll Band (2%)
- *Gbp0.9010 Jul10-2019 high
- *Gbp0.9005/00 Jul23-2019 high/Jul22-2019 high
- *Gbp0.8979 Lower Bollinger Band (3%)
- *Gbp0.8973 Lower 1.0% 10-dma envelope
- *Gbp0.8953 Jul23-2019 low
- *Gbp0.8921 Jul02-2019 low
- *Gbp0.8888 200-dma
- *Gbp0.8882 Lower 2.0% 10-dma envelope
- *Gbp0.8874/73/72 Jun19-2019 low/Jun20-2019 low/Jun12-2019 low
USD/JPY: MNI KEY LEVELS
- *Y105.64 50-dma
- *Y105.44 21-dma
- *Y105.29 200-hma
- *Y105.23 100-hma
- *Y105.10 Cloud Tenkan Sen
- *Y105.06 Cloud Kijun Sen
- *Y104.87 Jan03-2019 low
- *Y104.75 Intraday high
- *Y104.71 Lower Bollinger Band (2%)
- *Y104.56 Mar26-2018 low
- *Y104.52 ***CURRENT MARKET PRICE 08:45BST THURSDAY***
- *Y104.48 Intraday low
- *Y104.34 Lower Bollinger Band (3%)
- *Y104.20 Lower 1.0% 10-dma envelope
- *Y103.94 200-mma
- *Y103.14 Lower 2.0% 10-dma envelope
- *Y103.09 YTD low
- *Y102.09 Lower 3.0% 10-dma envelope
- *Y101.20 Nov09-2016 low
- *Y100.75 Sep30-2016 low
- *Y100.61 Fibo 50% 75.35-125.86
EUR/JPY: MNI KEY LEVELS
- *Y124.79 50-mma
- *Y124.70 55-dma
- *Y124.64 50-dma
- *Y124.51 Fibo 61.8% 126.81-120.78
- *Y124.34 Apr01-2019 low
- *Y124.25 May07-2019 high
- *Y124.22 Fibo 38.2% 133.13-118.71
- *Y124.14 Fibo 38.2% 118.71-127.50
- *Y124.09 Intraday high
- *Y124.03/08 Cloud Tenkan Sen/100-hma
- *Y123.98 ***CURRENT MARKET PRICE 08:45BST THURSDAY***
- *Y123.97/93 200-hma/21-dma
- *Y123.80 50% 126.81-120.78, Intraday low
- *Y123.74 May21-2019 high, Cloud Kijun Sen
- *Y123.72 Fibo 61.8% 115.21-137.50
- *Y123.68 Cloud base
- *Y123.54 Fibo 50% 109.57-137.50
- *Y123.53 100-dma
- *Y123.51 May22-2019 high
- *Y123.18 Jun11-2019 high
- *Y123.11 Fibo 50% 118.71-127.50
AUD/USD: MNI KEY LEVELS
- *$0.7262/65 50-mma/Cloud top
- *$0.7241/44 Upper Boll Band (2%)/200-wma
- *$0.7207 Feb21-2019 high
- *$0.7202/06 Upper 1.0% 10-dma env/Apr17-2019 high
- *$0.7195/00 55-dma/50-dma
- *$0.7168 Cloud base
- *$0.7153 Apr17-2019 low
- *$0.7140 Apr16-2019 low
- *$0.7127 21-dma
- *$0.7118/19 200-hma/Intraday high
- *$0.7117 ***CURRENT MARKET PRICE 08:45BST THURSDAY***
- *$0.7116 Apr12-2019 low
- *$0.7110/05 Apr10-2019 low/100-dma
- *$0.7088/85 Apr08-2019 low/Intraday low
- *$0.7081 100-hma
- *$0.7073/69 Mar29-2019 low/Apr30-2019 high
- *$0.7059/57 Lower 1.0% 10-dma env/Jul22-2019 high
- *$0.7053 Apr02-2019 low
- *$0.7048/44 Jul04-2019 high, May07-2019 high/Jul16-2019 high
- *$0.7022 Lower Bollinger Band (2%)
- *$0.6988/85 Lower 2.0% 10-dma env/Jan03-2019 low
USD/CAD: MNI KEY LEVELS
- *C$1.3300 Jun13-2019 low
- *C$1.3286 Upper 1.0% 10-dma env, Jun20-2019 high
- *C$1.3238 21-dma
- *C$1.3224/26 50% 1.2783-1.3665/Jun10-2019 low
- *C$1.3211 55-dma
- *C$1.3202 50-dma
- *C$1.3175/78 50-mma/Intraday high
- *C$1.3164 Jul23-2019 high
- *C$1.3158/61/63 200-hma/200-wma, 100-hma, Cloud base/Feb21-2019 low
- *C$1.3150/51 Feb20-2019 low/Jun20-2019 low
- *C$1.3148 ***CURRENT MARKET PRICE 08:45BST THURSDAY***
- *C$1.3139 Intraday low
- *C$1.3120/16 61.8% 1.2783-1.3665/Jul23-2019 low
- *C$1.3113 Feb25-2019 low
- *C$1.3107 Jun26-2019 low
- *C$1.3066 Fibo 38.2% 1.4690-1.2062
- *C$1.3053 Fibo 38.2% 1.2062-1.3665
- *C$1.3046 Lower Bollinger Band (2%)
- *C$1.3023 Lower 1.0% 10-dma envelope
- *C$1.3015 Oct25-2018 low
- *C$1.2975 YTD low
Expiries for Oct22 NY cut 1000ET (Source DTCC)
EUR/USD: $1.1600-10(E1.7bln), $1.1644-50(E2.0bln), $1.1665-85(E1.3bln), $1.1710-20(E593mln), $1.1795-00(E1.5bln), $1.1845-50($712mln), $1.1875-80(E551mln), $1.1900(E661mln), $1.2000(E550mln)
USD/JPY: Y104.00-10($2.2bln), Y104.25-35($803mln), Y104.50-55($2.9bln), Y104.95-105.00($1.2bln), Y105.24-30($1.6bln), Y105.40-50($1.2bln), Y105.80-106.00($2.7bln)
GBP/USD: $1.3300(Gbp433mln-GBP calls)
AUD/USD: $0.6850(A$840mln), $0.6890-0.6900(A$686mln), $0.6950(A$853mln), $0.7000(A$509mln), $0.7075-80(A$504mln)
AUD/JPY: Y76.44(A$2.1bln), Y77.95(A$898mln)
EUR/AUD: A$1.6565(E816mln)
USD/CNY: Cny6.80($810mln), Cny6.95($922mln)
Larger Option Pipeline
- EUR/USD: Oct23 $1.1800(E1.1bln), $1.1840-50(E1.4bln), $1.2000(E1.4bln); Oct26 $1.1500(E1.8bln), $1.1650-60(E1.6bln); Oct28 $1.1800-05(E1.4bln), $1.2000-05(E2.9bln); Oct30 $1.1800(E1.1bln), $1.1850-60(E1.4bln), $1.1950(E1.7bln-EUR calls), $1.2000(E1.1bln)
- USD/JPY: Oct23 Y103.00($1.3bln), Y105.40-60($1.2bln); Oct26 Y103.95-104.00($2.2bln-USD puts), Y105.30-40($1.7bln), Y105.60-75($1.2bln), Y106.95-107.00($1.6bln); Oct27 Y105.00($1.3bln), Y106.00-05($1.2bln); Oct28 Y104.90-105.00($2.4bln); Oct29 Y103.20-25($1.6bln), Y104.00($1.3bln), Y105.55-65($2.2bln), Y106.00($1.2bln); Oct30 Y104.50($1.9bln), Y104.80-85($1.1bln), Y106.00-05($2.2bln)
- EUR/JPY: Oct26 Y122.80(E1.2bln)
- GBP/USD: Oct23 $1.3090-1.3100(Gbp1.1bln-GBP calls)
- EUR/GBP: Oct26 Gbp0.8900(E880mln), Gbp0.9000(E1.8bln-EUR puts)
- AUD/USD: Oct27 $0.6680(A$1.1bln); Nov02 $0.7140-45(A$1.5bln)
- AUD/JPY: Oct29 Y73.20(A$1.0bln-AUD puts), Y76.35-40(A$2.4bln-AUD calls)
- AUD/NZD: Oct27 N$1.0809-20(A$2.5bln); Oct30 N$1.0750(A$1.2bln)
Why MNI
MNI is the leading provider
of intelligence and analysis on the Global Fixed Income, Foreign Exchange and Energy markets. We use an innovative combination of real-time analysis, deep fundamental research and journalism to provide unique and actionable insights for traders and investors. Our "All signal, no noise" approach drives an intelligence service that is succinct and timely, which is highly regarded by our time constrained client base.Our Head Office is in London with offices in Chicago, Washington and Beijing, as well as an on the ground presence in other major financial centres across the world.