
Why MNI
MNI is the leading provider
of intelligence and analysis on the Global Fixed Income, Foreign Exchange and Energy markets. We use an innovative combination of real-time analysis, deep fundamental research and journalism to provide unique and actionable insights for traders and investors. Our "All signal, no noise" approach drives an intelligence service that is succinct and timely, which is highly regarded by our time constrained client base.Our Head Office is in London with offices in Chicago, Washington and Beijing, as well as an on the ground presence in other major financial centres across the world.
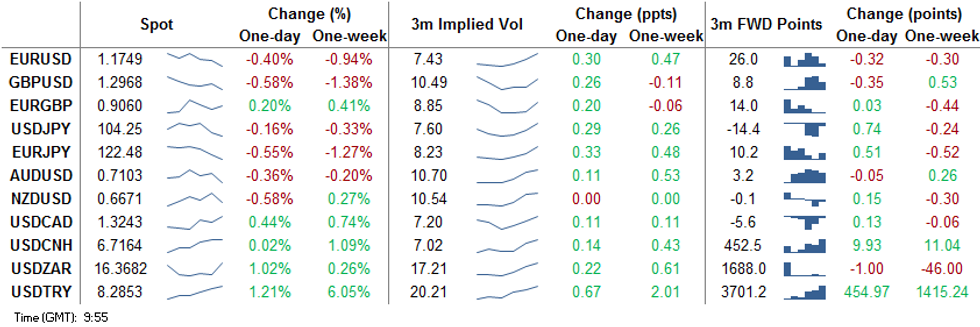
USD, JPY Gain as Equities Tumble on Lockdown Fears
Risk-off has been the theme of Wednesday so far, with looming risks of stricter lockdown measures across France and Germany weighing on sentiment across equities, currencies and, increasingly, commodities.
- Equities in continental Europe are lower by 1.6-3.2%, dragging US futures lower in tandem, which has helped support the greenback and JPY headed into the NY crossover.
- EUR/USD is under pressure, extending the recent sell-off from 1.1881, the Oct21 high and turning focus to the key near-term trendline support drawn from Sep28 low that today intersects at 1.1740. This level will likely stay in focus headed into tomorrow's ECB rate decision.
- A further decline in WTI and Brent crude oil prices is weighing on commodity-tied currencies, with NOK falling against all others in G10.
- Earnings season continues after Microsoft's poorly received report yesterday (their shares settled lower by 1.7%). Boeing, General Electric, UPS, Visa & Mastercard due ahead of today's open.
ECB Preview October 2020
Ahead of Events, Or At Their Mercy?
- The ECB must decide whether to wait until the December meeting to get over the hump of upcoming event risks and ascertain the impact of the recent tightening of social restrictions, or act now to ward off intensifying headwinds to the fragile recovery.
- On balance, the ECB is likely to hold fire for now and instead pave the way for further easing in December when there will be more clarity on economic conditions and risk outcomes. The considerable amount of capacity left in the expanded PEPP envelope further strengthens this baseline scenario.
- Nonetheless, the risk of further policy easing in October is non-negligible The coronavirus crisis is moving faster than policymakers are able to divine the associated economic impacts, elevated uncertainty risks becoming self-fulfilling and the inflation path is under grave threat.
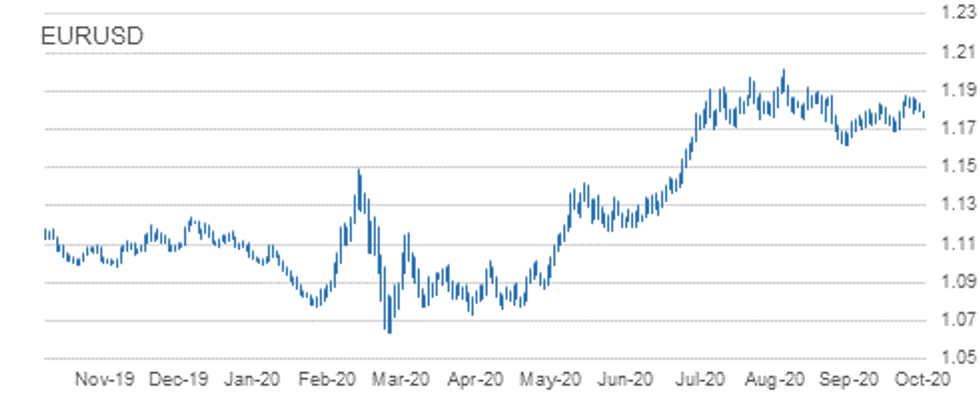
EUR/USD TECHS: Approaching Key Trendline Support
- RES 4: 1.1909 1.0% 10-dma envelope
- RES 3: 1.1881 High Oct 21 and the bull trigger
- RES 2: 1.1839 High Oct 27
- RES 1: 1.1798 Intraday high
- PRICE: 1.1747 @ 09:42 GMT Oct 28
- SUP 1: 1.1740 Trendline support drawn off the Sep 28 low
- SUP 2: 1.1689 Low Oct 15 and a key support
- SUP 3: 1.1612 Low Sep 25 and the bear trigger
- SUP 4: 1.1541 Low Jul 23
EURUSD is under pressure as the pair extends the recent sell-off from 1.1881, Oct 21 high. Attention is on the key near-term trendline support drawn off the Sep 28 low that today intersects at 1.1740. While the trendline holds, the uptrend since 1.1612, Sep 25 low remains intact. A break however would undermine the bullish tone and expose 1.1689, Oct 15 low. Initial resistance is at 1.1798, today's intraday high.
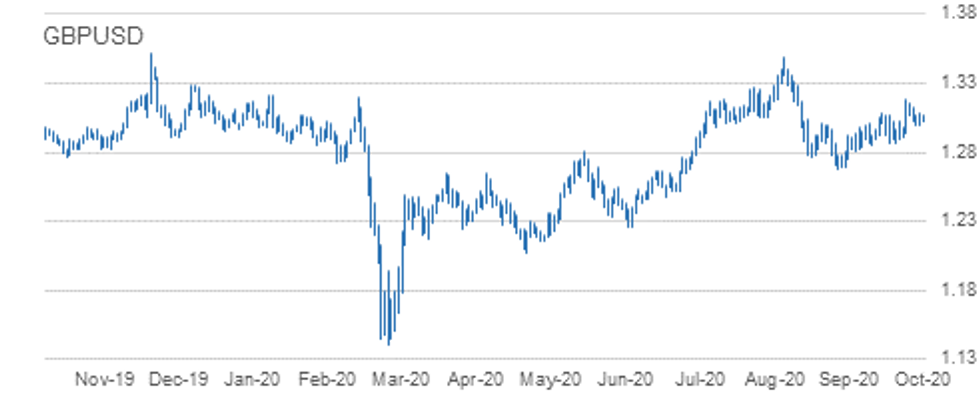
GBP/USD TECHS: Breaks Monday's Low
- RES 4: 1.3267 2.0% 10-dma envelope
- RES 3: 1.3257 Former trendline support drawn off the Mar 20 low
- RES 2: 1.3177 High Oct 21 and the bull trigger
- RES 1: 1.3080 High Oct 27
- PRICE: 1.2970 @ 09:52 GMT Oct 28
- SUP 1: 1.2940 Low Oct 21
- SUP 2: 1.2863 Low Oct 14 and key near-term support
- SUP 3: 1.2806 Low Sep 30
- SUP 4: 1.2794 76.4% retracement of the Sep 23 - Oct 21 rally
GBP/USD is lower this morning breaking through Monday's 1.2993 low. The break suggests scope for a deeper corrective pullback and brings into focus 1.2940, Oct 21 low. A breach of this support would strengthen a bearish case further and expose 1.2863, Oct 14 low and a key support. Price action has defined initial resistance at 1.3080, Oct 27 high. A move back above this resistance would ease bearish pressure and open 1.3177, Oct 21 high.
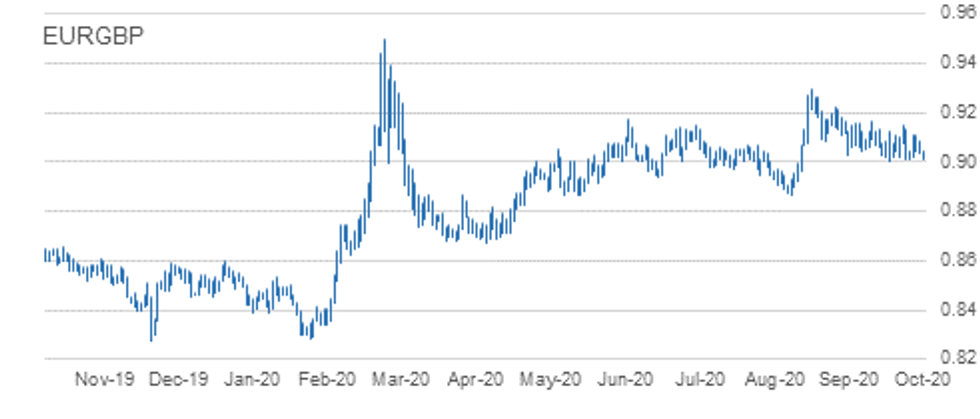
EUR/GBP TECHS: All Eyes On Key Support
- RES 4: 0.9220 High Sep 22
- RES 3: 0.9160/62 1.0% 10-dma envelope / High Oct 7
- RES 2: 0.9149 Oct 20 high
- RES 1: 0.9107 High Oct 23
- PRICE: 0.9059 @ 09:53 GMT Oct 28
- SUP 1: 0.9012 Low Oct 21
- SUP 2: 0.9007 Low Oct 14 and the bear trigger
- SUP 3: 0.8967 76.4% retracement of the Sep 3 - 11 rally
- SUP 4: 0.8925 Low Sep 7
EURGBP maintains a choppy tone. The outlook remains bearish though following the sharp sell-off on Oct 21. Attention is on support at 0.9007, Oct 14 low and the near-term bear trigger. A break of 0.9007 would confirm a resumption of the downtrend that started Sep 11 and expose 0.8967, a retracement point. Key S/T resistance has been defined at 0.9149, Oct 20 high. Clearance of this level would undermine bearish conditions.
USD/JPY TECHS: Approaching Key Support
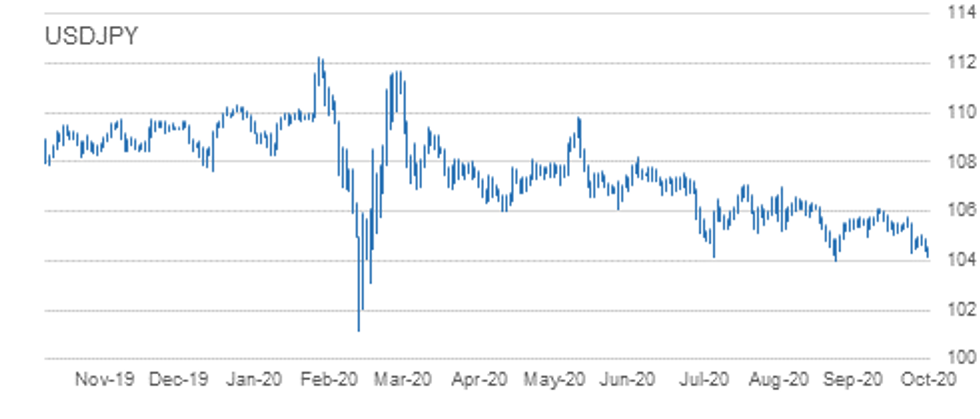
- RES 4: 105.75 High Oct 20
- RES 3: 105.53/60 High Oct 21 / 50-dma
- RES 2: 105.06 High Oct 26 and key near-term resistance
- RES 1: 104.56 Intraday high
- PRICE: 104.25 @ 09:55 GMT Oct 28
- SUP 1: 104.00 Low Sep 21 and the bear trigger
- SUP 2: 103.67 76.4% retracement of the Mar 9 - 24 rally
- SUP 3: 103.09 Low Mar 12
- SUP 4: 102.02 Low Mar 10
USDJPY maintains a softer tone, extending the recent decline. The outlook is bearish following the Oct 21 sell-off that marked a resumption of the downleg from 106.11, Oct 7 high. A number of important supports have been cleared and attention is on the key 104.00 handle, Sep 21 low. A break of 104.00 would suggest scope for a deeper USD depreciation within the bear channel drawn off the Mar 24 high. Firm resistance is at 105.06.
EUR/JPY TECHS: Eyeing Key Support
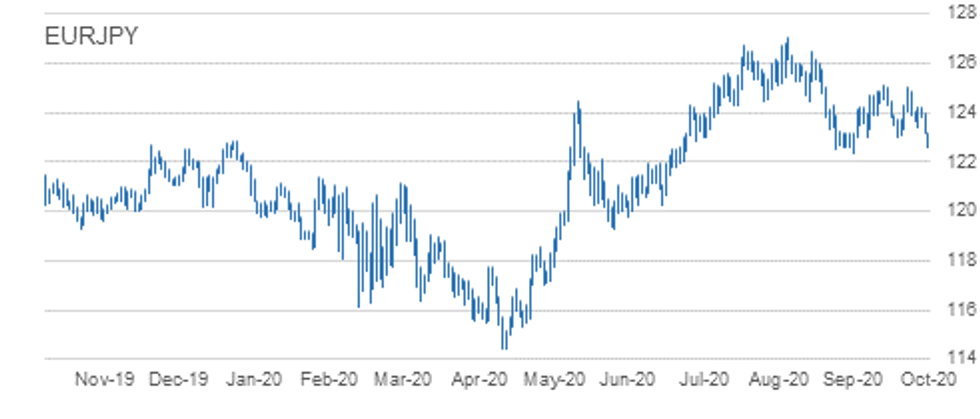
- RES 4: 125.00/09 High Oct 20 and Oct 9
- RES 3: 124.23 High Oct 23 and 26
- RES 2: 123.98 20-day EMA
- RES 1: 123.19 Intraday high
- PRICE: 122.37 @ 10:03 GMT Oct 28
- SUP 1: 122.38/28 Low Sep 28 / 61.8% of the Jun 22 - Sep 1 rally
- SUP 2: 122.25 38.2% retracement of the May - Sep rally
- SUP 3: 121.82 Low Jul 15 / 16
- SUP 4: 121.50 0.764 proj of Sep 1 - 28 decline from Oct 9 high
EURJPY has today cleared support at 123.03/02, low prints between Sep 29 and Oct 15. The break of this support undermines the recent bullish outlook and instead signals scope for a deeper sell-off towards 122.38, Sep 28 low and the bear trigger. The recent failure at 125.09 and 125.00, Oct 9 and 20 highs respectively, weigh on the pair. A break of 122.38 would open 121.82, the Jul 15 / 16 low. Initial resistance is at 123.19, today's intraday high
AUD/USD TECHS: Stalls At Trendline Resistance
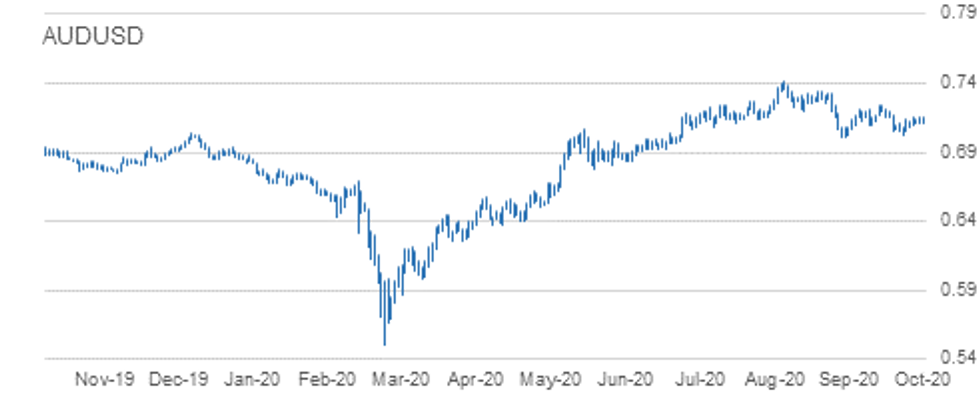
- RES 4: 0.7324 High Sep 21
- RES 3: 0.7258 61.8% retracement of the Sep 1 - 25 decline
- RES 2: 0.7243 High Oct 10 and a key resistance
- RES 1: 0.7157/58 Trendline drawn off the Sep 1 high / High Oct 23
- PRICE: 0.7105 @ 10:06 GMT Oct 28
- SUP 1: 0.7085 Low Oct 22
- SUP 2: 0.7021 Low Oct 20
- SUP 3: 0.7006 Low Sep 25 and the bear trigger
- SUP 4: 0.6965 23.6% retracement of the Mar - Sep rally
AUDUSD outlook is bearish. The Aussie continues to trade below trendline resistance drawn off the Sep 1 high. The line intersects at 0.7157 and represents a key resistance. It was tested earlier today and has remained intact, capping gains. While the trendline holds, a bearish theme remains intact with attention on key support and bear trigger at 0.7006, Sep 25 low. A trendline break would signal a reversal and open 0.7243, Oct 10 high.
USD/CAD TECHS: Approaching Resistance
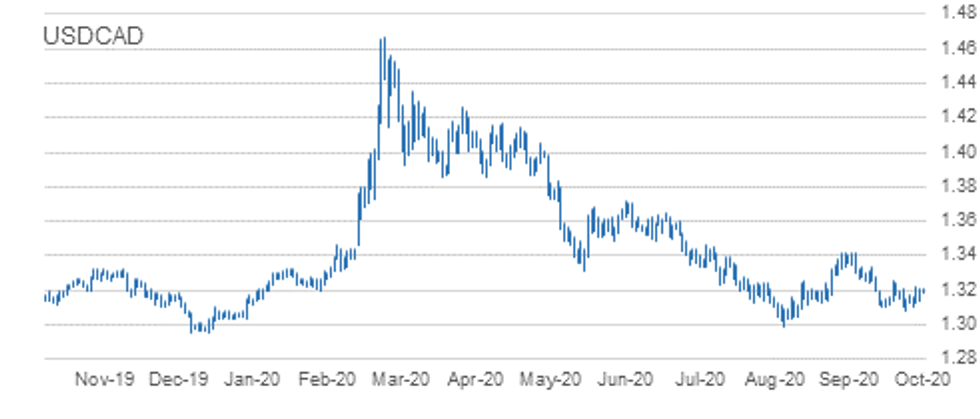
- RES 4: 1.3421 High Sep 30 and primary resistance
- RES 3: 1.3341 High Oct 7
- RES 2: 1.3291 61.8% retracement of the Sep 30 - Oct 21 sell-off
- RES 1: 1.3259 High Oct 15 and the bull trigger
- PRICE: 1.3238 @ 10:12 GMT Oct 28
- SUP 1: 1.3180 Intraday low
- SUP 2: 1.3109/3081 Low Oct 23 / Low Oct 21 and the bear trigger
- SUP 3: 1.3047 Low Sep 7
- SUP 4: 1.3038 Low Sep 2
USDCAD started the week on a firm note, rallying Monday and has extended gains this morning too. Despite the climb, the outlook remains bearish. The pair last week breached key support at 1.3099, Oct 13 low. The move lower confirmed a resumption of the current downtrend that started Sep 30. Scope exists for weakness towards the major support at 1.2994, Sep 1 low. Key resistance is at 1.3259, Oct 15 high. A break would alter the picture.
EUR/USD: MNI KEY LEVELS
- *$1.1911/16 Upper 1.0% 10-dma env/Upper Boll Band (3%)
- *$1.1870 Upper Bollinger Band (2%)
- *$1.1851/56 Jun14-2018 high/100-mma
- *$1.1828 Cloud top
- *$1.1821 100-hma
- *$1.1815 Sep24-2018 high
- *$1.1805 200-hma
- *$1.1799 55-dma
- *$1.1793/98 50-dma/Intraday high
- *$1.1776 21-dma
- *$1.1772 ***CURRENT MARKET PRICE 07:25GMT WEDNESDAY***
- *$1.1765 Intraday low
- *$1.1757 Sep27-2018 high
- *$1.1736 Fibo 38.2% 1.3993-1.0341
- *$1.1687 Lower Bollinger Band (2%)
- *$1.1676 Lower 1.0% 10-dma envelope
- *$1.1655/51 Cloud base/Sep28-2018 high
- *$1.1647 100-dma
- *$1.1641 Lower Bollinger Band (3%)
- *$1.1621 Oct16-2018 high
- *$1.1615/13 Down Trendline from Jul18-2008/161.8% swing $1.1497-1.1309
GBP/USD: MNI KEY LEVELS
- *$1.3206 Upper Bollinger Band (3%)
- *$1.3196 Apr03-2019 high
- *$1.3191 Apr04-2019 high
- *$1.3185 May06-2019 high
- *$1.3141/44 Upper 1.0% 10-dma env/38.2% 1.4377-1.2382
- *$1.3131/32/33 May07-2019 high/Upper Boll Band (2%)/Apr12-2019 high
- *$1.3109 Fibo 50% 1.1841-1.4377
- *$1.3080 May08-2019 high
- *$1.3064 Intraday high
- *$1.3050 100-hma
- *$1.3049 ***CURRENT MARKET PRICE 07:25GMT WEDNESDAY***
- *$1.3041 May13-2019 high
- *$1.3021/20/18 Intraday low/200-hma/55-dma
- *$1.3007 50-dma
- *$1.2999 Fibo 61.8% 1.3381-1.2382
- *$1.2991 May10-2019 low
- *$1.2985/82/81 Cloud top/21-dma/Cloud base
- *$1.2970 May14-2019 high
- *$1.2952/47 50-mma/200-wma
- *$1.2904 May14-2019 low
- *$1.2882/81 50% 1.3381-1.2382/Lower 1.0% 10-dma env
EUR/GBP: MNI KEY LEVELS
- *Gbp0.9168 Upper Bollinger Band (3%)
- *Gbp0.9156 Upper 1.0% 10-dma envelope
- *Gbp0.9131/34/36 Cloud top/Sep11-2017 high/Upper Boll Band (2%)
- *Gbp0.9108 Jan03-2019 high
- *Gbp0.9079 Cloud base
- *Gbp0.9071 21-dma
- *Gbp0.9062/65/67 Jan11-2019 high/55-dma/200-hma, 50-dma
- *Gbp0.9057 100-hma
- *Gbp0.9047/48/51 Intraday high/Jul16-2019 high/Jul17-2019 high, 100-dma
- *Gbp0.9039 Jul18-2019 high
- *Gbp0.9021 ***CURRENT MARKET PRICE 07:25GMT WEDNESDAY***
- *Gbp0.9015/10 Intraday low/Jul10-2019 high
- *Gbp0.9006/05 Lower Boll Band (2%)/Jul23-2019 high
- *Gbp0.9000 Jul22-2019 high
- *Gbp0.8974 Lower 1.0% 10-dma env, Lower Boll Band (3%)
- *Gbp0.8953 Jul23-2019 low
- *Gbp0.8921 Jul02-2019 low
- *Gbp0.8899 200-dma
- *Gbp0.8884 Lower 2.0% 10-dma envelope
- *Gbp0.8874/73/72 Jun19-2019 low/Jun20-2019 low/Jun12-2019 low
- *Gbp0.8865 Fibo 61.8% 0.9108-0.8473
USD/JPY: MNI KEY LEVELS
- *Y105.53 50-dma
- *Y105.31 Cloud base
- *Y105.27 21-dma
- *Y105.14 Cloud Kijun Sen
- *Y104.97 200-hma
- *Y104.96 Cloud Tenkan Sen
- *Y104.87 Jan03-2019 low
- *Y104.71 100-hma
- *Y104.56 Intraday high, Mar26-2018 low
- *Y104.25 Lower Bollinger Band (2%)
- *Y104.18 ***CURRENT MARKET PRICE 07:25GMT WEDNESDAY***
- *Y104.17 Intraday low
- *Y104.00 YTD low
- *Y103.93 200-mma
- *Y103.89 Lower 1.0% 10-dma envelope
- *Y103.74 Lower Bollinger Band (3%)
- *Y102.84 Lower 2.0% 10-dma envelope
- *Y101.79 Lower 3.0% 10-dma envelope
- *Y101.20 Nov09-2016 low
- *Y100.75 Sep30-2016 low
- *Y100.61 Fibo 50% 75.35-125.86
EUR/JPY: MNI KEY LEVELS
- *Y123.72 Fibo 61.8% 115.21-137.50
- *Y123.56 100-dma
- *Y123.54 Fibo 50% 109.57-137.50
- *Y123.51 May22-2019 high
- *Y123.19 Intraday high
- *Y123.18 Jun11-2019 high
- *Y123.11 Fibo 50% 118.71-127.50
- *Y123.08 Fibo 38.2% 126.81-120.78
- *Y123.01 Jun12-2019 high
- *Y122.80 Lower Bollinger Band (2%)
- *Y122.65 ***CURRENT MARKET PRICE 07:25GMT WEDNESDAY***
- *Y122.62 Intraday low
- *Y122.56 Jun13-2019 high
- *Y122.52 Lower 1.0% 10-dma envelope
- *Y122.23 Jul12-2019 high
- *Y122.21 Lower Bollinger Band (3%)
- *Y122.13 Jun17-2019 high
- *Y122.07 Fibo 61.8% 118.71-127.50
- *Y121.95 Fibo 50% 94.12-149.78
- *Y121.92 Jun20-2019 high
- *Y121.85 Jul15-2019 high, 100-wma
AUD/USD: MNI KEY LEVELS
- *$0.7274/79 Dec06-2018 high/Upper Boll Band (3%)
- *$0.7263 50-mma, Cloud top
- *$0.7244/48 200-wma/Upper 2.0% 10-dma env
- *$0.7232 Upper Bollinger Band (2%)
- *$0.7206/07 Apr17-2019 high/Feb21-2019 high
- *$0.7194 50-dma, 55-dma
- *$0.7177 Upper 1.0% 10-dma envelope
- *$0.7168 Cloud base
- *$0.7153/57 Apr17-2019 low/Intraday high
- *$0.7139/40 21-dma/Apr16-2019 low
- *$0.7139 ***CURRENT MARKET PRICE 07:25GMT WEDNESDAY***
- *$0.7126 100-hma
- *$0.7116/13 Apr12-2019 low/Intraday low
- *$0.7111/10 100-dma/Apr10-2019 low
- *$0.7103 200-hma
- *$0.7088 Apr08-2019 low
- *$0.7073/69 Mar29-2019 low/Apr30-2019 high
- *$0.7057/53 Jul22-2019 high/Apr02-2019 low
- *$0.7048/45 Jul04-2019 high, May07-2019 high/Lower Boll Band (2%)
- *$0.7044 Jul16-2019 high
- *$0.7035 Lower 1.0% 10-dma envelope
USD/CAD: MNI KEY LEVELS
- *C$1.3358 Fibo 50% 1.3565-1.3151
- *C$1.3345 Jun12-2019 high
- *C$1.3335 100-dma
- *C$1.3328 Fibo 38.2% 1.2783-1.3665
- *C$1.3320/22 Cloud top/Upper Boll Band (2%)
- *C$1.3306/09 Upper 1.0% 10-dma env/38.2% 1.3565-1.3151
- *C$1.3300 Jun13-2019 low
- *C$1.3286 Jun20-2019 high
- *C$1.3224/26 50% 1.2783-1.3665/Jun10-2019 low
- *C$1.3204 Intraday high
- *C$1.3204 ***CURRENT MARKET PRICE 07:25GMT WEDNESDAY***
- *C$1.3201/00/99 Cloud base/55-dma, 21-dma/50-dma
- *C$1.3180/76 Intraday low/50-mma
- *C$1.3165/64/63 100-hma/Jul23-2019 high, 200-hma/Feb21-2019 low
- *C$1.3160 200-wma
- *C$1.3151/50 Jun20-2019 low/Feb20-2019 low
- *C$1.3120/16 61.8% 1.2783-1.3665/Jul23-2019 low
- *C$1.3113 Feb25-2019 low
- *C$1.3107 Jun26-2019 low
- *C$1.3066 38.2% 1.4690-1.2062, Lower Boll Band (2%)
- *C$1.3053 Fibo 38.2% 1.2062-1.3665
Expiries for Oct28 NY cut 1000ET (Source DTCC)
EUR/USD: $1.1650-55(E521mln), $1.1675-78(E516mln), $1.1745-60(E1.3bln), $1.1780-85(E703mln), $1.1800-05(E1.8bln), $1.1830(E555mln), $1.1850-65(E832mln), $1.1870-75(E553mln), $1.1900(E958mln), $1.1950(E806mln)
USD/JPY: Y103.00($764mln), Y103.50($519mln), Y103.90-00($607mln), Y104.50($822mln), Y104.70-80($771mln), Y104.85-00($3.0bln), Y105.10-15($541mln), Y105.25-30($1.2bln), Y105.40($810mln)
GBP/USD: $1.3100(Gbp779mln)EUR/GBP: Gbp0.9085-00(E1.1bln)
EUR/JPY: Y122.85(E843mln)
AUD/NZD: N$1.0800(A$685mln)
USD/CAD: C$1.3550($500mln)
USD/CNY: Cny6.68($550mln-USD puts)
Larger Option Pipeline
- EUR/USD: Oct30 $1.1750-54(E1.2bln), $1.1800(E2.0bln), $1.1850(E1.6bln), $1.1950(E1.7bln-EUR calls), $1.2000(E1.3bln); Nov03 $1.1900-05(E1.4bln)
- USD/JPY: Oct29 Y103.20-25($1.6bln-USD puts), Y104.00($1.6bln-USD puts), Y105.25($1.3bln), Y105.55-65($2.4bln), Y106.00($1.2bln); Oct30 Y104.00($1.2bln), Y104.50($2.3bln), Y104.80-85($1.4bln), Y104.95-105.00($1.1bln), Y106.00-05($2.2bln); Nov03 Y105.45-49($1.3bln); Nov04 Y105.00($1.1bln); Nov05 Y106.06-09($1.6bln)
- EUR/JPY: Nov05 Y124.50(E1.1bln)
- GBP/USD: Nov02 $1.3100(Gbp1.1bln), $1.3150(Gbp911mln)
- EUR/GBP: Nov02 Gbp0.8900(E1.8bln-EUR puts), Gbp0.9000(E1.1bln)
- AUD/USD: Oct30 $0.7180-00(A$1.4bln); Nov02 $0.7140-45(A$1.8bln)
- AUD/JPY: Oct29 Y73.20(A$1.0bln-AUD puts), Y76.35-40(A$2.4bln-AUD calls); Oct30 Y77.45(A$1.2bln)
- AUD/NZD: Oct30 N$1.0750(A$1.2bln)
- USD/CAD: Oct30 C$1.3025($1.1bln), C$1.3150($1.3bln)
- USD/CNY: Nov03 Cny6.5334($1.2bln); Nov05 Cny6.75($1.0bln), Cny6.80($1.9bln), Cny6.85($1.3bln)
Why MNI
MNI is the leading provider
of intelligence and analysis on the Global Fixed Income, Foreign Exchange and Energy markets. We use an innovative combination of real-time analysis, deep fundamental research and journalism to provide unique and actionable insights for traders and investors. Our "All signal, no noise" approach drives an intelligence service that is succinct and timely, which is highly regarded by our time constrained client base.Our Head Office is in London with offices in Chicago, Washington and Beijing, as well as an on the ground presence in other major financial centres across the world.