
Why MNI
MNI is the leading provider
of intelligence and analysis on the Global Fixed Income, Foreign Exchange and Energy markets. We use an innovative combination of real-time analysis, deep fundamental research and journalism to provide unique and actionable insights for traders and investors. Our "All signal, no noise" approach drives an intelligence service that is succinct and timely, which is highly regarded by our time constrained client base.Our Head Office is in London with offices in Chicago, Washington and Beijing, as well as an on the ground presence in other major financial centres across the world.
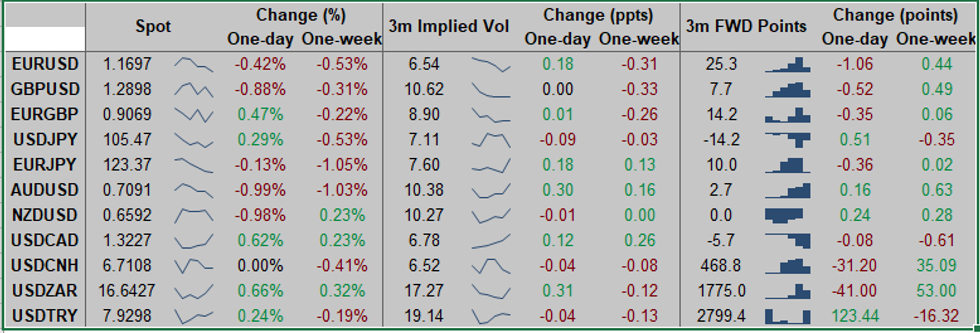
FOREX: Dollar Buoyed as Stimulus Hopes Dashed
The dollar was the best performing currency in G10 Thursday, with a sharp pullback in equities (particularly European bourses) adding further pressure to risk assets and adding weight to the likes of AUD, NZD and NOK.
- While Trump said on Fox Business he'd go over $1.8trn on stimulus, he added that Pelosi has 'mental problems', leading markets further to believe there is little hope of a near-term stimulus deal.
- This led the USD to gain sharply, prompting the USD index to touch levels not seen since Wednesday last week - a move that further pressured equities and led European indices to shed as much as 2.5%. Poorer than forecast weekly initial jobless claims added weight to the move.
- Focus Friday turns to US retail sales and the prelim October Uni. of Michigan confidence data. Fed's Bullard and Williams are both due to speak.
TECHNICALS
EURUSD: Remains Under Pressure
- RES 4: 1.1917 High Sep 10 and 76.4% of the Sep 1 - 25 sell-off
- RES 3: 1.1859 61.8% retracement of the Sep 1 - 25 sell-off
- RES 2: 1.1817/31 High Oct 13 / High Oct 9 and the bull trigger
- RES 1: 1.1771 High Oct 14
- PRICE: 1.1698 @ 17:59 BST Oct 15
- SUP 1: 1.1685 Low Sep 30
- SUP 2: 1.1612/1581 Low Sep 25 and the bear trigger / Low Jul 24
- SUP 3: 1.1591 100-dma
- SUP 4: 1.1541 Low Jul 23
EURUSD is trading lower today in line with general USD strength. The move lower follows the recent rejection off the 1.1831 high on Oct 9. Attention turns to the next important support handle at 1.1685, Sep 30 low. A break of this level would set the scene for a deeper decline and expose the key 1.1612 level, Sep 25 low. 1.1612 also represents the trigger for a resumption of the downtrend that started on Sep 1. Resistance is at 1.1771.

GBPUSD: Choppy And Still Below Monday's High
- RES 4: 1.2280 High Sep 7
- RES 3: 1.3175 Former trendline support drawn off the Mar 20 low
- RES 2: 1.3174 61.8% retracement of the Sep 1 - 23 sell-off
- RES 1: 1.3083 High Oct 12
- PRICE: 1.2927 @ 18:04 BST Oct 15
- SUP 1: 1.2863 Low Oct 14
- SUP 2: 1.2846 Low Oct 7 and key near-term support
- SUP 3: 1.2806 Low Sep 30
- SUP 4: 1.2745 Low Sep 28
GBPUSD maintains a choppy tone. The pair recovered Wednesday bouncing sharply off the day low of 1.2863 but traded lower Thursday. Price remains below Monday's high of 1.3083. A break of this level is needed to resume the recent uptrend that would open 1.3000 and 1.3175. The latter is the former trendline support drawn off the Mar 20 low. The trendline was breached on Sep 9. A break of 1.3175 is required to strengthen a bullish theme. Initial support is at 1.2863.

EURGBP: Bears Still In The Driving Seat
- RES 4: 0.9190 61.8% retracement of the Sep 11 - 28 sell-off
- RES 3: 0.9162 High Oct 7 and the bull trigger
- RES 2: 0.9132 High Oct 10
- RES 1: 0.9122 Oct 14 high
- PRICE: 0.9057 @ 18:08 BST Oct 15
- SUP 1: 0.9007 Low Oct 14
- SUP 2: 0.9000 Round number support
- SUP 3: 0.8967 76.4% retracement of the Sep 3 - 11 rally
- SUP 4: 0.8808 Low May 13
EURGBP remains soft following Wednesday's strong rejection off the day high. The break lower followed another failed attempt to convincingly clear trendline resistance drawn off the Sep high. The move lower Wednesday also confirmed a resumption of the downtrend that has been in place since Sep 11 and sets the scene for a move to 0.9000 and below towards 0.8967, a retracement level. Resistance is at 0.9122, the Oct 14 high.

USDJPY: Holding Above Key Short-Term Support
- RES 4: 106.95 High Sep 28
- RES 3: 106.55 High Sep 3 / Channel resistance drawn off Mar 24 high
- RES 2: 106.11/38 High Oct 7 and the bull trigger / High Sep 8
- RES 1: 105.63 High Oct 13
- PRICE: 105.38 @ 18:11 BST Oct 15
- SUP 1: 105.04 Low Oct 14
- SUP 2: 104.94 Low Oct 2 and key near-term support
- SUP 3: 104.41 Low Sep 22
- SUP 4: 104.00 Low Sep 21 and the bear trigger
USDJPY traded lower Wednesday extending this week's slide but did manage to find some support Thursday. Intraday momentum studies still point south however, to strengthen a bearish theme price needs to trade below 104.94, Oct 2 low. This would open 104.00, Sep 21 low. While 104.94 remains intact, the recent sell-off is considered a correction. The bull trigger is at 106.11, Oct 7 high. Initial resistance is at 105.63.
EURJPY: Probes 123.03 Support

- RES 4: 125.77 High Sep 15
- RES 3: 125.09/28 High Oct 9 / 61.8% of the Sep 1 - 28 sell-off
- RES 2: 124.48 High Oct 13
- RES 1: 123.94 High Oct 14
- PRICE: 123.34 @ 18:22 BST Oct 15
- SUP 1: 123.03/02 Low Sep 29 and Oct 2 / Low Oct 15
- SUP 2: 122.38/28 Low Sep 28 / 61.8% of the Jun 22 - Sep 1 rally
- SUP 3: 122.25 38.2% retracement of the May - Sep rally
- SUP 4: 121.82 Low Jul 15 and 16
EURJPY maintained a softer tone Thursday trading lower once again. While recent weakness is considered a correction, attention turns to support at 123.03, Oct 6 low. This level was probed briefly Thursday. A clear breach of 123.03 would highlight scope for a deeper pullback and open the key support at 122.38, Sep 28 low and the bear trigger. On the upside, key resistance is at 125.09, Oct 9 high. Initial resistance is at 123.94.

AUDUSD: Failure To Clear Trendline Resistance Weighs
- RES 4: 0.7258 61.8% retracement September Sell-Off
- RES 3: 0.7243 High Oct 10 and the intraday bull trigger
- RES 2: 0.7207 Trendline resistance drawn off the Sep 1 high
- RES 1: 0.7170 High Oct 15
- PRICE: 0.7090 @ 18:27 BST Oct 15
- SUP 1: 0.7056 Intraday low
- SUP 2: 0.7029 Low Sep 28
- SUP 3: 0.7006 Low Sep 25 and the bear trigger
- SUP 4: 0.6965 23.6% retracement of the Mar - Sep rally
AUDUSD traded sharply lower Thursday. On Oct 9, the pair cleared resistance at 0.7209, Oct 1 and 6 high resulting in a test of trendline resistance drawn off the Sep 1 high. The line intersects at 0.7207 today. A failure to clear the trendline is weighing and, with support at 0.7096, Oct 7 low cleared, the scene is set for a deeper pullback. Attention turns to the primary support and bear trigger at 0.7006, Sep 25 low. 0.7170 is resistance.

USDCAD: Corrective Bounce Extends
- RES 4: 1.3421 High Sep 30
- RES 3: 1.3341 High Oct 7 and a reversal trigger
- RES 2: 1.3268 High Oct 7 and 50-day EMA
- RES 1: 1.3259 High Oct 15Intraday high
- PRICE: 1.3222 @ 18:36 BST Oct 15
- SUP 1: 1.3143 Low Oct 15
- SUP 2: 1.3099 Low Oct 13
- SUP 3: 1.3095 76.4% retracement of the Sep 1 - 30 rally
- SUP 4: 1.3038 Low Sep 2
USDCAD traded sharply higher Thursday as the USD rallied across the board. The recovery highlights scope for a corrective bounce. The pair has cleared 1.3222, the 20-day EMA paving the way for a stronger recovery with attention turning to the 50-day EMA that intersects at 1.3268. On the downside, initial support lies at 1.3143, Thursday's intraday low. A move below this level would undermine the recent bounce.

MNI Key Levels
EUR/USD: MNI KEY LEVELS
- $1.1904 Upper Bollinger Band (3%)
- $1.1872/76 Cloud top/Upper 1.0% 10-dma env
- $1.1856 100-mma
- $1.1848/51 Upper Boll Band (2%)/Jun14-2018 high
- $1.1815 Sep24-2018 high
- $1.1795/97 50-dma/55-dma
- $1.1768/70 100-hma/200-hma
- $1.1757/58 Sep27-2018 high/Intraday high
- $1.1742 21-dma
- $1.1736 Fibo 38.2% 1.3993-1.0341
- $1.1697 ***CURRENT MARKET PRICE 14:46ET THURSDAY***
- $1.1689 Intraday low
- $1.1651 Sep28-2018 high
- $1.1641 Lower 1.0% 10-dma envelope
- $1.1627/26 Down Trendline from Jul18-2008/Lower Boll Band (2%)
- $1.1621 Oct16-2018 high
- $1.1613 161.8% swing $1.1497-1.1309
- $1.1598/97 Cloud base/100-dma
- $1.1571/70 Lower Boll Band (3%)/Jan10-2019 high
- $1.1540 Jan11-2019 high
- $1.1523 Lower 2.0% 10-dma envelope
GBP/USD: MNI KEY LEVELS
- $1.3088/90 Upper Boll Band (2%)/Upper 1.0% 10-dma env
- $1.3080 May08-2019 high
- $1.3026/30 55-dma/Intraday high
- $1.3019 50-dma
- $1.3013 Oct21-2019 high
- $1.3000 100-hma, Oct22-2019 high
- $1.2985 Nov18-2019 high
- $1.2970 200-hma, Nov19-2019 high, Nov21-2019 high
- $1.2949/51 50-mma/Nov28-2019 high
- $1.2940/44 200-wma/Nov29-2019 high
- $1.2899 ***CURRENT MARKET PRICE 14:46ET THURSDAY***
- $1.2894/91 21-dma/Intraday low
- $1.2879 Nov29-2019 low
- $1.2870 Cloud base
- $1.2831/30/27 100-dma/Lower 1.0% 10-dma env/Nov27-2019 low
- $1.2824 Nov22-2019 low
- $1.2816 Nov12-2019 low
- $1.2810 Fibo 61.8% 1.1841-1.4377
- $1.2769 Nov08-2019 low
- $1.2750 Oct17-2019 low, 100-wma
- $1.2711 200-dma
EUR/GBP: MNI KEY LEVELS
- Gbp0.9412/15 Oct13-2009 high/Oct07-2016 high
- Gbp0.9345/46 Upper3.0% 10-dma env/Oct15-2009 high
- Gbp0.9307 Aug29-2017 high
- Gbp0.9250/54 Upper Boll Band (3%)/Upper 2.0% 10-dma env
- Gbp0.9226 Sep04-2017 high
- Gbp0.9202/03 Upper Boll Band (2%)/Sep08-2017 high
- Gbp0.9163 Upper 1.0% 10-dma envelope
- Gbp0.9134 Sep11-2017 high
- Gbp0.9107/08 21-dma/Jan03-2019 high
- Gbp0.9073/75 Intraday high/200-hma
- Gbp0.9068 ***CURRENT MARKET PRICE 14:46ET THURSDAY***
- Gbp0.9062/60 Jan11-2019 high/50-dma
- Gbp0.9057/53 55-dma/100-hma
- Gbp0.9051/48 Jul17-2019 high/Jul16-2019 high
- Gbp0.9039/38 Jul18-2019 high/100-dma
- Gbp0.9016 Intraday low
- Gbp0.9010/07 Jul10-2019 high, Lower Boll Band (2%)/Cloud top
- Gbp0.9005/00 Jul23-2019 high/Jul22-2019 high
- Gbp0.8999 Cloud base
- Gbp0.8982 Lower 1.0% 10-dma envelope
- Gbp0.8962 Lower Bollinger Band (3%)
- Y106.54 Upper Bollinger Band (3%)
- Y106.41 100-dma
- Y106.18 Cloud top
- Y106.17 Upper Bollinger Band (2%)
- Y106.08 Cloud base
- Y105.78 50-dma
- Y105.77 55-dma
- Y105.62 200-hma
- Y105.58 Cloud Tenkan Sen
- Y105.49 Intraday high
- Y105.45 ***CURRENT MARKET PRICE 14:46ET THURSDAY***
- Y105.40/39 100-hma/21-dma
- Y105.15 Cloud Kijun Sen
- Y105.09 Intraday low
- Y104.87 Jan03-2019 low
- Y104.68 Lower Bollinger Band (2%)
- Y104.56 Mar26-2018 low
- Y104.52 Lower 1.0% 10-dma envelope
- Y104.30 Lower Bollinger Band (3%)
- Y103.94 200-mma
- Y103.46 Lower 2.0% 10-dma envelope
- Y124.14 Fibo 38.2% 118.71-127.50
- Y124.06 Cloud Tenkan Sen
- Y124.04 100-hma
- Y123.77 Intraday high
- Y123.76 21-dma
- Y123.74 May21-2019 high
- Y123.72 Fibo 61.8% 115.21-137.50
- Y123.67 Cloud base
- Y123.51 May22-2019 high
- Y123.39 100-dma
- Y123.34 ***CURRENT MARKET PRICE 14:46ET THURSDAY***
- Y123.18 Jun11-2019 high
- Y123.11 Fibo 50% 118.71-127.50
- Y123.02 Intraday low
- Y123.01 Jun12-2019 high
- Y122.90 Lower 1.0% 10-dma envelope
- Y122.56 Jun13-2019 high
- Y122.42 Lower Bollinger Band (2%)
- Y122.23 Jul12-2019 high
- Y122.13 Jun17-2019 high
- Y122.07 Fibo 61.8% 118.71-127.50
- $0.7233 Upper 1.0% 10-dma envelope
- $0.7203/06/07 55-dma/50-dma, Apr17-2019 high/Feb21-2019 high
- $0.7172 100-hma
- $0.7166/70 200-hma/Intraday high
- $0.7153/57 Apr17-2019 low/21-dma
- $0.7140 Apr16-2019 low
- $0.7124 Cloud base
- $0.7116 Apr12-2019 low
- $0.7110 Apr10-2019 low
- $0.7089/93 Lower 1.0% 10-dma env/100-dma
- $0.7089 ***CURRENT MARKET PRICE 14:46ET THURSDAY***
- $0.7088 Apr08-2019 low
- $0.7073/69 Mar29-2019 low/Apr30-2019 high
- $0.7057/56/53 Jul22-2019 high/Intraday low/Apr02-2019 low
- $0.7048/44 Jul04-2019 high, May07-2019 high/Jul16-2019 high
- $0.7018/17 Lower 2.0% 10-dma env/Lower Boll Band (2%)
- $0.6951 Lower Bollinger Band (3%)
- $0.6946 Lower 3.0% 10-dma envelope
- $0.6930 Oct31-2019 high
- $0.6909/06 Jun19-2019 high/Nov08-2019 high
- $0.6899 100-wma
- C$1.3383 Jun19-2019 high
- C$1.3376/78 50% 1.4690-1.2062/100-wma
- C$1.3365 100-dma
- C$1.3347 Cloud top
- C$1.3340/45 Upper 1.0% 10-dma env/Jun12-2019 high
- C$1.3328 Nov20-2019 high
- C$1.3314 Nov29-2019 high
- C$1.3260/65 Nov27-2019 low/21-dma
- C$1.3255/59 Nov22-2019 low/Intraday high
- C$1.3227 55-dma
- C$1.3226 ***CURRENT MARKET PRICE 14:46ET THURSDAY***
- C$1.3216 50-dma
- C$1.3194/91 200-hma/Nov19-2019 low
- C$1.3177 50-mma
- C$1.3163/62 200-wma/Cloud base
- C$1.3143 100-hma, Intraday low
- C$1.3087 Lower Bollinger Band (2%)
- C$1.3076 Lower 1.0% 10-dma envelope
- C$1.3066 Fibo 38.2% 1.4690-1.2062
- C$1.3053 Fibo 38.2% 1.2062-1.3665
OPTIONS: Expiries
Expiries for Oct16 NY cut 1000ET (Source DTCC)
- EUR/USD: $1.1650(E888mln), $1.1700(E621mln), $1.1745-50(E592mln), $1.1800(E2.51bln-E2.32bln of EUR calls), $1.1845-50(E1.1bln)
- USD/JPY: Y104.50($1.6bln), Y105.00-04($3.0bln-$2.87bln of USD puts), Y105.35-40($1.1bln), Y105.50-60($588mln)
- EUR/NOK: Nok10.30(E840mln), Nok10.55(E800mln), Nok10.65(E571mln)
- AUD/USD: $0.7175(A$794mln)
- USD/CAD: C$1.3000($745mln), C$1.3220($560mln)
Larger Option Pipeline
- EUR/USD: Oct19 $1.1800(E1.0bln); Oct20 $1.1745(E1.1bln); Oct22 $1.1600(E1.2bln), $1.1645-50(E1.5bln); Oct23 $1.2000(E1.3bln); Oct26 $1.1500(E1.8bln), $1.1650-60(E1.4bln); Oct28 $1.1800-05(E1.4bln), $1.2000-05(E2.1bln)
- USD/JPY: Oct19 Y106.00($1.1bln); Oct20 Y106.35-44($2.3bln-USD calls); Oct21 Y105.00-10($1.7bln), Y105.90-106.00($2.2bln), Y106.65($1.0bln); Oct22 Y104.50-55($1.8bln), Y104.95-105.00($1.1bln), Y105.95-106.00($1.2bln); Oct26 Y103.95-104.00($1.5bln-USD puts), Y106.95-107.00($1.6bln); Oct27 Y105.00($1.1bln); Oct28 Y105.00($1.1bln)
- AUD/JPY: Oct22 Y76.44(A$2.1bln)
- AUD/NZD: Oct27 N$1.0809-20(A$2.5bln)
- USD/CNY: Oct19 Cny6.7735($1.0bln)
Why MNI
MNI is the leading provider
of intelligence and analysis on the Global Fixed Income, Foreign Exchange and Energy markets. We use an innovative combination of real-time analysis, deep fundamental research and journalism to provide unique and actionable insights for traders and investors. Our "All signal, no noise" approach drives an intelligence service that is succinct and timely, which is highly regarded by our time constrained client base.Our Head Office is in London with offices in Chicago, Washington and Beijing, as well as an on the ground presence in other major financial centres across the world.