-
Policy
Policy
Exclusive interviews with leading policymakers that convey the true policy message that impacts markets.
LATEST FROM POLICY: -
EM Policy
EM Policy
Exclusive interviews with leading policymakers that convey the true policy message that impacts markets.
LATEST FROM EM POLICY: -
G10 Markets
G10 Markets
Real-time insight on key fixed income and fx markets.
Launch MNI PodcastsFixed IncomeFI Markets AnalysisCentral Bank PreviewsFI PiFixed Income Technical AnalysisUS$ Credit Supply PipelineGilt Week AheadGlobal IssuanceEurozoneUKUSDeep DiveGlobal Issuance CalendarsEZ/UK Bond Auction CalendarEZ/UK T-bill Auction CalendarUS Treasury Auction CalendarPolitical RiskMNI Political Risk AnalysisMNI Political Risk - US Daily BriefMNI Political Risk - The week AheadElection Previews -
Emerging Markets
Emerging Markets
Real-time insight of emerging markets in CEMEA, Asia and LatAm region
-
Commodities
-
Credit
Credit
Real time insight of credit markets
-
Data
-
Global Macro
Global Macro
Actionable insight on monetary policy, balance sheet and inflation with focus on global issuance. Analysis on key political risk impacting the global markets.
Global MacroDM Central Bank PreviewsDM Central Bank ReviewsEM Central Bank PreviewsEM Central Bank ReviewsBalance Sheet AnalysisData AnalysisEurozone DataUK DataUS DataAPAC DataInflation InsightEmployment InsightGlobal IssuanceEurozoneUKUSDeep DiveGlobal Issuance Calendars EZ/UK Bond Auction Calendar EZ/UK T-bill Auction Calendar US Treasury Auction Calendar Global Macro Weekly -
About Us
To read the full story
Sign up now for free trial access to this content.
Please enter your details below.
Why MNI
MNI is the leading provider
of intelligence and analysis on the Global Fixed Income, Foreign Exchange and Energy markets. We use an innovative combination of real-time analysis, deep fundamental research and journalism to provide unique and actionable insights for traders and investors. Our "All signal, no noise" approach drives an intelligence service that is succinct and timely, which is highly regarded by our time constrained client base.Our Head Office is in London with offices in Chicago, Washington and Beijing, as well as an on the ground presence in other major financial centres across the world.
Real-time Actionable Insight
Get the latest on Central Bank Policy and FX & FI Markets to help inform both your strategic and tactical decision-making.
Free AccessMNI US Morning FX Analysis - Dollar Dropped as Polls Open
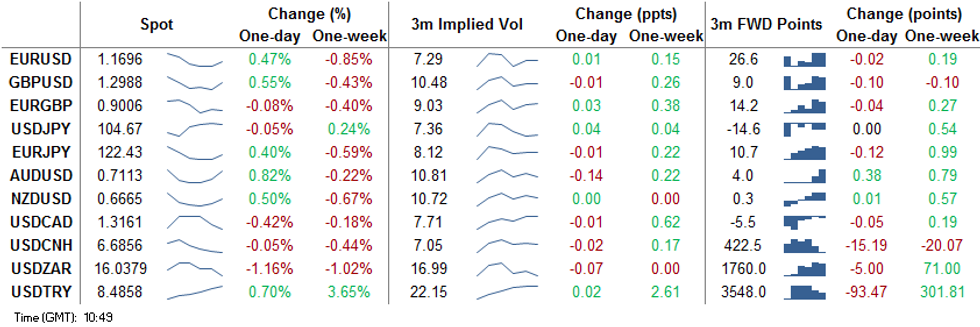
Dollar Dropped as Polls Open
The dollar is uniformly weaker on election day, with the greenback sliding sharply as global equities rally alongside Treasury yields. With polling booths due to open, early voting indications are for particularly high turnout, with markets appearing to price further the chances of a Biden victory as the results trickle through after the close. Betting markets look slightly more contentious, with Biden holding an implied chance of around 60% of victory.
AUD initially underperformed, sliding against all others in G10 as markets responded to the RBA's rate cut and expansion of stimulus. The Bank coupled the trimming of rates to 0.1% with a further A$100bln in bond buys, and tweaked forward guidance to indicate no rise in rates for the coming three years. AUD/USD was sold down to $0.7028, but the subsequent USD drop prompted a 1 cent rally in the pair ahead of NY hours.
Haven currencies are soft, with JPY and CHF weak, while NOK, AUD and GBP notch decent gains.
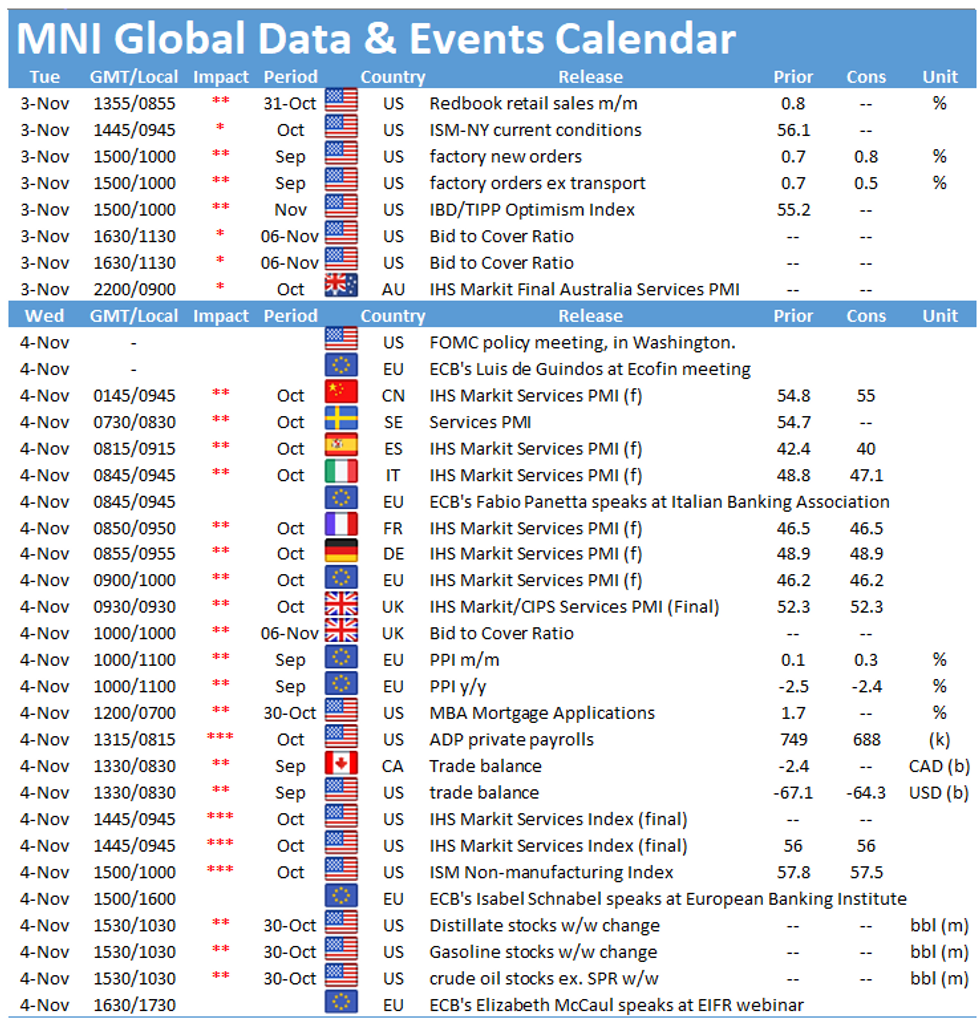
The data calendar is of little consequence, with just a speech from ECB's Knot on the speaker slate.
Overnight Vols Soar as Polls Open
Overnight implied vols for USD vs EUR, JPY and GBP have lurched considerably higher Tuesday as the contract begins to capture the Presidential election results. USD/JPY vols have been a notable mover, adding well over 15 points to hit 22 vols.
For EUR/USD, the contract is now clearing the best levels since the depths of the Coronavirus crisis and Italy's 2018 election which resulted in both the Five Star Movement and League claiming a leadership mandate.
Despite the acute rise in the very front-end of the vol curve, options activity is more muted so far Tuesday, with just USD/CNY and AUD/NZD seeing decent volumes. USD/JPY hedging activity is running at less than half the average for this time of day.
EUR/USD TECHS: Corrective Bounce
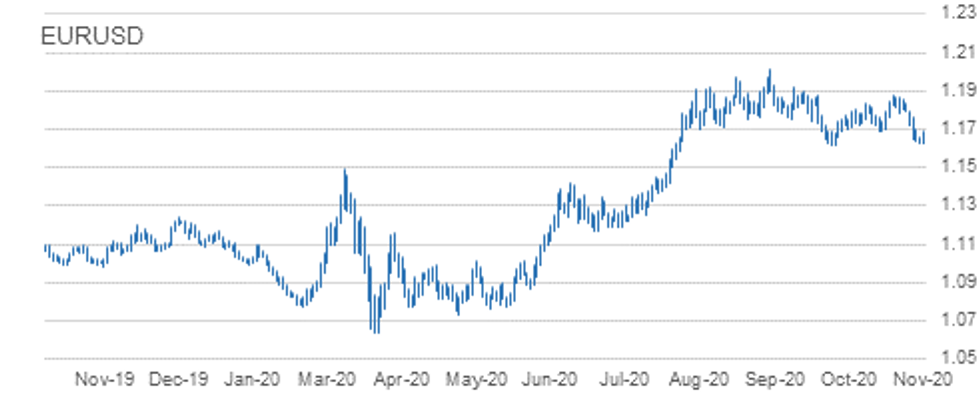
- RES 4: 1.1881 High Oct 21 and the bull trigger
- RES 3: 1.1798 High Oct 28
- RES 2: 1.1749 20-day EMA
- RES 1: 1.1704 High Oct 30
- PRICE: 1.1696 @ 10:27 GMT Nov 3
- SUP 1: 1.1623 Low Nov 2
- SUP 2: 1.1612 Low Sep 25 and the bear trigger
- SUP 3: 1.1576 0.764 proj of Sep 1 - 25 sell-off from Oct 21 high
- SUP 4: 1.1541 Low Jul 23
EURUSD maintains a bearish outlook with attention on the key support at 1.1612. Today's recovery is considered a correction. Last week's sell-off confirmed a clear breach of the S/T trendline support drawn off the Sep 28 low. The break, confirmed by a move below the Oct 29 low of 1.1718 and 1.1689, Oct 15 low strengthens the bearish case and has opened 1.1612, Sep 25 low and the primary bear trigger. Initial resistance remains 1.1704.
GBP/USD TECHS: Gains Considered A Correction
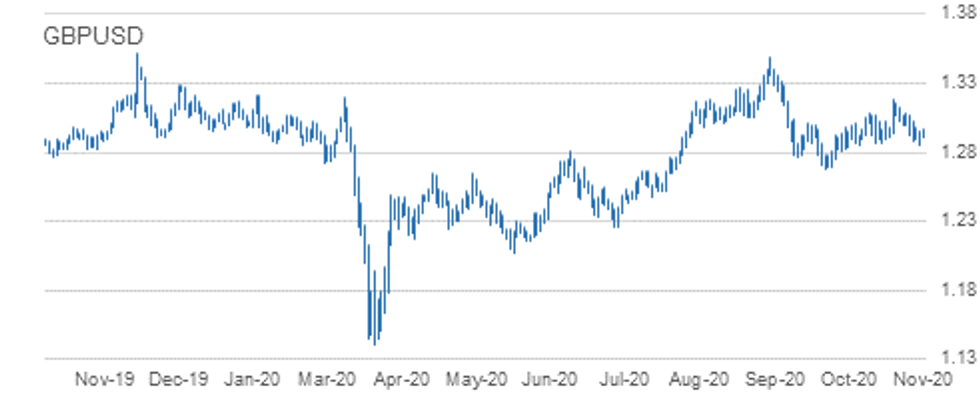
- RES 4: 1.3270 2.0% 10-dma envelope
- RES 3: 1.3177 High Oct 21 and the bull trigger
- RES 2: 1.3080 High Oct 27 and key near-term resistance
- RES 1: 1.3026 High Oct 29
- PRICE: 1.2991 @ 10:34 GMT Nov 3
- SUP 1: 1.2855 Low Nov 2
- SUP 2: 1.2863 Low Oct 14 and key near-term support
- SUP 3: 1.2806 Low Sep 30
- SUP 4: 1.2794 76.4% retracement of the Sep 23 - Oct 21 rally
GBPUSD is firmer as the pair corrects higher. The outlook remains bearish though following last week's extension lower. The break last week of 1.2940, Oct 21 low suggests scope for a deeper pullback with attention on 1.2863, Oct 14 low and a key S/T support. Clearance of this level would open 1.2794, a Fibonacci retracement. Initial firm resistance is seen at 1.3080, Oct 27 high. A break would ease bearish pressure and open 1.3177, Oct 21 high.
EUR/GBP TECHS: Bearish Trend Sequence Remains Intact
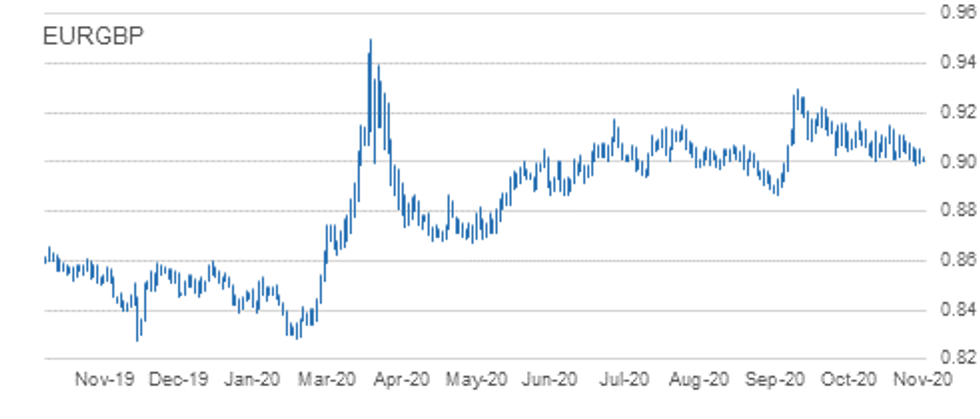
- RES 4: 0.9146/62 1.0% 10-dma envelope / High Oct 7
- RES 3: 0.9149 Oct 20 high
- RES 2: 0.9107 High Oct 23
- RES 1: 0.9062 50-day EMA
- PRICE: 0.9005 @ 10:37 GMT Nov 3
- SUP 1: 0.8984 Low Oct 30
- SUP 2: 0.8967 76.4% retracement of the Sep 3 - 11 rally
- SUP 3: 0.8925 Low Sep 7
- SUP 4: 0.8900 Low Sep 4
EURGBP traded lower Friday and cleared 0.9007, Oct 14 low. This confirmed a resumption of the downtrend that has been in place since reversing lower on Sep 11. The break lower maintains a bearish price sequence of lower lows and lower highs. This has exposed 0.8967 next, a retracement. Key short-term resistance is at 0.9149, Oct 20 high. Clearance of this level would undermine bearish conditions. Initial resistance is 0.9062, 50-day EMA.
USD/JPY TECHS: Corrective Bounce
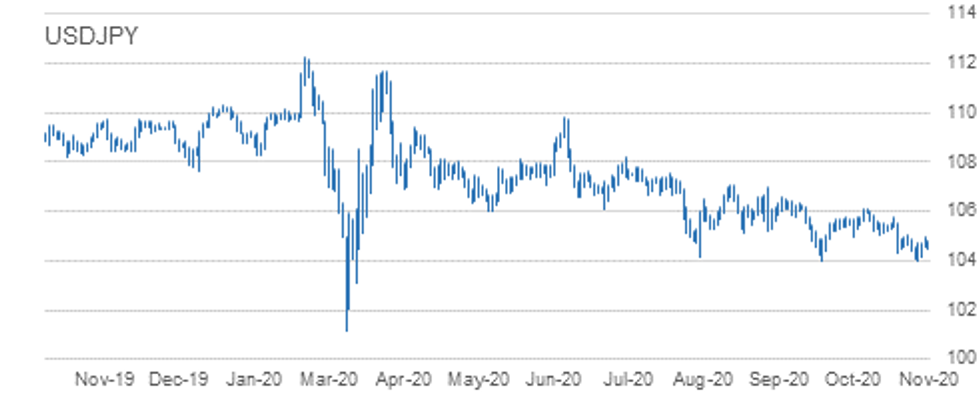
- RES 4: 105.75 High Oct 20
- RES 3: 105.46/53 50-dma / High Oct 21
- RES 2: 105.06 High Oct 26 and key near-term resistance
- RES 1: 104.95 High Nov 2
- PRICE: 104.65 @ 10:40 GMT Nov 3
- SUP 1: 104.00 Low Sep 21 and the bear trigger
- SUP 2: 103.67 76.4% retracement of the Mar 9 - 24 rally
- SUP 3: 103.09 Low Mar 12
- SUP 4: 102.02 Low Mar 10
USDJPY gains are considered corrective. The outlook remains bearish with attention on the key 104.00 handle, Sep 21 low. Clearance of this support would suggest scope for a deeper USD sell-off within the bear channel drawn off the Mar 24 high. A break lower would also confirm a resumption of the current downtrend and maintain the bearish price sequence of lower lows and lower highs. Firm near-term resistance is at 105.06.
EUR/JPY TECHS: Bearish Focus
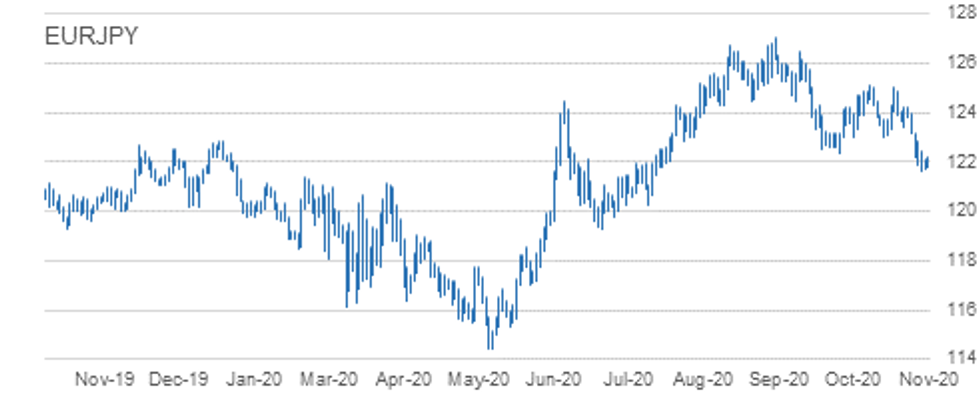
- RES 4: 123.75 50-day EMA
- RES 3: 123.36 20-day EMA
- RES 2: 123.19 High Oct 28
- RES 1: 122.46 High Oct 30
- PRICE: 122.41 @ 10:43 GMT Nov 3
- SUP 1: 121.50 0.764 proj of Sep 1 - 28 decline from Oct 9 high
- SUP 2: 120.68 Bear channel base drawn off the Sep 1 high
- SUP 3: 120.39 1.000 proj of Sep 1 - 28 decline from Oct 9 high
- SUP 4: 120.27 Low Oct 10
EURJPY is off recent lows but despite this maintains a bearish tone following last week's sell-off. The cross has recently cleared support at 123.03/02 and 122.38, Sep 28 low. This move lower confirmed a resumption of the downleg that started Sep 1. Scope is seen for weakness towards 121.50 next, a Fibonacci projection. Further out, 120.39 is on the radar, also a Fibonacci projection. Initial resistance is at 122.46, Friday's high.
AUD/USD TECHS: Tests Key Trendline Resistance
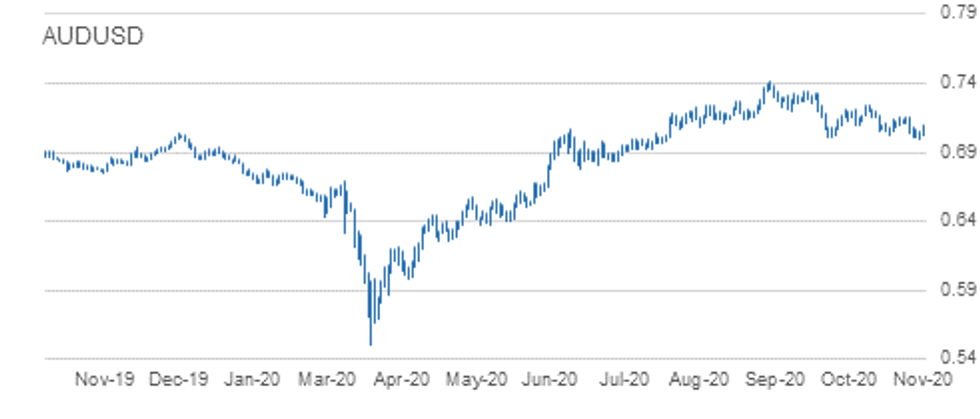
- RES 4: 0.7243 High Oct 10 and a key resistance
- RES 3: 0.7218 High Oct 13
- RES 2: 0.7158 High Oct 23
- RES 1: 0.7132 Trendline resistance drawn off the Sep 1 high
- PRICE: 0.7114 @ 10:53 GMT Nov 3
- SUP 1: 0.7028 Intraday low
- SUP 2: 0.6991 Low Nov 2
- SUP 3: 0.6965 23.6% retracement of the Mar - Sep rally
- SUP 4: 0.6941 2.0% 10-dma envelope
AUDUSD is firmer and has once again tested its key trendline resistance, at 0.7132 today. The trendline is drawn off the Sep 1 low and has capped gains a number of times since Sep 1. While it holds, the trend remains down. The recent break of support at 0.7006, Sep 25 low and 0.7002, Oct 29 low signals scope for 0.6965 next, a Fibonacci retracement. Clearance of the trendline would reverse the trend and expose potential 0.7243, Oct 10 high.
USD/CAD TECHS: Extends This Week's Slide
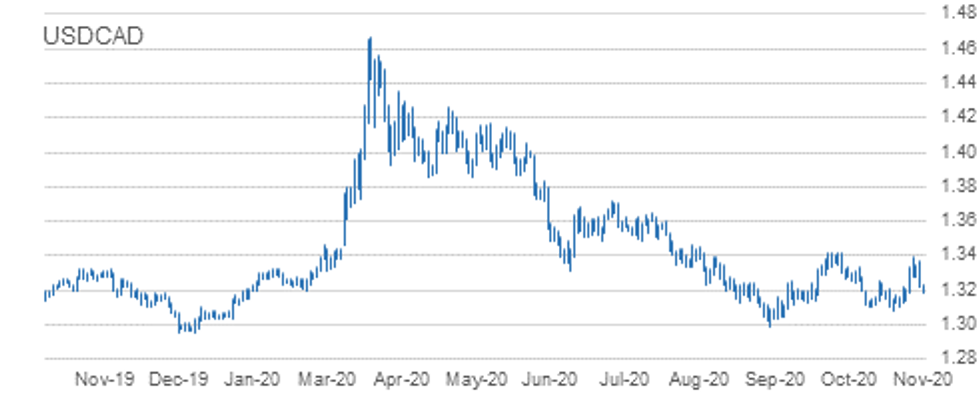
- RES 4: 1.3476 2.0% 10-dma envelope
- RES 3: 1.3421 High Sep 30 and primary resistance
- RES 2: 1.3390 High Oct 29
- RES 1: 1.3234 Intraday high
- PRICE: 1.3231 @ 06:21 GMT Nov 3
- SUP 1: 1.3138 Intraday low
- SUP 2: 1.3109 Low Oct 23
- SUP 3: 1.3081 Low Oct 21 and the bear trigger
- SUP 4: 1.3047 Low Sep 7
USDCAD sold off sharply yesterday and remains weaker today. Despite the pullback, a bullish outlook remains intact although this will be negated if support at 1.3081, Oct 21 low gives way. Last week's break of resistance at 1.3259, Oct 15 high as well as the break of 1.3341, Oct 7 high signals scope for a climb towards 1.3421, Sep 30 high and a primary resistance. An inability to remain above 1.3081 would instead expose 1.2994, Sep 1 low.
EUR/USD: MNI KEY LEVELS
- *$1.1893 Upper Bollinger Band (2%)
- *$1.1871 Upper 1.0% 10-dma envelope
- *$1.1849/51 100-mma/Jun14-2018 high
- *$1.1815 Sep24-2018 high
- *$1.1779/80/84 Cloud top/50-dma/55-dma
- *$1.1757/59 Sep27-2018 high/21-dma
- *$1.1750 200-hma
- *$1.1736 Fibo 38.2% 1.3993-1.0341
- *$1.1695 Cloud base
- *$1.1689 Intraday high
- *$1.1682 ***CURRENT MARKET PRICE 08:48GMT TUESDAY***
- *$1.1680 100-hma
- *$1.1662 100-dma
- *$1.1651 Sep28-2018 high
- *$1.1636/32 Lower 1.0% 10-dma env/Intraday low
- *$1.1628 Lower Bollinger Band (2%)
- *$1.1621 Oct16-2018 high
- *$1.1613/10 161.8% swing $1.1497-1.1309/Down Trendline from Jul18-2008
- *$1.1570 Jan10-2019 high
- *$1.1561 Lower Bollinger Band (3%)
- *$1.1540 Jan11-2019 high
GBP/USD: MNI KEY LEVELS
- *$1.3131/33 May07-2019 high/Apr12-2019 high
- *$1.3120 Upper Bollinger Band (2%)
- *$1.3109 Fibo 50% 1.1841-1.4377
- *$1.3080 May08-2019 high
- *$1.3041 May13-2019 high
- *$1.3003 55-dma
- *$1.2996/97/99 200-hma/Cloud top/61.8% 1.3381-1.2382
- *$1.2991 50-dma, May10-2019 low
- *$1.2981 21-dma
- *$1.2970/73 May14-2019 high/Intraday high
- *$1.2969 ***CURRENT MARKET PRICE 08:48GMT TUESDAY***
- *$1.2960 Cloud base
- *$1.2950 50-mma, 200-wma
- *$1.2943 100-hma
- *$1.2911 Intraday low
- *$1.2904 May14-2019 low
- *$1.2882/78 50% 1.3381-1.2382, 100-dma/Lower 1.0% 10-dma env
- *$1.2852/51 May16-2019 high/Lower Boll Band (2%)
- *$1.2833/31 Feb12-2019 low/Jan21-2019 low
- *$1.2825 Jan16-2019 low
- *$1.2813/10 May21-2019 high/61.8% 1.1841-1.4377
EUR/GBP: MNI KEY LEVELS
- *Gbp0.9126/29 Upper 1.0% 10-dma env/Upper Boll Band (2%)
- *Gbp0.9108 Jan03-2019 high
- *Gbp0.9101 Cloud top
- *Gbp0.9079 Cloud base
- *Gbp0.9068 50-dma
- *Gbp0.9059/62/63 21-dma/Jan11-2019 high/55-dma
- *Gbp0.9048/51/52 Jul16-2019 high/Jul17-2019 high/100-dma
- *Gbp0.9039/41 Jul18-2019 high/200-hma
- *Gbp0.9022/25 Intraday high/100-hma
- *Gbp0.9010 Jul10-2019 high
- *Gbp0.9007 ***CURRENT MARKET PRICE 08:48GMT TUESDAY***
- *Gbp0.9005/04 Jul23-2019 high/Intraday low
- *Gbp0.9000 Jul22-2019 high
- *Gbp0.8984 Lower Bollinger Band (2%)
- *Gbp0.8953/48 Jul23-2019 low/Lower Boll Band (3%)
- *Gbp0.8945 Lower 1.0% 10-dma envelope
- *Gbp0.8921 Jul02-2019 low
- *Gbp0.8911 200-dma
- *Gbp0.8874/73/72 Jun19-2019 low/Jun20-2019 low/Jun12-2019 low
- *Gbp0.8865 Fibo 61.8% 0.9108-0.8473
- *Gbp0.8855 Lower 2.0% 10-dma envelope
USD/JPY: MNI KEY LEVELS
- *Y105.77 Cloud top
- *Y105.68 Upper 1.0% 10-dma envelope
- *Y105.48 55-dma
- *Y105.42 50-dma
- *Y105.16 Cloud base
- *Y105.11 21-dma
- *Y105.07 Cloud Kijun Sen
- *Y104.87 Jan03-2019 low
- *Y104.80 Intraday high
- *Y104.62 200-hma
- *Y104.57 ***CURRENT MARKET PRICE 08:48GMT TUESDAY***
- *Y104.56/55/54 Mar26-2018 low/Cloud Tenkan Sen/100-hma
- *Y104.48 Intraday low
- *Y104.05 Lower Bollinger Band (2%)
- *Y104.00 YTD low
- *Y103.94 200-mma
- *Y103.58 Lower 1.0% 10-dma envelope
- *Y103.54 Lower Bollinger Band (3%)
- *Y102.54 Lower 2.0% 10-dma envelope
- *Y101.49 Lower 3.0% 10-dma envelope
- *Y101.20 Nov09-2016 low
EUR/JPY: MNI KEY LEVELS
- *Y123.51 May22-2019 high
- *Y123.36 Cloud Kijun Sen
- *Y123.18 Jun11-2019 high
- *Y123.11 Fibo 50% 118.71-127.50
- *Y123.08 Fibo 38.2% 126.81-120.78
- *Y123.01 Jun12-2019 high
- *Y122.94 200-hma
- *Y122.93 Cloud Tenkan Sen
- *Y122.56 Jun13-2019 high
- *Y122.23/24 Jul12-2019 high/Intraday high
- *Y122.17 ***CURRENT MARKET PRICE 08:48GMT TUESDAY***
- *Y122.13/11 Jun17-2019 high/100-hma
- *Y122.07 Fibo 61.8% 118.71-127.50
- *Y121.95 Fibo 50% 94.12-149.78
- *Y121.92 Jun20-2019 high
- *Y121.85 Jul15-2019 high
- *Y121.81 Intraday low
- *Y121.78 100-wma
- *Y121.76 Lower 1.0% 10-dma envelope
- *Y121.63 Lower Bollinger Band (2%)
- *Y121.42 Jul15-2019 low
AUD/USD: MNI KEY LEVELS
- *$0.7229 Upper Boll Band (2%), Upper 2.0% 10-dma env
- *$0.7206/07 Apr17-2019 high/Feb21-2019 high
- *$0.7191/93 Cloud base/Cloud top
- *$0.7182 50-dma, 55-dma
- *$0.7159 Upper 1.0% 10-dma envelope
- *$0.7153 Apr17-2019 low
- *$0.7140 Apr16-2019 low
- *$0.7116/17 Apr12-2019 low/100-dma
- *$0.7110/12 Apr10-2019 low/21-dma
- *$0.7098 Intraday high
- *$0.7094 ***CURRENT MARKET PRICE 08:48GMT TUESDAY***
- *$0.7088/83 Apr08-2019 low/200-hma
- *$0.7073/69 Mar29-2019 low/Apr30-2019 high
- *$0.7057/53 Jul22-2019 high/Apr02-2019 low
- *$0.7048/44 Jul04-2019 high, May07-2019 high/Jul16-2019 high
- *$0.7041 100-hma
- *$0.7028 Intraday low
- *$0.7017 Lower 1.0% 10-dma envelope
- *$0.6996 Lower Bollinger Band (2%)
- *$0.6985 Jan03-2019 low
- *$0.6971/67 Jul12-2019 low/Jun11-2019 high
USD/CAD: MNI KEY LEVELS
- *C$1.3345/49 Jun12-2019 high/Upper 1.0% 10-dma env
- *C$1.3324/28/29 100-dma/38.2% 1.2783-1.3665/Upper Boll Band (2%)
- *C$1.3309 Fibo 38.2% 1.3565-1.3151
- *C$1.3297/99/00 Cloud top/100-hma/Jun13-2019 low
- *C$1.3286 Jun20-2019 high
- *C$1.3240 Cloud base
- *C$1.3232/34 200-hma/Intraday high
- *C$1.3224/26 50% 1.2783-1.3665/Jun10-2019 low
- *C$1.3206/07 55-dma/50-dma
- *C$1.3199 21-dma
- *C$1.3182 ***CURRENT MARKET PRICE 08:48GMT TUESDAY***
- *C$1.3180 50-mma, Intraday low
- *C$1.3164/63/60 Jul23-2019 high/Feb21-2019 low/200-wma
- *C$1.3151/50 Jun20-2019 low/Feb20-2019 low
- *C$1.3120/16 61.8% 1.2783-1.3665/Jul23-2019 low
- *C$1.3113 Feb25-2019 low
- *C$1.3107 Jun26-2019 low
- *C$1.3085 Lower 1.0% 10-dma envelope
- *C$1.3066 Fibo 38.2% 1.4690-1.2062
- *C$1.3058 Lower Bollinger Band (2%)
- *C$1.3053 Fibo 38.2% 1.2062-1.3665
OPTIONS: Expiries for Nov3 NY cut 1000ET (Source DTCC)
- EUR/USD: $1.1435-50(E529mln), $1.1590-00(E620mln-EUR puts), $1.1650(E622mln), $1.1725(E585mln-EUR puts), $1.1895-1.1905(E1.5bln)
- USD/JPY: Y104.50-55($540mln), Y105.45-50($1.4bln)
- GBP/USD: $1.2850(Gbp684mln-GBP puts), $1.3000(Gbp456mln), $1.3100(Gbp631mln-GBP calls)
- EUR/GBP: Gbp0.9000(E720mln-EUR puts)
- USD/CHF: Chf0.9200($675mln-USD calls)
- AUD/USD: $0.7000(A$706mln), $0.7035-55(A$847mln)
- USD/CAD: C$1.2995-1.3005($550mln)
- USD/CNY: Cny6.5334($1.2bln), Cny6.72($500mln)
Larger Option Pipeline
- EUR/USD: Nov06 $1.1600(E1.7bln), $1.1795-05(E1.4bln)
- USD/JPY: Nov04 Y105.00($1.2bln), Y106.00-10($1.3bln); Nov05 Y105.00($934mln), Y106.06-09($1.6bln); Nov06 Y104.89-00($1.0bln)
- EUR/JPY: Nov05 Y124.50(E1.1bln)
- USD/CNY: Nov05 Cny6.75($1.1bln), Cny6.80($1.9bln), Cny6.85($1.3bln); Nov06 Cny6.70($1.2bln)
To read the full story
Sign up now for free trial access to this content.
Please enter your details below.
Why MNI
MNI is the leading provider
of intelligence and analysis on the Global Fixed Income, Foreign Exchange and Energy markets. We use an innovative combination of real-time analysis, deep fundamental research and journalism to provide unique and actionable insights for traders and investors. Our "All signal, no noise" approach drives an intelligence service that is succinct and timely, which is highly regarded by our time constrained client base.Our Head Office is in London with offices in Chicago, Washington and Beijing, as well as an on the ground presence in other major financial centres across the world.
