
Why MNI
MNI is the leading provider
of intelligence and analysis on the Global Fixed Income, Foreign Exchange and Energy markets. We use an innovative combination of real-time analysis, deep fundamental research and journalism to provide unique and actionable insights for traders and investors. Our "All signal, no noise" approach drives an intelligence service that is succinct and timely, which is highly regarded by our time constrained client base.Our Head Office is in London with offices in Chicago, Washington and Beijing, as well as an on the ground presence in other major financial centres across the world.
Manufacturing Still Outstripping Services in October PMIs
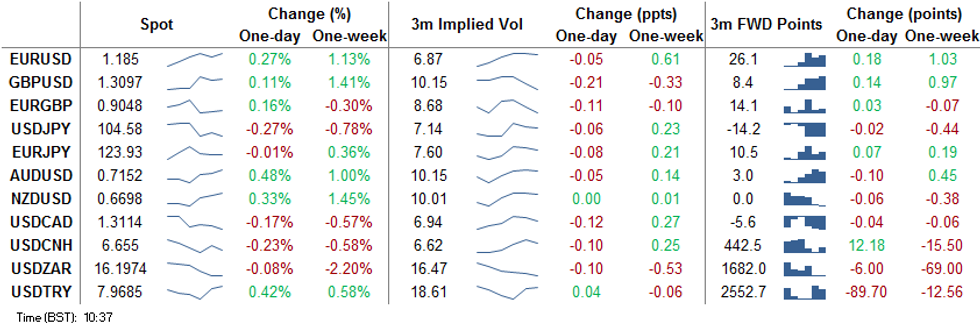
The USD is weaker, but in a range, early Friday, with most major pairs bouncing after early weakness in Asia-Pac hours. EUR/USD bottomed out at 1.1787 but has rallied smartly since to trade just shy of 1.1850 at the NY crossover. The final Presidential debate provided little new, with both candidates sticking to recent rhetoric and offering much heat, but little light.
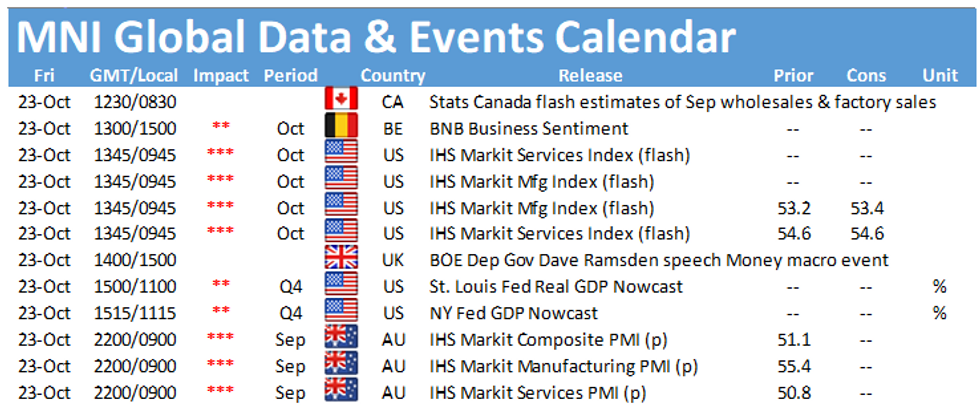
Global prelim PMI numbers for October continue to show a far swifter recovery for the manufacturing sector over services, with the Eurozone manufacturing component topping expectations while services fell short of forecast.
AUD is outperforming modestly, prompting a new weekly high in AUD/USD as October PMIs showed both the services and manufacturing sectors bouncing well. The 50-dma is now within reach at $0.7199.
Focus turns to US PMI data after the opening bell as well as speeches from ECB's Villeroy and BoE's Ramsden.
EUR/USD TECHS: Recovers Off The Day Low
- RES 4: 1.2011 High Sep and key resistance
- RES 3: 1.1917 76.4% retracement of the Sep 1 - 25 sell-off
- RES 2: 1.1901 1.0% 10-dma envelope
- RES 1: 1.1881 High Oct 21
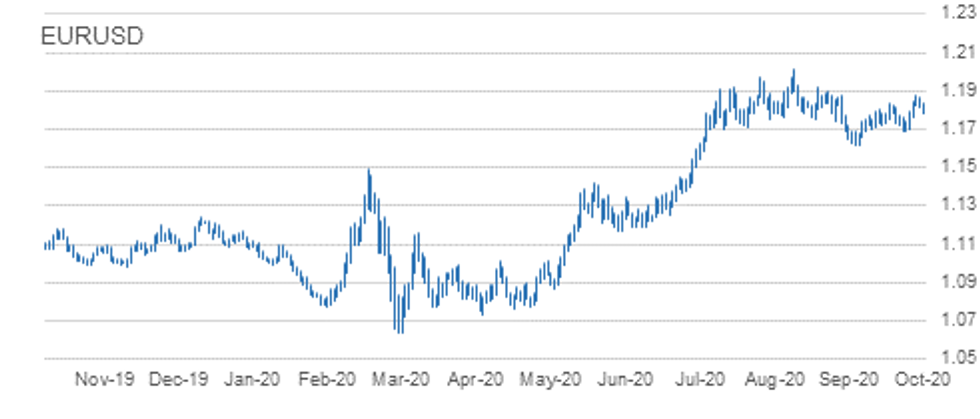
- PRICE: 1.1845 @ 10:19 BST Oct 23
- SUP 1: 1.1787/60 Intraday low / Low Oct 20
- SUP 2: 1.1739 50-day EMA
- SUP 3: 1.1723 Trendline support drawn off the Sep 28 low
- SUP 4: 1.1689 Low Oct 15 and a key support
EURUSD has recovered off today's earlier low. The outlook is positive and pullbacks considered corrective. This week's bullish theme has been reinforced by the break of the former bull trigger at 1.1831, Oct 9 high. The breach signals scope for gains towards 1.1917 next, a Fibonacci retracement level with the major resistance and hurdle for bulls at 1.2011, Sep 1 high. On the downside, initial firm support lies at 1.1760, Tuesday's low.
GBP/USD TECHS: Corrective Pullback
- RES 4: 1.3292 76.4% retracement of the Sep 1 - 23 sell-off
- RES 3: 1.3260 2.0% 10-dma envelope
- RES 2: 1.3233 Former trendline support drawn off the Mar 20 low
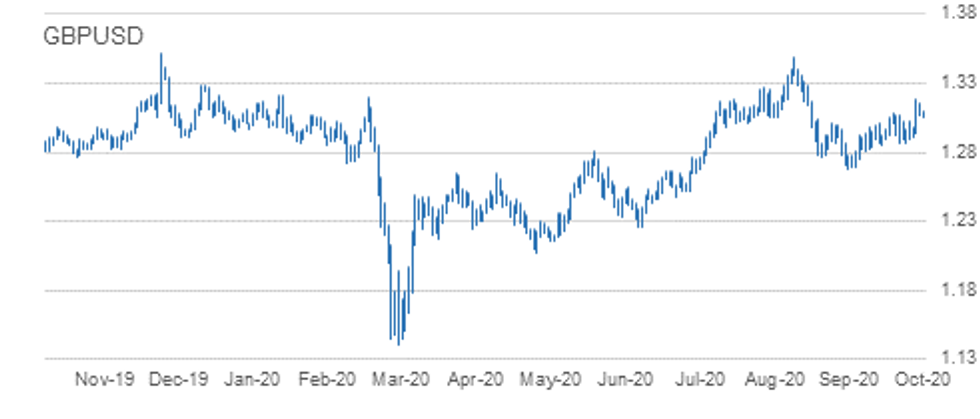
- RES 1: 1.3177 High Oct 21
- PRICE: 1.3100 @ 10:26 BST Oct 23
- SUP 1: 1.3025 High Oct 19
- SUP 2: 1.2940 Low Oct 21
- SUP 3: 1.2863 Low Oct 14 and key near-term support
- SUP 4: 1.2806 Low Sep 30
EUR/GBP TECHS: Focus Is On Key Support
- RES 4: 0.9162 High Oct 7
- RES 3: 0.9155 1.0% 10-dma envelope
- RES 2: 0.9149 Oct 20 high
- RES 1: 0.9078 20-day EMA
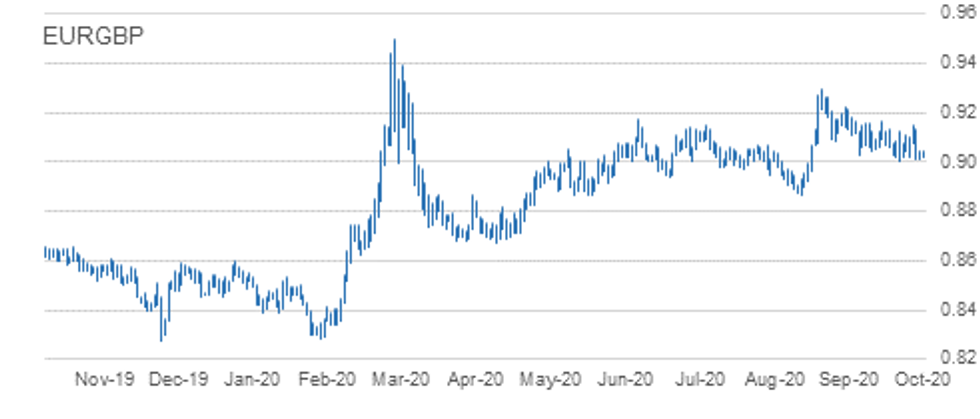
- PRICE: 0.9047 @ 10:33 BST Oct 23
- SUP 1: 0.9012 Low Oct 21
- SUP 2: 0.9007 Low Oct 14 and the bear trigger
- SUP 3: 0.8967 76.4% retracement of the Sep 3 - 11 rally
- SUP 4: 0.8925 Low Sep 7
EURGBP remains vulnerable following Wednesday's sharp move lower. The cross has moved below the 50-day EMA once again and attention is on support at 0.9007, Oct 14 low and the near-term bear trigger. A break of 0.9007 would confirm a resumption of the downtrend that started Sep11 and open 0.8967, a retracement point. Key resistance has been defined at 0.9149, Tuesday's high. The outlook is bearish below this level.
USD/JPY TECHS: Vulnerable
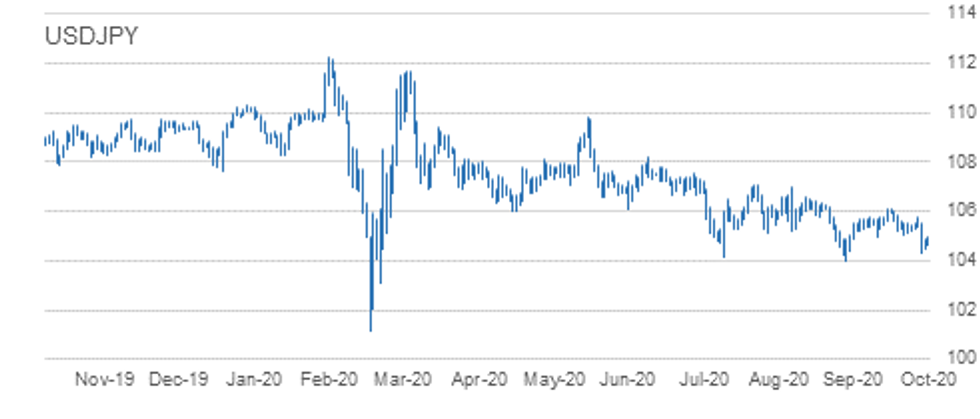
- RES 4: 106.11 High Oct 7 and key resistance
- RES 3: 105.75 High Oct 20
- RES 2: 105.53/65 High Oct 21 / 50-dma
- RES 1: 105.04 Low Oct 4 and a recent breakout level
- PRICE: 104.58 @ 10:39 BST Oct 23
- SUP 1: 104.34 Low Oct 21
- SUP 2: 104.00 Low Sep 21 and the bear trigger
- SUP 3: 103.67 76.4% retracement of the Mar 9 - 24 rally
- SUP 4: 103.09 Low Mar 12
USDJPY maintains a weaker outlook following the Wednesday sell-off and this week's confirmation of a resumption of the downleg from 106.11, Oct 7 high. A number of important supports have been cleared this week signalling scope for a deeper pullback towards the key 104.00 handle, Sep 21 low. A break of 104.00 would signal scope for further USD depreciation within the bear channel drawn off the Mar 24 high. Initial resistance is at 105.04.
EUR/JPY TECHS: Trading Below Recent Highs
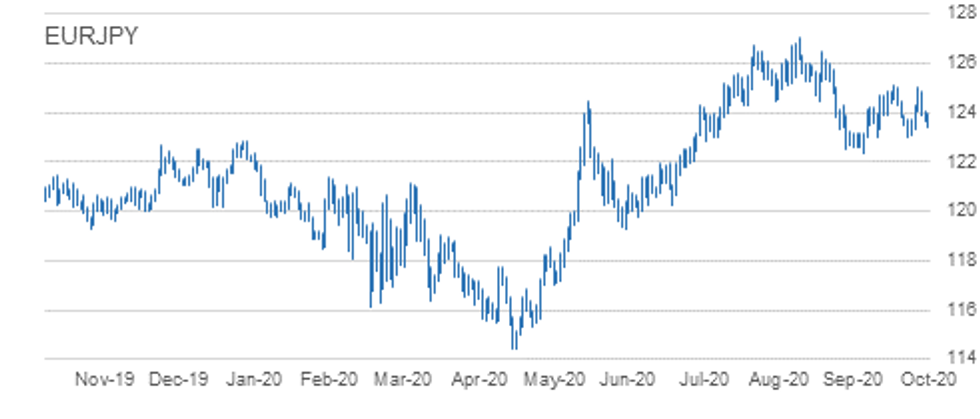
- RES 4: 125.97 76.4% retracement of the Sep 1 - 28 sell-off
- RES 3: 125.28 61.8% of the Sep 1 - 28 sell-off
- RES 2: 125.00/09 High Oct 20 and Oct 9
- RES 1: 124.09 Oct 22 high
- PRICE: 123.94 @ 10:46 BST Oct 23
- SUP 1: 123415 Intraday low
- SUP 2: 123.03/02 Low Sep 29 and Oct 2 / Low Oct 15
- SUP 3: 122.38/28 Low Sep 28 / 61.8% of the Jun 22 - Sep 1 rally
- SUP 4: 122.25 38.2% retracement of the May - Sep rally
EURJPY is still trading below recent highs. Attention is on support at 123.03/02, low prints between Sep 29 and Oct 15 following this week's pullback. A break of this level would undermine the recent bullish outlook and instead highlight risk for a deeper sell-off towards 122.38, Sep 28 low and the bear trigger. Moving average studies are in a neutral position. To strengthen a bullish argument, price needs to clear key resistance at 125.09, Oct 9 high.
AUD/USD TECHS: Bearish Below Trendline Resistance
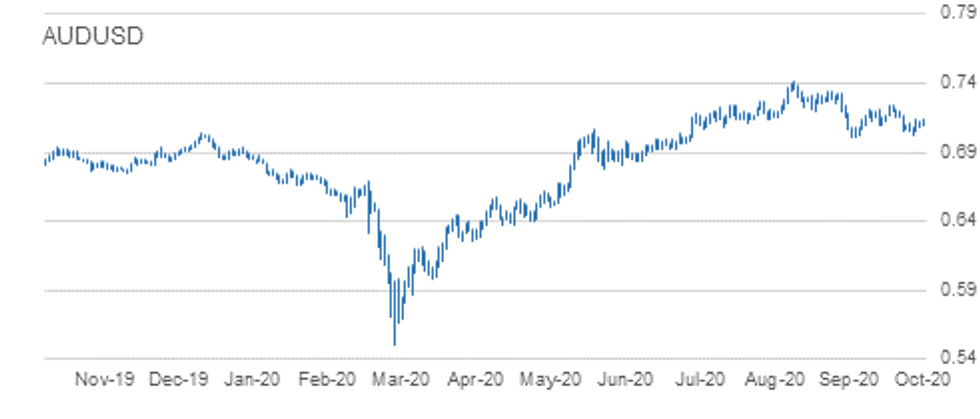
- RES 4: 0.7243 High Oct 10 and the intraday bull trigger
- RES 3: 0.7176 Trendline resistance drawn off the Sep 1 high
- RES 2: 0.7170 High Oct 15
- RES 1: 0.7158 Intraday high
- PRICE: 0.7149 @ 10:49 BST Oct 23
- SUP 1: 0.7021 Low Oct 20
- SUP 2: 0.7006 Low Sep 25 and the bear trigger
- SUP 3: 0.6965 23.6% retracement of the Mar - Sep rally
- SUP 4: 0.6931 0.764 projection of Sep 1 - 25 sell-off from Oct 9 high
AUDUSD outlook remains bearish despite this week's recovery. The pair continues to trade below trendline resistance drawn off the Sep 1 high. The line intersects at 0.7176 and the recent failure at the trendline highlights bearish risk. Attention is on the primary support and bear trigger at 0.7006, Sep 25 low. A trendline resistance break is needed to alter the picture and signal a stronger reversal. This would open 0.7243, Oct 10 high.
USD/CAD TECHS: Bearish Conditions Dominate
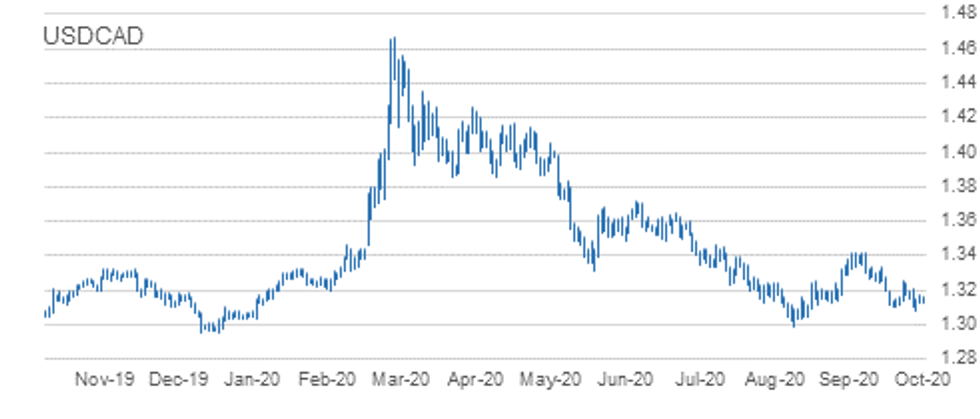
- RES 4: 1.3421 High Sep 30 and primary resistance
- RES 3: 1.3341 High Oct 7
- RES 2: 1.3246/59 50-day EMA / High Oct 15 and the bull trigger
- RES 1: 1. 3197 20-day EMA
- PRICE: 1.3116 @ 10:52 BST Oct 23
- SUP 1: 1.3081 Low Oct 21 and the intraday bear trigger
- SUP 2: 1.3047 Low Sep 7
- SUP 3: 1.3038 Low Sep 2
- SUP 4: 1.2994 Low Sep 1 and the major support
USDCAD bearish conditions continue to dominate. The pair has traded below key support at 1.3099 this week, Oct 13 low. The move lower confirms a resumption of the current downtrend that started Sep 30. Moving average studies are bearish too, reinforcing the current climate. Scope exists for a move towards the major support at 1.2994, Sep 1 low. Key resistance has been defined at 1.3259, Oct 15 high.
EUR/USD: MNI KEY LEVELS
- *$1.2019 Upper 2.0% 10-dma envelope
- *$1.2009/11 May03-2018 high/YTD Sep01 high
- *$1.1996 May14-2018 high
- *$1.1938 May15-2018 high
- *$1.1915 Upper Bollinger Band (3%)
- *$1.1901 Upper 1.0% 10-dma envelope
- *$1.1865 Upper Bollinger Band (2%)
- *$1.1857 100-mma
- *$1.1851 Cloud top, Jun14-2018 high
- *$1.1831 Intraday high
- *$1.1830 ***CURRENT MARKET PRICE 08:54BST FRIDAY***
- *$1.1816/15 100-hma/Sep24-2018 high
- *$1.1798/96 50-dma/55-dma
- *$1.1787 Intraday low
- *$1.1775 200-hma
- *$1.1758/57 21-dma/Sep27-2018 high
- *$1.1736 Fibo 38.2% 1.3993-1.0341
- *$1.1665/64 Lower 1.0% 10-dma env/Lower Boll Band (2%)
- *$1.1651 Sep28-2018 high
- *$1.1633 Cloud base, 100-dma
- *$1.1622/21 Down Trendline from Jul18-2008/Oct16-2018 high
GBP/USD: MNI KEY LEVELS
- *$1.3266/69 Upper 2.0% 10-dma env/Mar27-2019 high
- *$1.3213/16 Mar28-2019 high/Upper Boll Band (3%)
- *$1.3196 Apr03-2019 high
- *$1.3191 Apr04-2019 high
- *$1.3185 May06-2019 high
- *$1.3144 Fibo 38.2% 1.4377-1.2382
- *$1.3136 Upper 1.0% 10-dma envelope
- *$1.3131/32/33 May07-2019 high/Upper Boll Band (2%)/Apr12-2019 high
- *$1.3109 Fibo 50% 1.1841-1.4377
- *$1.3098 Intraday high
- *$1.3097 ***CURRENT MARKET PRICE 08:54BST FRIDAY***
- *$1.3080 May08-2019 high
- *$1.3072 Cloud top
- *$1.3051 Intraday low
- *$1.3041 May13-2019 high
- *$1.3032 100-hma
- *$1.3019/15 55-dma/50-dma
- *$1.2999 Fibo 61.8% 1.3381-1.2382
- *$1.2993/91 200-hma/May10-2019 low
- *$1.2981 Cloud base
- *$1.2970 May14-2019 high
EUR/GBP: MNI KEY LEVELS
- *Gbp0.9143 Upper Bollinger Band (2%)
- *Gbp0.9134 Sep11-2017 high
- *Gbp0.9108 Jan03-2019 high
- *Gbp0.9094 Cloud top
- *Gbp0.9078/79 21-dma/Cloud base
- *Gbp0.9067 100-hma
- *Gbp0.9062/65 55-dma, 200-hma, Jan11-2019 high/50-dma
- *Gbp0.9051 Jul17-2019 high
- *Gbp0.9046/48 100-dma/Jul16-2019 high
- *Gbp0.9039/42 Jul18-2019 high/Intraday high
- *Gbp0.9032 ***CURRENT MARKET PRICE 08:54BST FRIDAY***
- *Gbp0.9021 Intraday low
- *Gbp0.9010/09 Jul10-2019 high/Lower Boll Band (2%)
- *Gbp0.9005/00 Jul23-2019 high/Jul22-2019 high
- *Gbp0.8976 Lower Bollinger Band (3%)
- *Gbp0.8970 Lower 1.0% 10-dma envelope
- *Gbp0.8953 Jul23-2019 low
- *Gbp0.8921 Jul02-2019 low
- *Gbp0.8890 200-dma
- *Gbp0.8879 Lower 2.0% 10-dma envelope
- *Gbp0.8874/73/72 Jun19-2019 low/Jun20-2019 low/Jun12-2019 low
USD/JPY: MNI KEY LEVELS
- *Y105.70 55-dma
- *Y105.62 Cloud base
- *Y105.61 50-dma
- *Y105.43 21-dma
- *Y105.22 200-hma
- *Y105.09 100-hma
- *Y105.06 Cloud Kijun Sen
- *Y105.05 Cloud Tenkan Sen
- *Y104.94 Intraday high
- *Y104.87 Jan03-2019 low
- *Y104.69 ***CURRENT MARKET PRICE 08:54BST FRIDAY***
- *Y104.68/67 Lower Boll Band (2%)/Intraday low
- *Y104.56 Mar26-2018 low
- *Y104.31 Lower Bollinger Band (3%)
- *Y104.14 Lower 1.0% 10-dma envelope
- *Y103.94 200-mma
- *Y103.09 Lower 2.0% 10-dma env, YTD Mar12 low
- *Y102.03 Lower 3.0% 10-dma envelope
- *Y101.20 Nov09-2016 low
- *Y100.75 Sep30-2016 low
- *Y100.61 Fibo 50% 75.35-125.86
EUR/JPY: MNI KEY LEVELS
- *Y124.51 Fibo 61.8% 126.81-120.78
- *Y124.34 Apr01-2019 low
- *Y124.25 May07-2019 high
- *Y124.22 Fibo 38.2% 133.13-118.71
- *Y124.17 100-hma
- *Y124.14 Fibo 38.2% 118.71-127.50
- *Y124.02 Intraday high
- *Y124.01 Cloud Tenkan Sen
- *Y123.97 21-dma
- *Y123.89 200-hma
- *Y123.85 ***CURRENT MARKET PRICE 08:54BST FRIDAY***
- *Y123.80 Fibo 50% 126.81-120.78
- *Y123.74 May21-2019 high, Cloud Kijun Sen
- *Y123.72 Fibo 61.8% 115.21-137.50
- *Y123.68 Cloud base
- *Y123.54 Fibo 50% 109.57-137.50
- *Y123.53 100-dma
- *Y123.51 May22-2019 high
- *Y123.41 Intraday low
- *Y123.18 Jun11-2019 high
- *Y123.11 Fibo 50% 118.71-127.50
AUD/USD: MNI KEY LEVELS
- *$0.7271/74 Cloud top/Dec06-2018 high
- *$0.7262/63 Upper 2.0% 10-dma env/50-mma
- *$0.7244 200-wma
- *$0.7236 Upper Bollinger Band (2%)
- *$0.7206/07 Apr17-2019 high/Feb21-2019 high
- *$0.7199 50-dma
- *$0.7191/95 Upper 1.0% 10-dma env/55-dma
- *$0.7168 Cloud base
- *$0.7153 Apr17-2019 low
- *$0.7139/40 Intraday high/Apr16-2019 low
- *$0.7136 ***CURRENT MARKET PRICE 08:54BST FRIDAY***
- *$0.7132 21-dma
- *$0.7116 Apr12-2019 low
- *$0.7110/07/06 Apr10-2019 low/100-dma/200-hma
- *$0.7102 Intraday low
- *$0.7088 Apr08-2019 low, 100-hma
- *$0.7073/69 Mar29-2019 low/Apr30-2019 high
- *$0.7057/53 Jul22-2019 high/Apr02-2019 low
- *$0.7049/48 Lower 1.0% 10-dma env/Jul04-2019 high, May07-2019 high
- *$0.7044 Jul16-2019 high
- *$0.7038 Lower Bollinger Band (2%)
USD/CAD: MNI KEY LEVELS
- *C$1.3300 Jun13-2019 low
- *C$1.3286 Upper 1.0% 10-dma env, Jun20-2019 high
- *C$1.3224/26 50% 1.2783-1.3665/21-dma, Jun10-2019 low
- *C$1.3206 55-dma
- *C$1.3199 50-dma
- *C$1.3175 50-mma
- *C$1.3164 Jul23-2019 high
- *C$1.3158/60/63 Intraday high/200-wma, 200-hma/Feb21-2019 low
- *C$1.3149/50/51 100-hma/Feb20-2019 low/Jun20-2019 low
- *C$1.3143 Cloud base
- *C$1.3130 ***CURRENT MARKET PRICE 08:54BST FRIDAY***
- *C$1.3124/20 Intraday low/61.8% 1.2783-1.3665
- *C$1.3116/13 Jul23-2019 low/Feb25-2019 low
- *C$1.3107 Jun26-2019 low
- *C$1.3066 Fibo 38.2% 1.4690-1.2062
- *C$1.3053 Fibo 38.2% 1.2062-1.3665
- *C$1.3041 Lower Bollinger Band (2%)
- *C$1.3023 Lower 1.0% 10-dma envelope
- *C$1.3015 Oct25-2018 low
- *C$1.2970/69 Oct24-2018 low/YTD Jan02 low
- *C$1.2953 Lower Bollinger Band (3%)
Expiries for Oct23 NY cut 1000ET (Source DTCC)
EUR/USD: $1.1750-55(E1.3bln), $1.1800(E2.0bln), $1.1830-50(E2.0bln), $1.1975(E518mln), $1.2000(E1.4bln)
USD/JPY: Y103.00($1.3bln), Y105.00($751mln), Y105.40-60($1.2bln), Y105.85($628mln)
GBP/USD: $1.3090-1.3100(Gbp1.1bln-GBP calls)
AUD/USD: $0.7180(A$827mln)
USD/CAD: C$1.3080($936mln), C$1.3190-00($576mln)
Larger Option Pipeline
- EUR/USD: Oct26 $1.1500(E1.8bln), $1.1650-60(E1.6bln), $1.1830-45(E1.1bln); Oct28 $1.1745-60(E1.1bln), $1.1800-05(E1.5bln), $1.2000-05(E2.9bln); Oct30 $1.1800(E1.1bln), $1.1850(E1.2bln), $1.1950(E1.7bln-EUR calls), $1.2000(E1.1bln); Nov03 $1.1900-05(E1.1bln)
- USD/JPY: Oct26 Y103.95-104.00($2.5bln-USD puts), Y105.30-40($1.7bln), Y105.60-75($1.2bln), Y106.95-107.00($1.6bln); Oct27 Y105.00($1.3bln), Y106.00-05($1.2bln); Oct28 Y104.85-90($1.2bln), Y105.00($1.5bln); Oct29 Y103.20-25($1.6bln), Y104.00($1.6bln), Y105.25($1.3bln), Y105.55-65($2.2bln), Y106.00($1.2bln); Oct30 Y104.50($1.9bln), Y104.80-85($1.1bln), Y106.00-05($2.2bln); Nov03 Y105.45-49($1.3bln); Nov04 Y105.00($1.1bln); Nov05 Y106.06-09($1.6bln)
- EUR/JPY: Oct26 Y122.80(E1.2bln); Nov05 Y124.50(E1.0bln)
- EUR/GBP: Oct26 Gbp0.8900(E880mln), Gbp0.9000(E2.1bln-EUR puts); Nov02 Gbp0.8900(E1.6bln-EUR puts)
- AUD/USD: Oct27 $0.6680(A$1.1bln); Nov02 $0.7140-45(A$1.5bln)
- AUD/JPY: Oct29 Y73.20(A$1.0bln-AUD puts), Y76.35-40(A$2.4bln-AUD calls)
- AUD/NZD: Oct27 N$1.0809-20(A$2.5bln); Oct30 N$1.0750(A$1.2bln)
- USD/CNY: Nov03 Cny6.5334($1.1bln); Nov05 Cny6.75($1.0bln), Cny6.80($1.9bln), Cny6.85($1.3bln)
Why MNI
MNI is the leading provider
of intelligence and analysis on the Global Fixed Income, Foreign Exchange and Energy markets. We use an innovative combination of real-time analysis, deep fundamental research and journalism to provide unique and actionable insights for traders and investors. Our "All signal, no noise" approach drives an intelligence service that is succinct and timely, which is highly regarded by our time constrained client base.Our Head Office is in London with offices in Chicago, Washington and Beijing, as well as an on the ground presence in other major financial centres across the world.