
Free Trial
Why MNI
MNI is the leading provider
of intelligence and analysis on the Global Fixed Income, Foreign Exchange and Energy markets. We use an innovative combination of real-time analysis, deep fundamental research and journalism to provide unique and actionable insights for traders and investors. Our "All signal, no noise" approach drives an intelligence service that is succinct and timely, which is highly regarded by our time constrained client base.Our Head Office is in London with offices in Chicago, Washington and Beijing, as well as an on the ground presence in other major financial centres across the world.
US INFLATION
The New York Fed's modelled estimate of Multivariate Core Trend (MCT) inflation ticked lower to 2.36% in May from 2.51% in April.
- As the Bank's researchers note, that's 0.56ppts above the pre-pandemic average, with that figure in turn roughly split between housing and services-ex housing (goods were slightly negative). The 0.56pp differential is the lowest since December 2020 (see chart below of normalized readings).
- The MCT has mostly undershot core PCE since early 2023, and offers some comfort to policymakers that underlying price dynamics remain in a disinflationary trend.
- Per the NY Fed, the MCT model "measures inflation’s persistence in the seventeen core sectors of the personal consumption expenditures (PCE) price index...[whereas core PCE] simply removes the volatile food and energy components...The MCT model seeks to further remove the transitory variation from the core sectoral inflation rates. This has been key in understanding inflation developments in recent years because, during the pandemic, many core sectors (motor vehicles and furniture, for example) were hit by unusually large transitory shocks. An ideal measure of inflation persistence should filter those out."
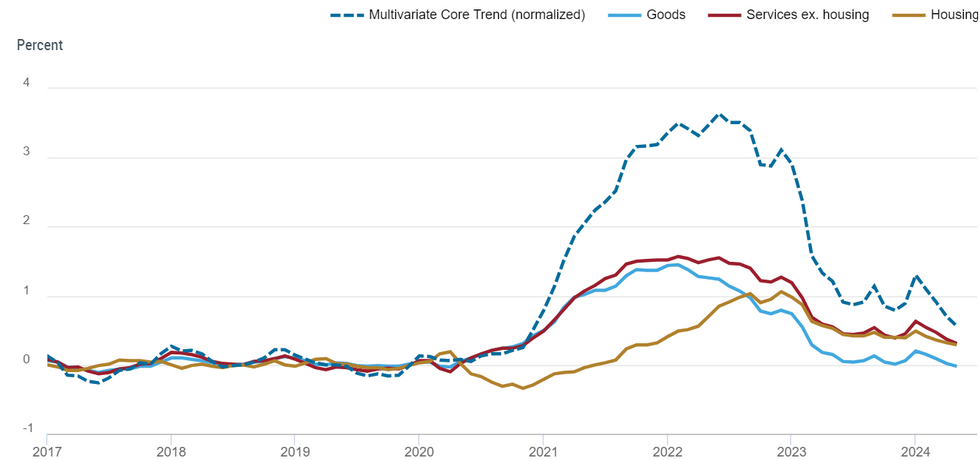 Source: NY Fed
Why MNI
MNI is the leading provider
of intelligence and analysis on the Global Fixed Income, Foreign Exchange and Energy markets. We use an innovative combination of real-time analysis, deep fundamental research and journalism to provide unique and actionable insights for traders and investors. Our "All signal, no noise" approach drives an intelligence service that is succinct and timely, which is highly regarded by our time constrained client base.Our Head Office is in London with offices in Chicago, Washington and Beijing, as well as an on the ground presence in other major financial centres across the world.
We are facing technical issues, please contact our team.
ok
Your request was sent sucessfully! Our team will contact you soon.
ok