
Why MNI
MNI is the leading provider
of intelligence and analysis on the Global Fixed Income, Foreign Exchange and Energy markets. We use an innovative combination of real-time analysis, deep fundamental research and journalism to provide unique and actionable insights for traders and investors. Our "All signal, no noise" approach drives an intelligence service that is succinct and timely, which is highly regarded by our time constrained client base.Our Head Office is in London with offices in Chicago, Washington and Beijing, as well as an on the ground presence in other major financial centres across the world.
GBP/SGD is poised to register its fourth straight month of gains, after breaching the 50-MMA & the SGD1.8000 mark during its current winning streak seen on the monthly chart. The rate has been chewing into last September's dip and it is now narrowing in on key resistance from Mar/Sep 2020 highs of SGD1.8292/1.8303, located just above the 76.4% recovery of the Apr 2018 - Mar 2020 sell-off at SGD1.8283. A clean break above these levels would entail the formation of a double-bottom pattern, creating potential for a firmer upswing towards the 23.6% retracement of the Jul 2008 - Oct 2016 slide/Apr 2018 high at SGD1.8745/1.8816, with the 100-MMA coming up next at SGD1.8913.
- On the daily chart, GBP/SGD remains in an uptrend since Sep 2020, but has struggled to stage an attack at the SGD1.8200 figure. The rejection of SGD1.8191 last Friday, the level which capped gains the day before, heralded the formation of a hammer candlestick. A firm sell-off today would confirm the bearish signal sent by that pattern, bringing Jan 18 low of SGD1.8029 into play. Next support is located at SGD1.7963/1.7958, which represent channel floor/50-DMA. On the topside, a break above SGD1.8191 would expose Sep 1 2020 high of SGD1.8303, a key near-term resistance.
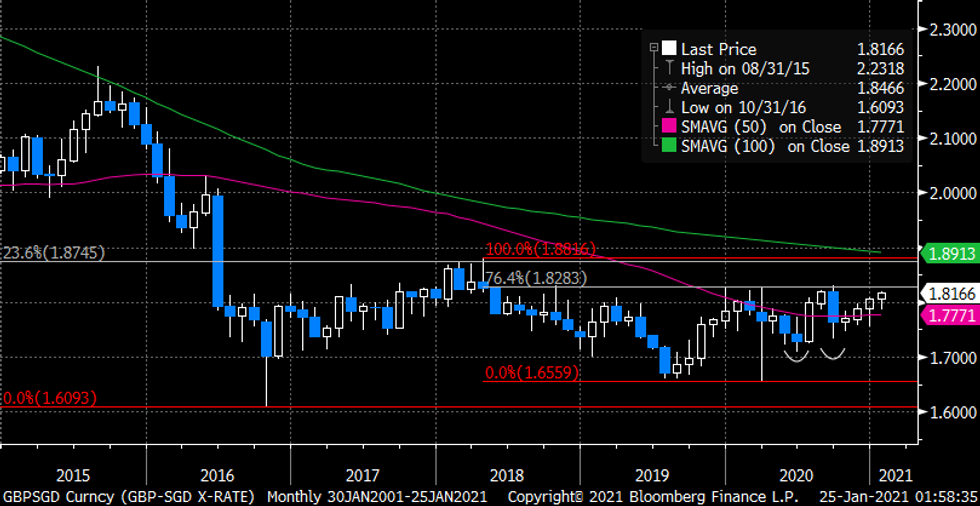 GBP/SGD Monthly Chart
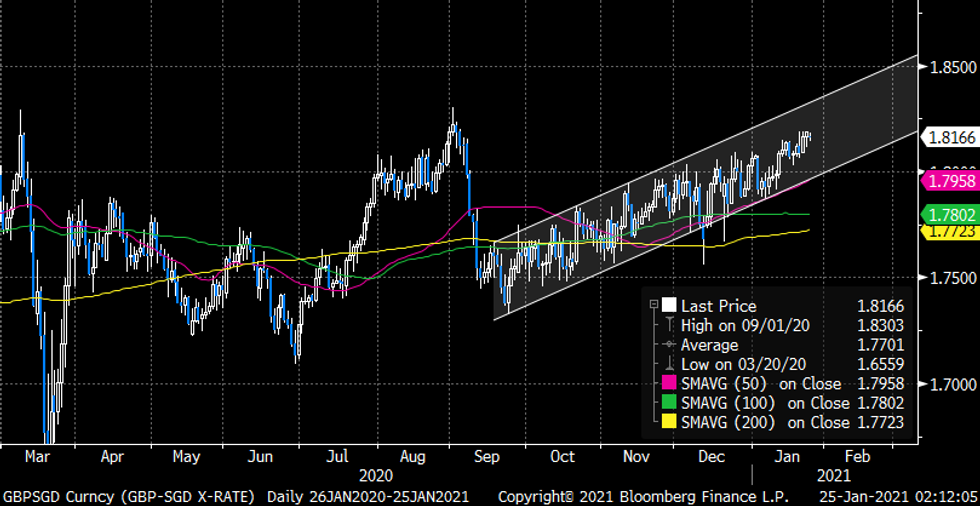 GBP/SGD Daily Chart
Why MNI
MNI is the leading provider
of intelligence and analysis on the Global Fixed Income, Foreign Exchange and Energy markets. We use an innovative combination of real-time analysis, deep fundamental research and journalism to provide unique and actionable insights for traders and investors. Our "All signal, no noise" approach drives an intelligence service that is succinct and timely, which is highly regarded by our time constrained client base.Our Head Office is in London with offices in Chicago, Washington and Beijing, as well as an on the ground presence in other major financial centres across the world.