-
Policy
Policy
Exclusive interviews with leading policymakers that convey the true policy message that impacts markets.
LATEST FROM POLICY: -
EM Policy
EM Policy
Exclusive interviews with leading policymakers that convey the true policy message that impacts markets.
LATEST FROM EM POLICY: -
G10 Markets
G10 Markets
Real-time insight on key fixed income and fx markets.
Launch MNI PodcastsFixed IncomeFI Markets AnalysisCentral Bank PreviewsFI PiFixed Income Technical AnalysisUS$ Credit Supply PipelineGilt Week AheadGlobal IssuanceEurozoneUKUSDeep DiveGlobal Issuance CalendarsEZ/UK Bond Auction CalendarEZ/UK T-bill Auction CalendarUS Treasury Auction CalendarPolitical RiskMNI Political Risk AnalysisMNI Political Risk - US Daily BriefMNI Political Risk - The week AheadElection Previews -
Emerging Markets
Emerging Markets
Real-time insight of emerging markets in CEMEA, Asia and LatAm region
-
Commodities
-
Credit
Credit
Real time insight of credit markets
-
Data
-
Global Macro
Global Macro
Actionable insight on monetary policy, balance sheet and inflation with focus on global issuance. Analysis on key political risk impacting the global markets.
Global MacroDM Central Bank PreviewsDM Central Bank ReviewsEM Central Bank PreviewsEM Central Bank ReviewsBalance Sheet AnalysisData AnalysisEurozone DataUK DataUS DataAPAC DataInflation InsightEmployment InsightGlobal IssuanceEurozoneUKUSDeep DiveGlobal Issuance Calendars EZ/UK Bond Auction Calendar EZ/UK T-bill Auction Calendar US Treasury Auction Calendar Global Macro Weekly -
About Us
To read the full story
Sign up now for free trial access to this content.
Please enter your details below.
Why MNI
MNI is the leading provider
of intelligence and analysis on the Global Fixed Income, Foreign Exchange and Energy markets. We use an innovative combination of real-time analysis, deep fundamental research and journalism to provide unique and actionable insights for traders and investors. Our "All signal, no noise" approach drives an intelligence service that is succinct and timely, which is highly regarded by our time constrained client base.Our Head Office is in London with offices in Chicago, Washington and Beijing, as well as an on the ground presence in other major financial centres across the world.
Real-time Actionable Insight
Get the latest on Central Bank Policy and FX & FI Markets to help inform both your strategic and tactical decision-making.
Free AccessMNI POLITICAL RISK - Trump Announces Raft Of Key Nominations
BRIEF: EU-Mercosur Deal In Final Negotiations - EC
MNI BRIEF: Limited Economic Impact Of French Crisis - EC
MNI US MARKETS ANALYSIS - Ouster of Barnier Leaves Little Dent
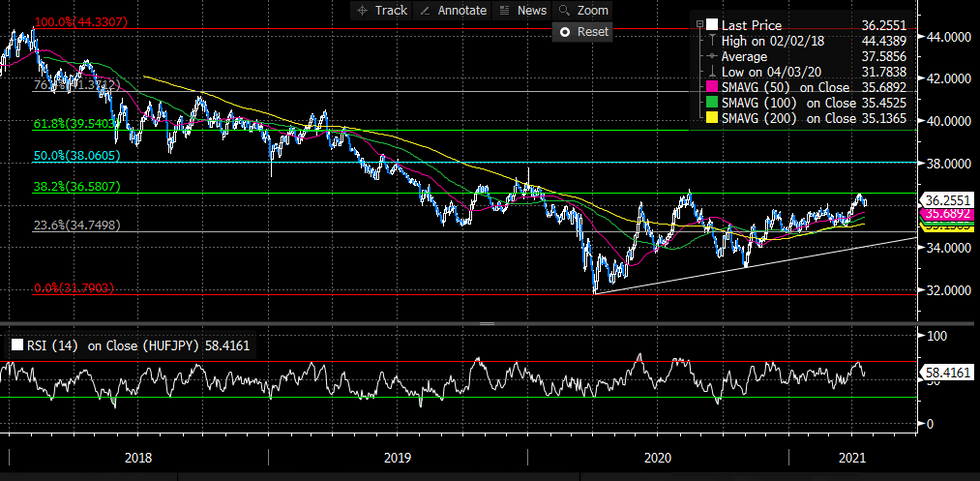
Technical Analysis: Key Resistance on HUFJPY at 36.58 (38.2% Fibo)
- USDHUF continues to trade sideways between its 100D SMA and 50D SMA; the pair is currently testing its 299 support (100D SMA), a break below that level would open the door for a move down to 295. On the topside, first resistance stands at 302.86 (50 SMA), followed by 305.
- GBPHUF has been trending higher in the past week and is currently testing its 50D SMA at 420; next resistance on the topside stands at 427.50; on the downside, first important support stands at 410 (100D SMA).
- CZKHUF continues to trend higher after breaking above its 50D SMA on Friday; first resistance to watch stands at 14, followed by 14.15 (March 22 high). On the downside, important supports to watch stand at 13.81 (100D SMA), followed by 13.61 (200D SMA).
- CZKPLN ticked higher this morning after testing its 50D SMA at 0.1752 several times in the past few days; first resistance to watch on the topside stands at 0.1772, followed by 0.1791. On the downside, key support to watch (after 50D SMA) stands at 0.1737 (100D SMA).
- HUFJPY ticked higher this morning after failing to break below its 36 support level following a little consolidation in the past week; resistance to watch on the topside stands at 37. On the downside, next support to watch after 36 stands at 35.69. (Scale *100)
- HUFJPY LT Chart: the chart below shows that another key resistance to watch on the pair in the short term is 36.58, which corresponds to the 38.2% Fibonacci retracement of the 31.79 – 44.33 high-low range. This resistance was already rejected twice; the first time was in August 2020 and the second time last week. We can also notice that the 100D SMA and 200D SMA have been acting a strong support lines since the start of the year.

Source: Bloomberg/MNI
To read the full story
Sign up now for free trial access to this content.
Please enter your details below.
Why MNI
MNI is the leading provider
of intelligence and analysis on the Global Fixed Income, Foreign Exchange and Energy markets. We use an innovative combination of real-time analysis, deep fundamental research and journalism to provide unique and actionable insights for traders and investors. Our "All signal, no noise" approach drives an intelligence service that is succinct and timely, which is highly regarded by our time constrained client base.Our Head Office is in London with offices in Chicago, Washington and Beijing, as well as an on the ground presence in other major financial centres across the world.
