
Free Trial
Why MNI
MNI is the leading provider
of intelligence and analysis on the Global Fixed Income, Foreign Exchange and Energy markets. We use an innovative combination of real-time analysis, deep fundamental research and journalism to provide unique and actionable insights for traders and investors. Our "All signal, no noise" approach drives an intelligence service that is succinct and timely, which is highly regarded by our time constrained client base.Our Head Office is in London with offices in Chicago, Washington and Beijing, as well as an on the ground presence in other major financial centres across the world.
US
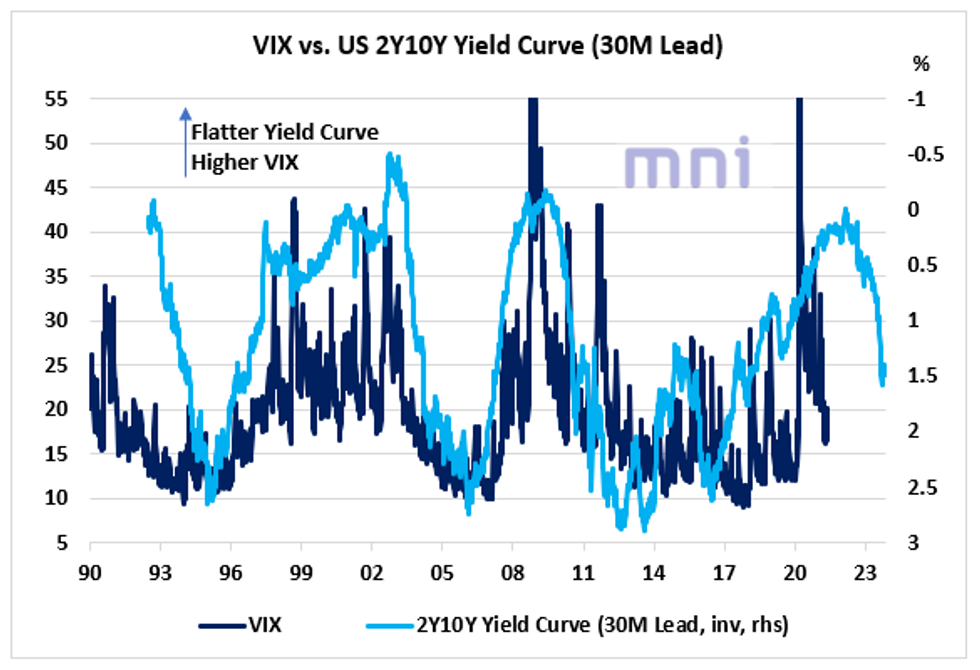
- In the past few decades, we have seen that the US 2Y10Y yield curve has acted a strong leading indicator of asset prices, and economists have been using it as one of the key inputs when computing a real-time measure of economic activity.
- This chart shows that the 2Y10Y has consistently led market's price volatility by 30 months; a flatter yield curve has usually been associated with a rise in VIX in the next 2 to 3 years.
- Even though the Covid19 pandemic was completely an exogenous shock to the market in 2020, the flattening of the yield curve in 2019 (with 2Y10Y quickly dropping below 0 in August 2019) was already pricing in a rise in market volatility.
- However, while global assets have recovered sharply since April 2020 with US equities constantly reaching new record highs, price volatility has remained elevated with the VIX failing to trade below 20 for too long (10 used to be the ancient 'low-vol' regime).
- For investors still expecting the US yield curve to steepen in the coming months as most of the DM world prepares for the global reopening, price volatility should continue to gradually decrease based on this chart.
Source: Bloomberg/MNI
Why MNI
MNI is the leading provider
of intelligence and analysis on the Global Fixed Income, Foreign Exchange and Energy markets. We use an innovative combination of real-time analysis, deep fundamental research and journalism to provide unique and actionable insights for traders and investors. Our "All signal, no noise" approach drives an intelligence service that is succinct and timely, which is highly regarded by our time constrained client base.Our Head Office is in London with offices in Chicago, Washington and Beijing, as well as an on the ground presence in other major financial centres across the world.
We are facing technical issues, please contact our team.
ok
Your request was sent sucessfully! Our team will contact you soon.
ok