-
Policy
Policy
Exclusive interviews with leading policymakers that convey the true policy message that impacts markets.
LATEST FROM POLICY: -
EM Policy
EM Policy
Exclusive interviews with leading policymakers that convey the true policy message that impacts markets.
LATEST FROM EM POLICY: -
G10 Markets
G10 Markets
Real-time insight on key fixed income and fx markets.
Launch MNI PodcastsFixed IncomeFI Markets AnalysisCentral Bank PreviewsFI PiFixed Income Technical AnalysisUS$ Credit Supply PipelineGilt Week AheadGlobal IssuanceEurozoneUKUSDeep DiveGlobal Issuance CalendarsEZ/UK Bond Auction CalendarEZ/UK T-bill Auction CalendarUS Treasury Auction CalendarPolitical RiskMNI Political Risk AnalysisMNI Political Risk - US Daily BriefMNI Political Risk - The week AheadElection Previews -
Emerging Markets
Emerging Markets
Real-time insight of emerging markets in CEMEA, Asia and LatAm region
-
Commodities
-
Credit
Credit
Real time insight of credit markets
-
Data
-
Global Macro
Global Macro
Actionable insight on monetary policy, balance sheet and inflation with focus on global issuance. Analysis on key political risk impacting the global markets.
Global MacroDM Central Bank PreviewsDM Central Bank ReviewsEM Central Bank PreviewsEM Central Bank ReviewsBalance Sheet AnalysisData AnalysisEurozone DataUK DataUS DataAPAC DataInflation InsightEmployment InsightGlobal IssuanceEurozoneUKUSDeep DiveGlobal Issuance Calendars EZ/UK Bond Auction Calendar EZ/UK T-bill Auction Calendar US Treasury Auction Calendar Global Macro Weekly -
About Us
To read the full story
Sign up now for free trial access to this content.
Please enter your details below.
Why MNI
MNI is the leading provider
of intelligence and analysis on the Global Fixed Income, Foreign Exchange and Energy markets. We use an innovative combination of real-time analysis, deep fundamental research and journalism to provide unique and actionable insights for traders and investors. Our "All signal, no noise" approach drives an intelligence service that is succinct and timely, which is highly regarded by our time constrained client base.Our Head Office is in London with offices in Chicago, Washington and Beijing, as well as an on the ground presence in other major financial centres across the world.
Real-time Actionable Insight
Get the latest on Central Bank Policy and FX & FI Markets to help inform both your strategic and tactical decision-making.
Free AccessUSD/IDR Tests Sub 15600, Close To 100-day Support Zone
USD/IDR spot is down around 0.30% in the first part of dealing on Friday, last at 15605. This is just up from session lows near 15590. IDRs pot gains largely reflect IDR NDF gains through US trade on Thursday. The 1 month USD/IDR NDF is only slightly stronger in rupiah terms, last near 15620.
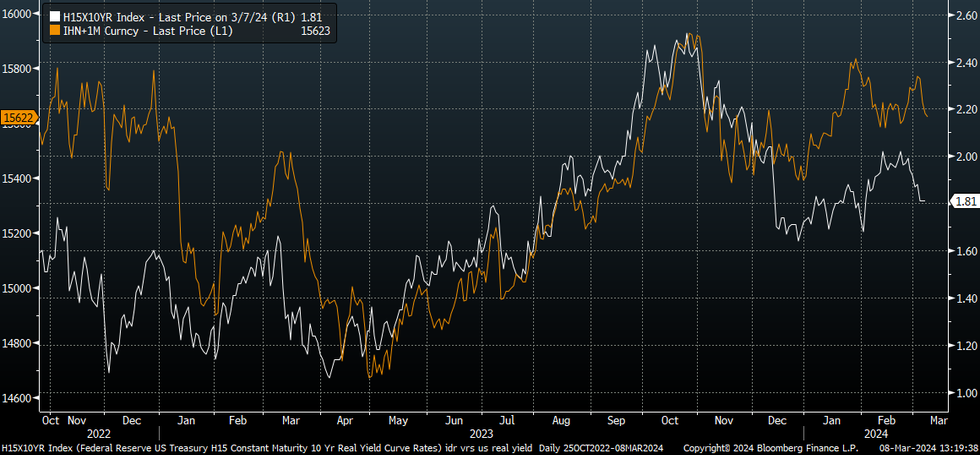
- Broadly, IDR gains in recent sessions appears to reflect some catch up with a softer US yield backdrop. The chart below plots the 1 month NDF against the US 10yr yield. The rea yield peaked back in late Feb, but month end USD demand may have delayed IDR reaction.
- Still, portfolio flows in the debt space from offshore investors have remained negative in recent sessions. Equity outflows have stabilized somewhat but are yet to turn positive for March.
- For USD/IDR spot we aren't too far away from the 100-day EMA, near 15582. We haven't been below this support level since Jan of this year. One sell-side analyst (Standard Chartered, via BBG) noted the BI may use the USD/IDR dip to replenish FX reserves. Feb FX reserves dip dip by $1bn, but sit only marginally below recent highs ($144bn).
Fig 1: USD/IDR 1 Month Versus US 10yr Real Yield

Source: MNI - Market News/Bloomberg
To read the full story
Sign up now for free trial access to this content.
Please enter your details below.
Why MNI
MNI is the leading provider
of intelligence and analysis on the Global Fixed Income, Foreign Exchange and Energy markets. We use an innovative combination of real-time analysis, deep fundamental research and journalism to provide unique and actionable insights for traders and investors. Our "All signal, no noise" approach drives an intelligence service that is succinct and timely, which is highly regarded by our time constrained client base.Our Head Office is in London with offices in Chicago, Washington and Beijing, as well as an on the ground presence in other major financial centres across the world.
