
Why MNI
MNI is the leading provider
of intelligence and analysis on the Global Fixed Income, Foreign Exchange and Energy markets. We use an innovative combination of real-time analysis, deep fundamental research and journalism to provide unique and actionable insights for traders and investors. Our "All signal, no noise" approach drives an intelligence service that is succinct and timely, which is highly regarded by our time constrained client base.Our Head Office is in London with offices in Chicago, Washington and Beijing, as well as an on the ground presence in other major financial centres across the world.
Since the start of the year, Chinese liquidity has been tightening (based on either the credit impulse, fiscal expansion or TSF). For instance, Figure 1 shows that China Total Social Financing (TSF), a broader measure of China credit and liquidity, has been contracting sharply in the past 6 months, with the annual change in the 12M sum down from 10tr CNY in the end of 2020 to 3tr CNY in April 2021.
Figure 1
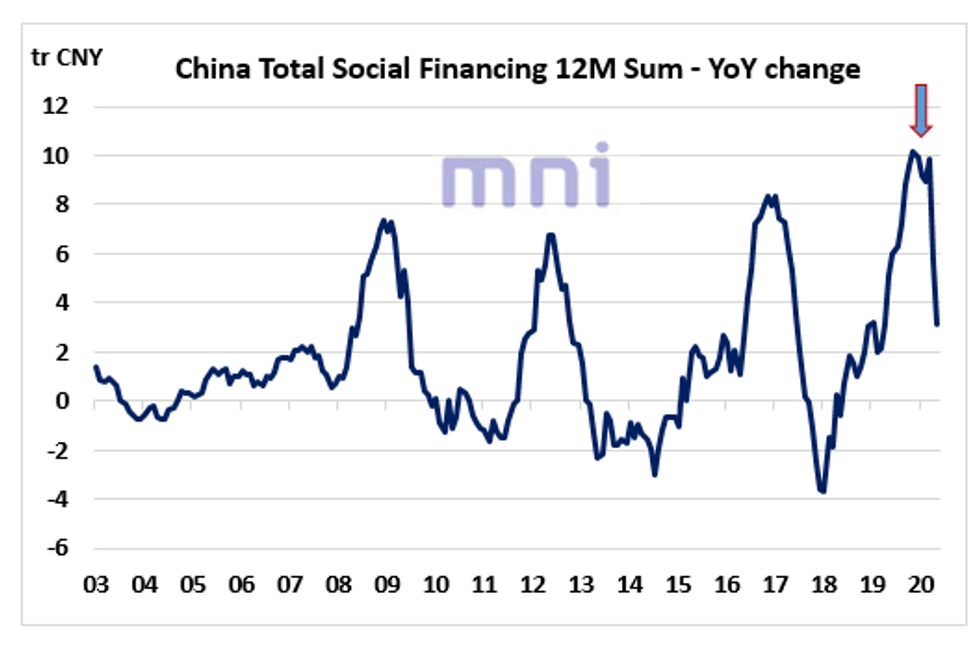
Source: Bloomberg/MNI
In the past cycle, TSF has shown strong co-movements with risk-on assets such as copper or the Australian dollar. Figure 2 shows the annual change in the 12M sum China TSF with the annual percentage change in copper prices and AUDUSD.
Figure 2
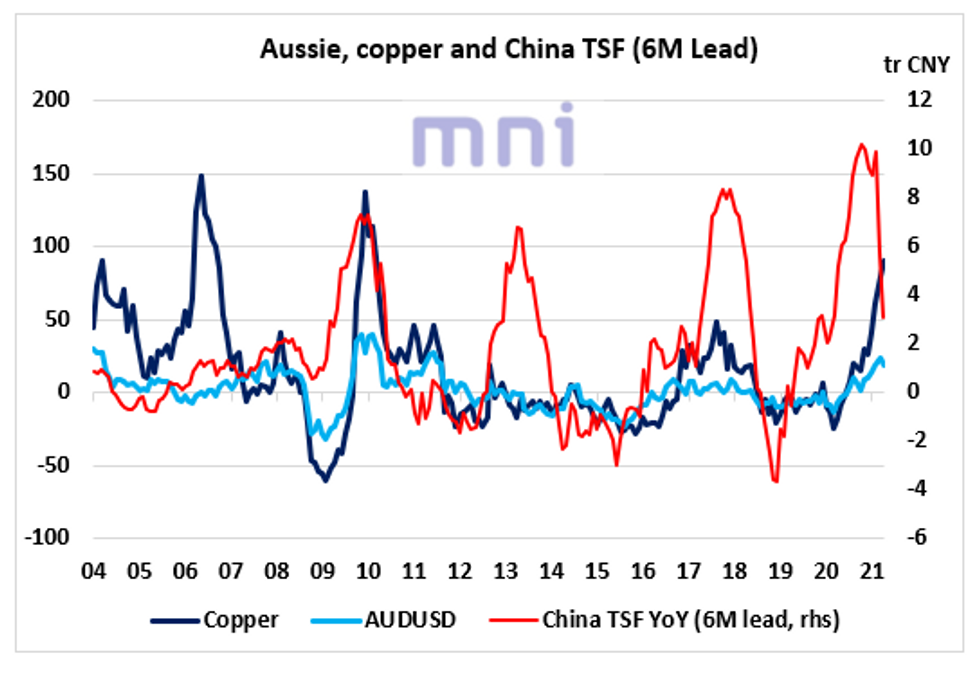
Source: Bloomberg/MNI
Tightening policy could eventually weigh on global equities in the coming months. Figure 3 shows that the China Credit Impulse has served as a good 6M leading liquidity indicator of global equities in the past cycle (MSCI world).
Figure 3
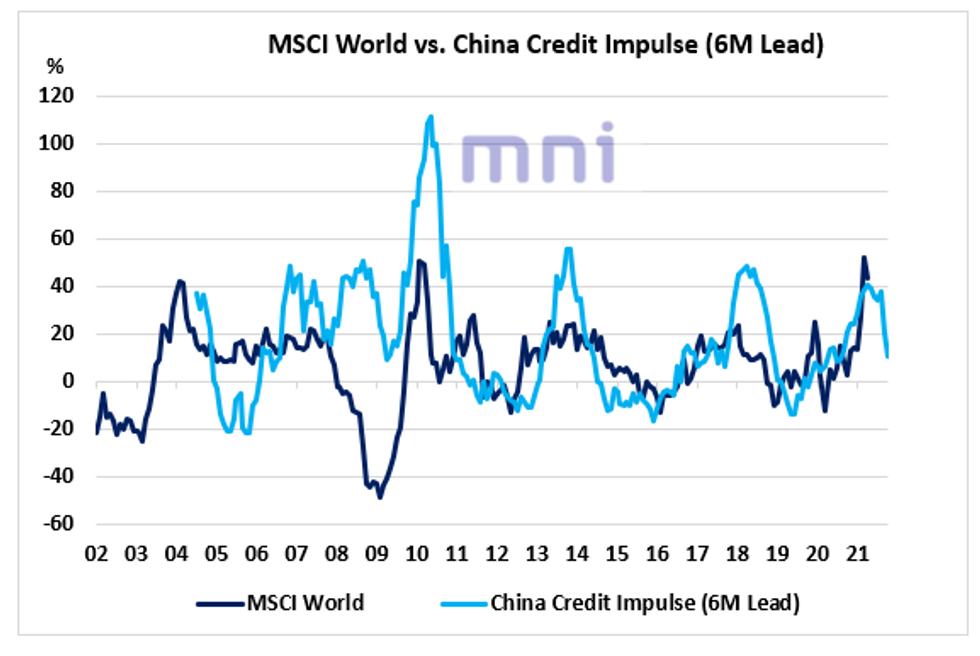
Source: Bloomberg/MNI
The China excess liquidity measure, which we proxy with the difference between real money growth and industrial production, has also been falling sharply in recent months amid rising inflationary pressures (PPI rose to 6.8% in April, highest level since Oct 2017).
Excess liquidity has also been a strong leading indicator for domestic risky assets but also international asset prices. Figure 4 shows the strong relationship between excess liquidity (6M Lead) and the Australian housing market since 2003 (and to a lesser extent the London housing market).
Figure 4
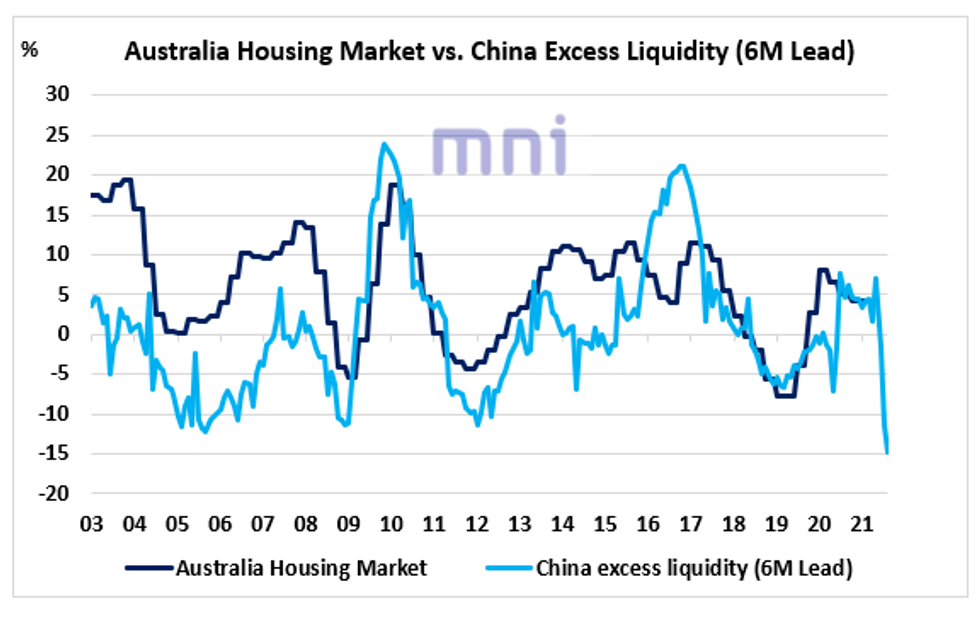
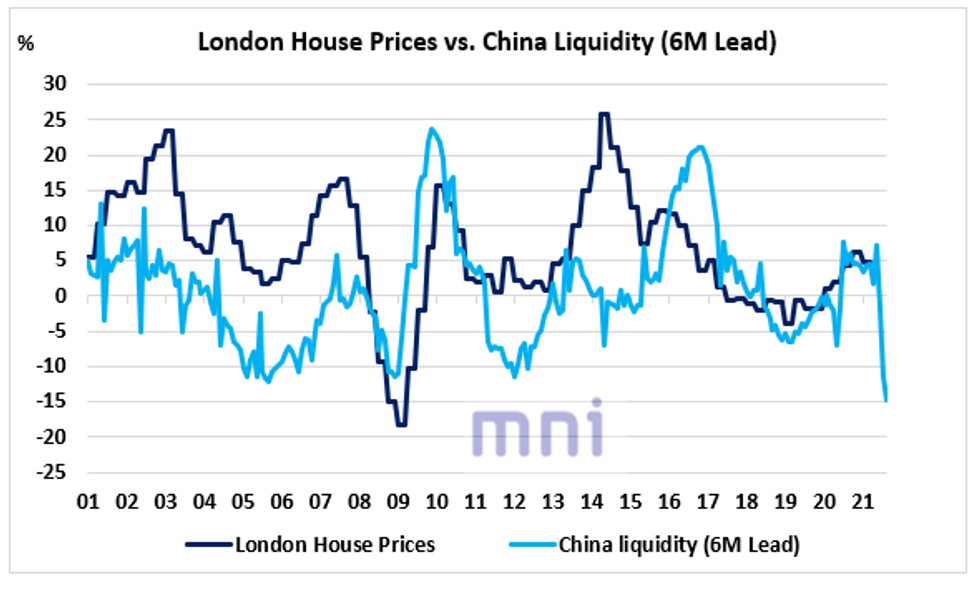
Source: Bloomberg/MNI
As a reminder, with China PPI rising to 6.8% YoY, China currently offers the lowest 10Y real yield among the EM world. We have used PPI for China when computing real yields (instead of CPI) as it shows a stronger relationship with the 10Y yield.
Figure 5
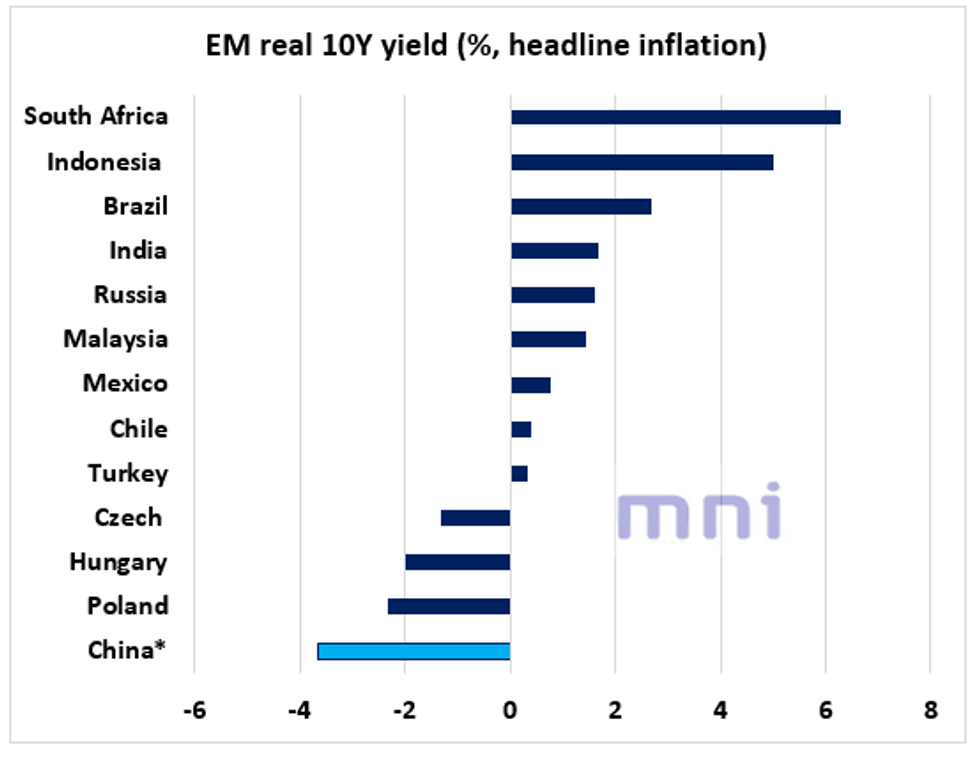
Source: Bloomberg/MNI
As this stage, the tightening of liquidity has impacted domestic internal assets, with Chinese equities down 15% since Mid February and China tech down over 30% (figure 6).
Figure 6
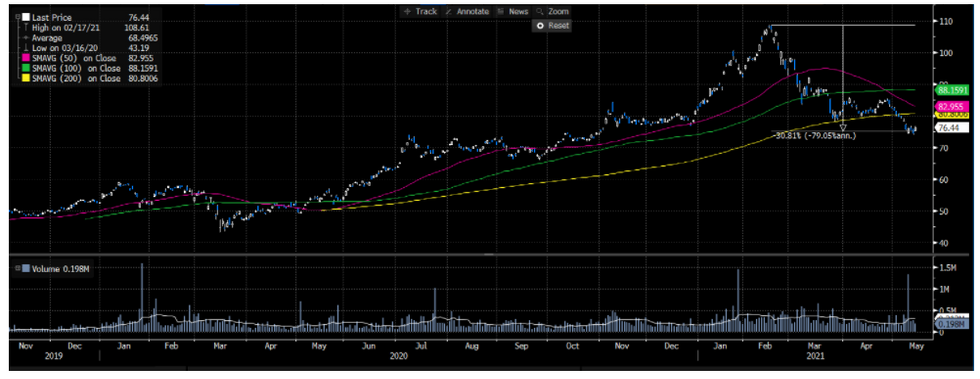
Source: Bloomberg/MNI
Why MNI
MNI is the leading provider
of intelligence and analysis on the Global Fixed Income, Foreign Exchange and Energy markets. We use an innovative combination of real-time analysis, deep fundamental research and journalism to provide unique and actionable insights for traders and investors. Our "All signal, no noise" approach drives an intelligence service that is succinct and timely, which is highly regarded by our time constrained client base.Our Head Office is in London with offices in Chicago, Washington and Beijing, as well as an on the ground presence in other major financial centres across the world.