
Free Trial
Why MNI
MNI is the leading provider
of intelligence and analysis on the Global Fixed Income, Foreign Exchange and Energy markets. We use an innovative combination of real-time analysis, deep fundamental research and journalism to provide unique and actionable insights for traders and investors. Our "All signal, no noise" approach drives an intelligence service that is succinct and timely, which is highly regarded by our time constrained client base.Our Head Office is in London with offices in Chicago, Washington and Beijing, as well as an on the ground presence in other major financial centres across the world.
Executive Summary:
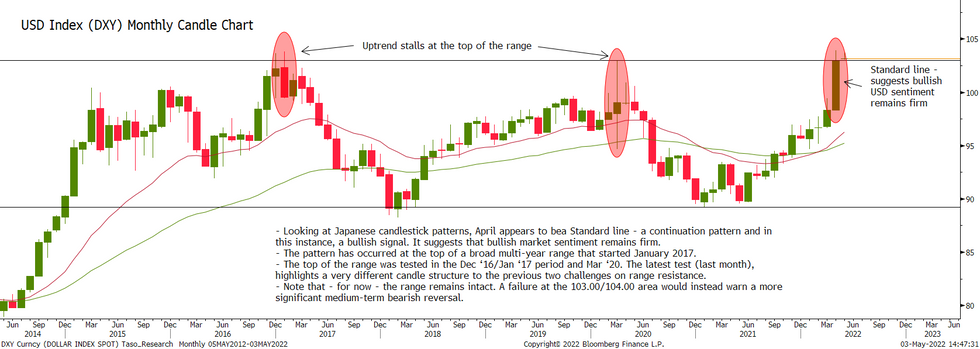
- Looking at the USD Index monthly Japanese candlestick chart, April appears to be a Standard line - a continuation pattern and in this instance, a bullish signal.
- The pattern has occurred at the top of a broad multi-year range that started January 2017.
- It suggests resistance at the 103.00/104.00 area remains vulnerable.
The USD is in a clear uptrend and this was reinforced in April. The bull theme is clearly highlighted in the USD Index (DXY) chart. A number of important technical factors are evident on the monthly frequency:
- Looking at Japanese candlestick patterns, April appears to be a Standard line. This is a pattern where the body - area between the open and close - is significantly large. Furthermore, the open is closer to the low of the session and the close, is at or near, the high of the candle. A standard line is a continuation pattern and in this instance, a bullish signal. It suggests that bullish sentiment remains firm.
- The pattern has occurred at the top of a broad multi-year range that started January 2017. In the chart below, the range clearly highlights areas of key support in the 89.00 region, and resistance around 1.0300 - the range parameters.
- The top of the range was tested in the Dec ‘16/Jan ‘17 period and in Mar ‘20. The latest test (last month), highlights a very different candle structure to the previous two challenges on range resistance. The first two, are characterised by volatile activity which, typically, following a trend, is a reversal signal. The Index did indeed reverse and eventually traded down to the base of the range. Last month’s bullish candle paints a different picture. A standard line highlights a strong uptrend and suggests that bullish sentiment remains firm. Key resistance at 103.00/104.00 - for now - appears vulnerable.
- Note however that the range remains intact. A failure at the 103.00/104.00 area would instead warn of a more significant medium-term bearish reversal.
Why MNI
MNI is the leading provider
of intelligence and analysis on the Global Fixed Income, Foreign Exchange and Energy markets. We use an innovative combination of real-time analysis, deep fundamental research and journalism to provide unique and actionable insights for traders and investors. Our "All signal, no noise" approach drives an intelligence service that is succinct and timely, which is highly regarded by our time constrained client base.Our Head Office is in London with offices in Chicago, Washington and Beijing, as well as an on the ground presence in other major financial centres across the world.
We are facing technical issues, please contact our team.
ok
Your request was sent sucessfully! Our team will contact you soon.
ok