
Why MNI
MNI is the leading provider
of intelligence and analysis on the Global Fixed Income, Foreign Exchange and Energy markets. We use an innovative combination of real-time analysis, deep fundamental research and journalism to provide unique and actionable insights for traders and investors. Our "All signal, no noise" approach drives an intelligence service that is succinct and timely, which is highly regarded by our time constrained client base.Our Head Office is in London with offices in Chicago, Washington and Beijing, as well as an on the ground presence in other major financial centres across the world.
Gold: Giving Mixed Signals, But Technical Trend Looks Firm
In mid-April, we highlighted a potential bullish reversal in Gold that suggested the yellow metal was likely to appreciate near-term.
- The key reversal signal was marked by a double bottom formation that started Mar 8 and was confirmed Apr 8 and 15. The double bottom suggested market sentiment was moving away from the bearish mood that has seen price drop from $1959.4 to $1676.9 between Jan 6 and Mar 8.
- The significance of the pattern was reinforced by the fact that the base coincided with the low end of a bear channel drawn off the Aug 7 2020 high.
- Subsequent price action saw price climb, eventually achieving the double bottom objective of $1834.1 on May 7.
- Recent gains above $1900.00 suggest potential for an extension towards $1959.4, the Jan 6 high. This would mark a full retracement of the last bear cycle.
- The trend is overbought however until a reversal signal in price is confirmed, it is a condition that will be monitored and currently does not appear to be a threat to bulls.
- Key near-term trend support has been defined at $1808.9, May 13 low.

Global liquidity remains a key driver for Gold
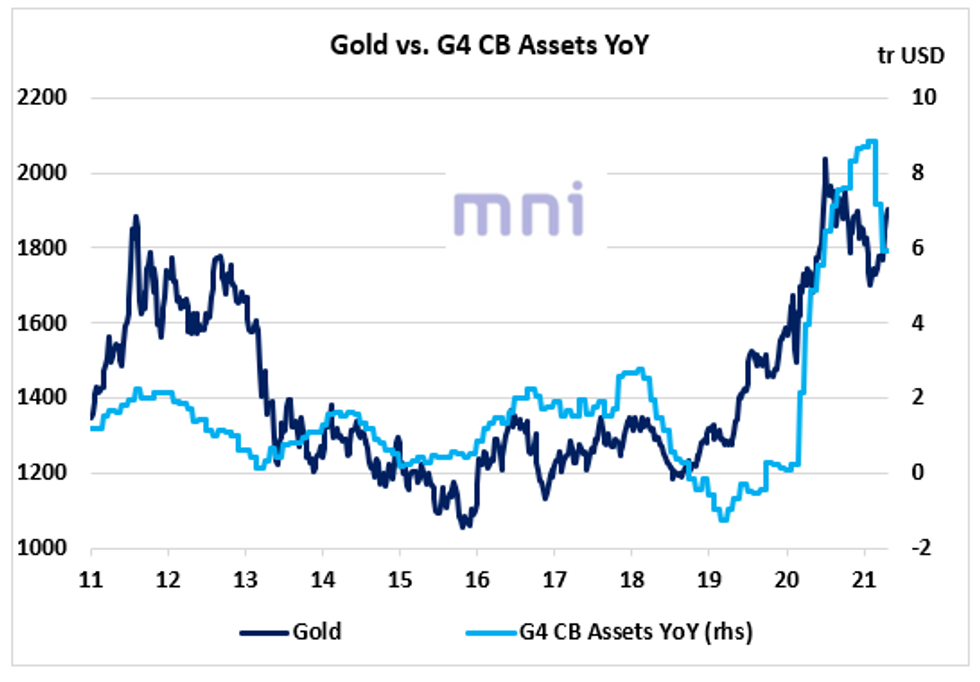
In the past cycle, global liquidity has been one of the major drivers of gold; global liquidity is defined as the total assets of the G4 central banks (Fed, ECB, BoJ and PBoC).
Figure 1 shows the strong co-movement between Gold prices and the annual change in CBs assets; the deceleration of the annual change in CBs assets could have explained part of the Gold weakness in H2 2020 and Q1 2021.
Figure 1
Source: Bloomberg/MNI
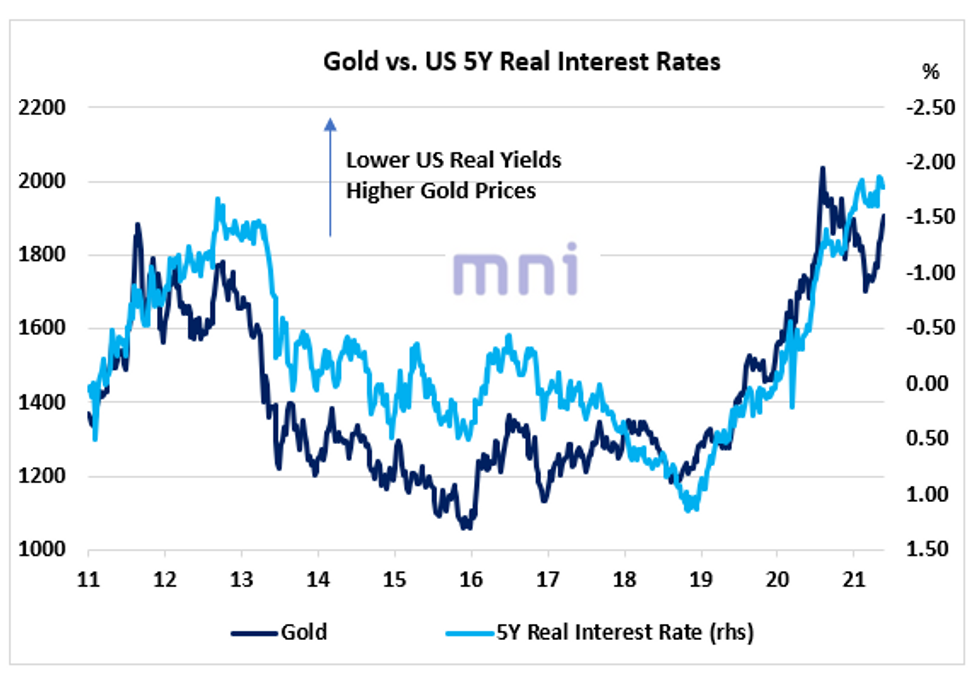
On the other hand, US real rates have remained low (-1.8%) and have been pricing in higher gold prices in recent months; figure 2 shows that 5Y US real rates have been a strong driver of gold prices in past cycle.
If we regress the weekly changes in gold prices on the weekly changes in the 5Y TIPS (since January 2010), we find that a 1ppt increase in US 5Y real is associated with a 8.3% fall in gold prices.
Figure 2
Source: Bloomberg/MNI
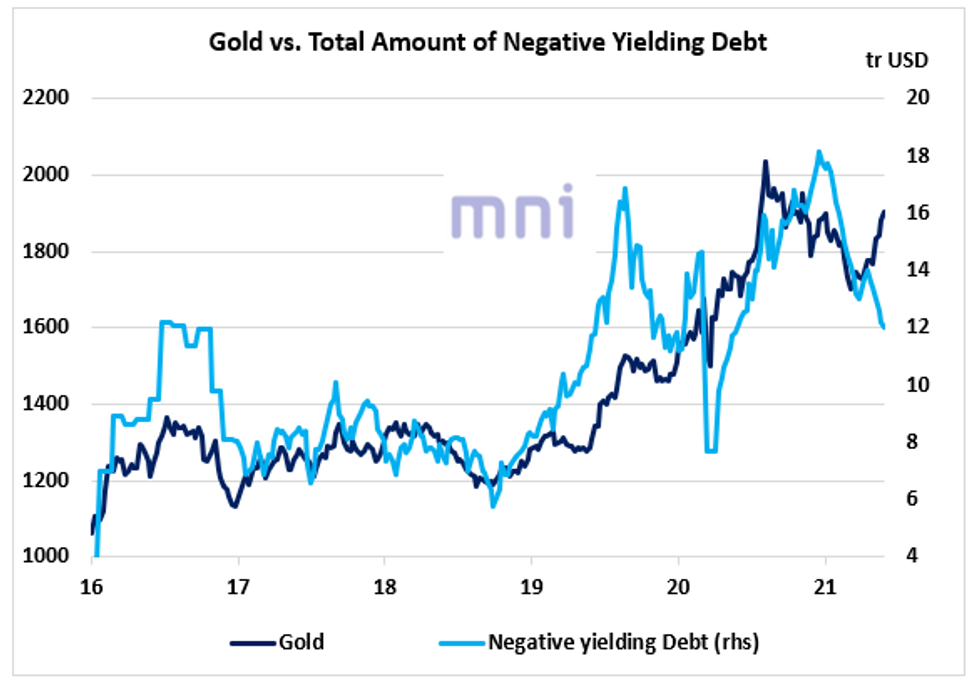
The total amount of negative yielding debt, which could be seen as a global measure of fear in the market, has also co-moved strongly with gold prices in recent years. Negative yielding debt rose significantly between March 2020 and early January 2021,from 8tr to 18tr USD (strongly supporting gold), before starting to ease this year.
Figure 3 shows that the two times series have started to diverge in recent weeks, with gold prices trending higher and negative yielding debt constantly reaching new lows (12tr USD at the moment).
Figure 3
Source: Bloomberg/MNI
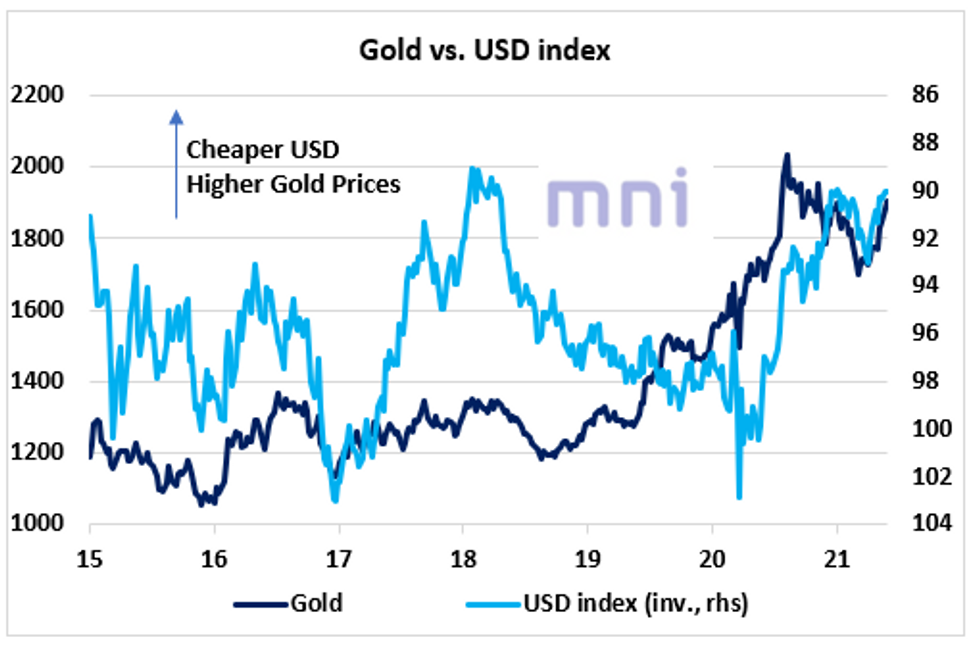
As expected, gold tends to show a negative relationship with the US Dollar index. Periods when both Gold and USD index are rising simultaneously are seen as strong risk-off sentiment, risky assets usually perform poorly during those times.
Figure 4
Source: Bloomberg/MNI
Gold, a hedge against inflation, uncertainty and market shocks
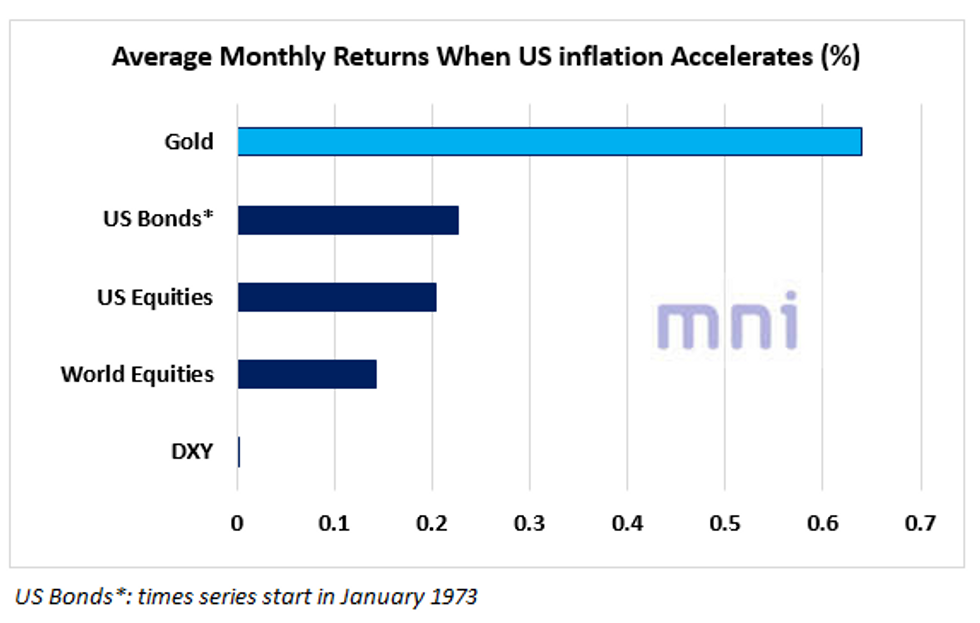
Empirical research has shown that gold serves as a good hedge against inflation in the long run; figure 5 shows that gold has outperformed all other major asset classes when inflation accelerates in the US.
The chart below shows the average monthly performance of all major asset classes (Gold, US equities, US bonds, US Dollar and World Equities) when inflation accelerates (i.e. when the 1-year change in the inflation rate is positive) since January 1971; gold is by far the best performer, with the precious metal rising by 0.64% when inflation is accelerating.
Figure 5
Source: Bloomberg/MNI
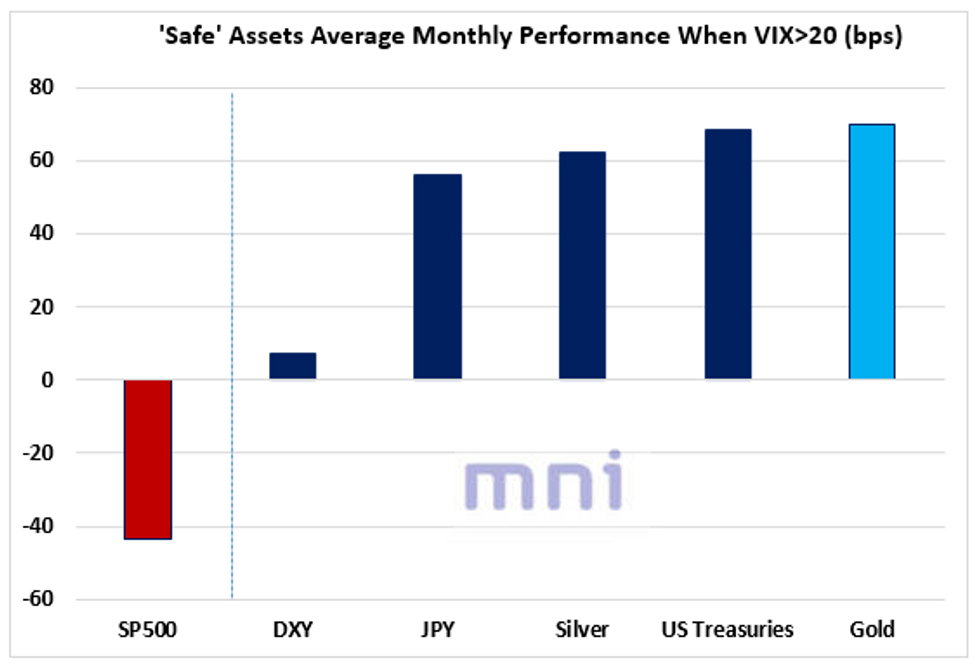
In addition, gold has also been defined as a 'zero-beta asset', which tends to even appreciate in value in periods of rising uncertainty and price volatility.
This chart shows the performance of major 'safe' assets when VIX is rising (VIX > 20 in that case); once, gold is the best performer when volatility surges, averaging 70bps in monthly returns when VIX trades above 20.
Figure 6
Source: Bloomberg/MNI
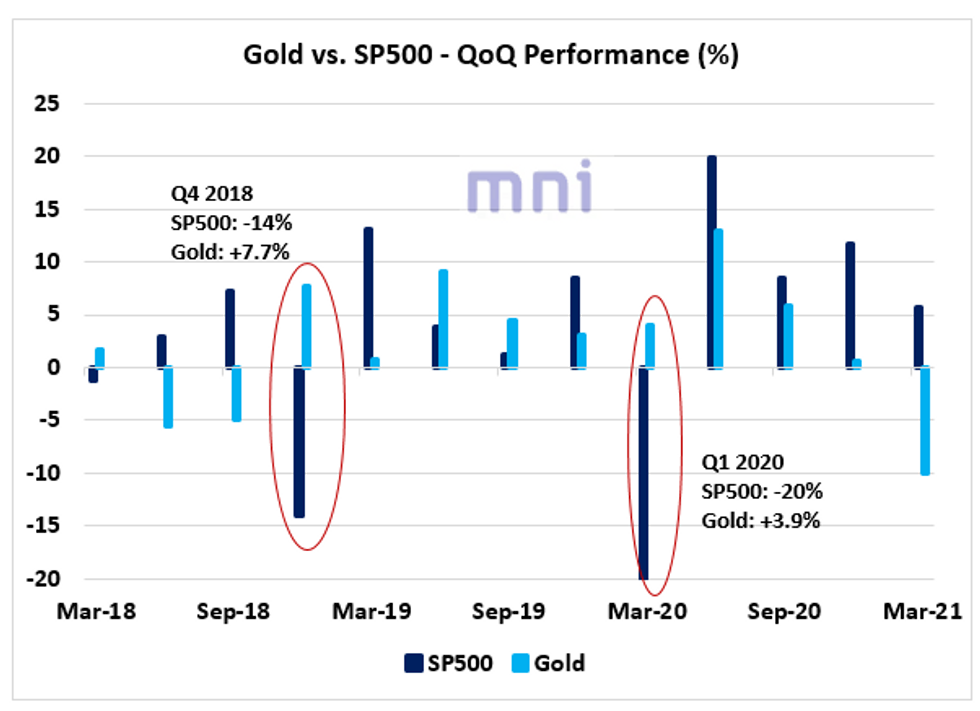
Gold serves as a hedge against equity market shocks (figure 7);
- Gold was up 7.7% in Q4 2018 when SP500 was down 14%;
- Gold was up 3.9% in Q1 2020 when SP500 plummeted by 20%.
Figure 7
Source: Bloomberg/MNI
Gold: to replace bonds in the traditional asset allocation?
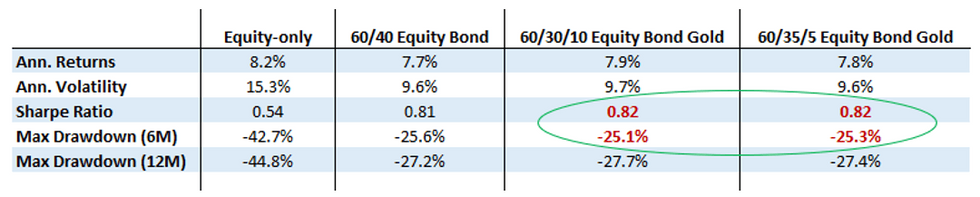
In the past few years, we have seen that an increasing number of investors have seen gold as a 'replacement of bonds' in the classic 60/40 equity bond allocation, especially now that interest rates are now close to (or at) zero in most developed economies. It is preferable to hold an asset with unlimited upside potential to optimize the expected outcome, especially if countries experience an inflationary shock following the combination of fiscal and monetary policy in the past 15 months.
This table shows the performance of the 'equity only' portfolio, the classic 60/40 equity bond portfolio and then the performance of 'alternative' portfolios when you replace 5 to 10% of bond holdings by gold, using monthly times series since January 1973.
Interestingly, investors would have generated similar returns if they have been holding 5 to 10 percent of gold instead of bonds in the past 50 years, with also similar drawdowns.
Figure 8
Source: Bloomberg/MNI
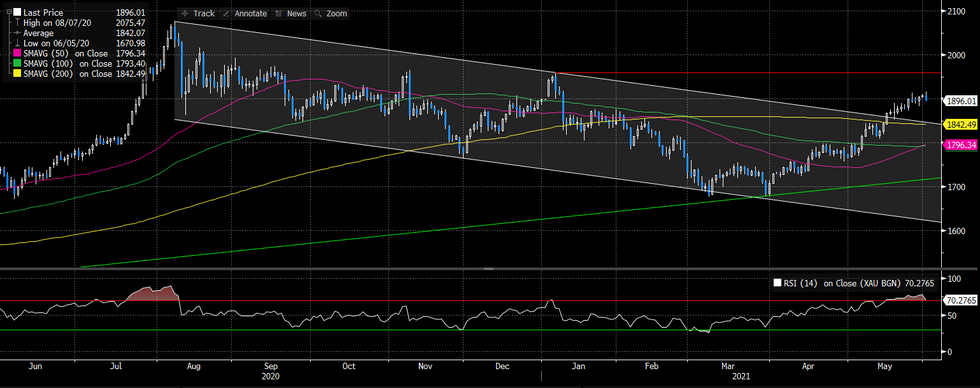
Figure 9 shows that the trend on the commodity looks firm after gold important resistances last month, first its 200D SMA (1,842) and the high of its LT downward trending channel; it is currently testing the psychological 1,900 level, next level to watch on the topside stands at 1,959 (which corresponds to Jan 6 high). RSI 14D is currently showing that the precious has been moderately 'overbought' in the past two weeks. On the downside, ST support stands at 1,872, followed by 1,842.50.
Figure 9
Source: Bloomberg/MNI
Why MNI
MNI is the leading provider
of intelligence and analysis on the Global Fixed Income, Foreign Exchange and Energy markets. We use an innovative combination of real-time analysis, deep fundamental research and journalism to provide unique and actionable insights for traders and investors. Our "All signal, no noise" approach drives an intelligence service that is succinct and timely, which is highly regarded by our time constrained client base.Our Head Office is in London with offices in Chicago, Washington and Beijing, as well as an on the ground presence in other major financial centres across the world.