
Free Trial
Why MNI
MNI is the leading provider
of intelligence and analysis on the Global Fixed Income, Foreign Exchange and Energy markets. We use an innovative combination of real-time analysis, deep fundamental research and journalism to provide unique and actionable insights for traders and investors. Our "All signal, no noise" approach drives an intelligence service that is succinct and timely, which is highly regarded by our time constrained client base.Our Head Office is in London with offices in Chicago, Washington and Beijing, as well as an on the ground presence in other major financial centres across the world.
CHINA DATA
China house price data for June showed continued m/m drops, albeit not as large as what were recorded in May. New homes fell -0.67%m/m, against a -0.71% dip in May. Used home prices were down -0.85%m/m, versus -1.00% in May (per BBG).
- Both metrics saw the sharpest m/m falls in May going back to 2014, although we still some distance from returning to positive territory., see the chart below.
- In m/m terms, for new homes, 4 cities record a rise, 2 unchanged and 64 saw a decrease (this was 68 last month). For existing homes, 66 cities saw a fall (70 last month), while 4 saw an increase.
- In terms of the larger cities, in m/m terms for new homes, Shanghai saw a +0.4% gain for June (+0.6% in May), Beijing was -0.6% (-1.1% in May), Guangzhou was -1.2% (-1.4% in May) and Shenzhen -0.7%, same as May. In y/y terms, falls accelerated for Beijing, Guangzhou and Shenzhen, but remained positive for Shanghai.
- Beijing and Shanghai saw m/m rises for existing homes.
Fig 1: China House Prices (White Line - New, Orange Line - Existing)
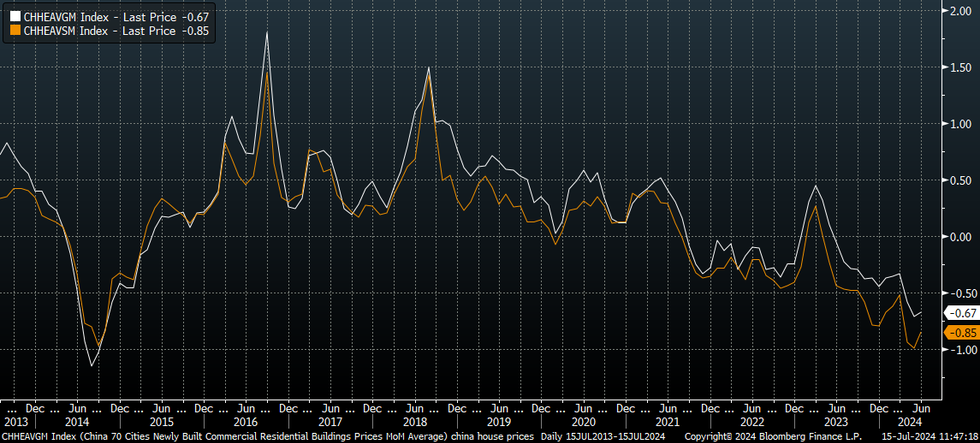
Source: MNI - Market News/Bloomberg
Why MNI
MNI is the leading provider
of intelligence and analysis on the Global Fixed Income, Foreign Exchange and Energy markets. We use an innovative combination of real-time analysis, deep fundamental research and journalism to provide unique and actionable insights for traders and investors. Our "All signal, no noise" approach drives an intelligence service that is succinct and timely, which is highly regarded by our time constrained client base.Our Head Office is in London with offices in Chicago, Washington and Beijing, as well as an on the ground presence in other major financial centres across the world.
We are facing technical issues, please contact our team.
ok
Your request was sent sucessfully! Our team will contact you soon.
ok