
Why MNI
MNI is the leading provider
of intelligence and analysis on the Global Fixed Income, Foreign Exchange and Energy markets. We use an innovative combination of real-time analysis, deep fundamental research and journalism to provide unique and actionable insights for traders and investors. Our "All signal, no noise" approach drives an intelligence service that is succinct and timely, which is highly regarded by our time constrained client base.Our Head Office is in London with offices in Chicago, Washington and Beijing, as well as an on the ground presence in other major financial centres across the world.
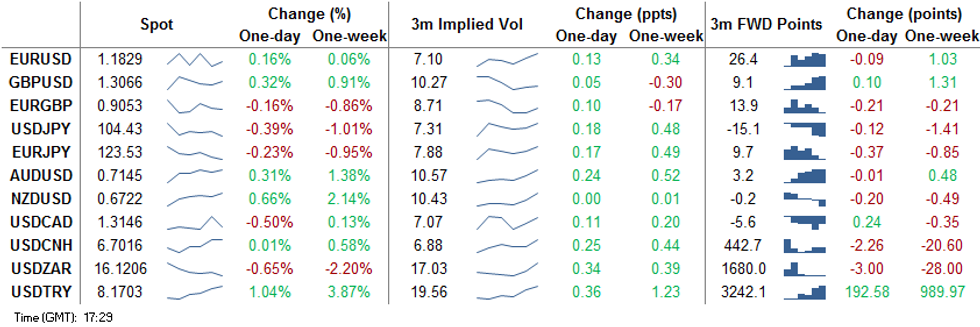
Greenback in Retreat, But Week's Lows Hold
Equities in Europe caught up with the stock sell-off Tuesday, with the EuroStoxx 50 shedding just over 1%, while US markets finished mixed. The greenback suffered Tuesday, but the USD index held above the Monday low, signalling little threat of a bearish breakout yet just yet. The 50-dma continues to cap prices at 93.281, but a break above would prove bullish for the greenback.
A bounceback for crude prices helped buoy commodity-tied FX Tuesday, resulting in CAD, NOK outperforming most others in G10, although CAD lagged slightly ahead of Wednesday's BoC decision.
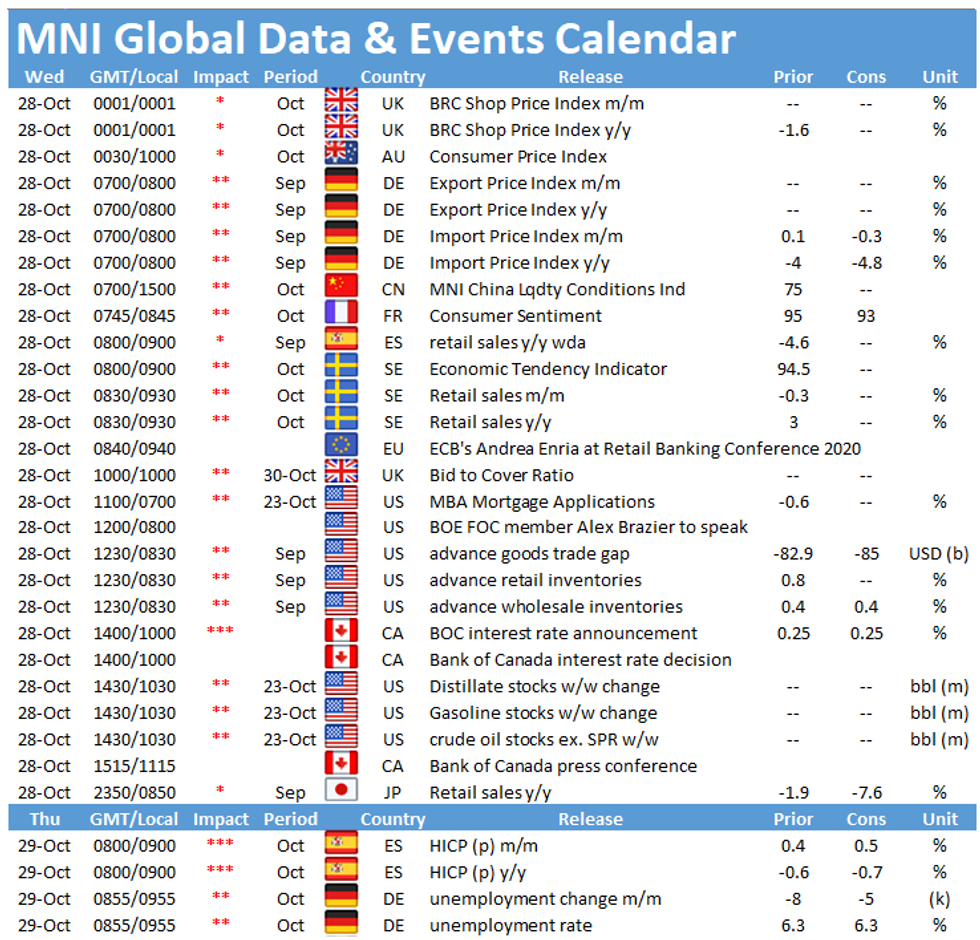
Focus Wednesday turns to Australian CPI, which is expected to swing back into positive territory after indicating sharp downside price pressures throughout Q2. The Bank of Canada rate decision is also due, with the Bank seen keeping rates unchanged at 0.25%. Earnings season continues, with Boeing, Visa & Mastercard all due.
EUR/USD TECHS: Bullish Trend Structure Remains Intact
- RES 4: 1.2011 High Sep and key resistance
- RES 3: 1.1917 Sep 10 high / 76.4% of the Sep 1 - 25 sell-off
- RES 2: 1.1904 1.0% 10-dma envelope
- RES 1: 1.1881 High Oct 21 and the bull trigger
- PRICE: 1.1834 @ 16:19 GMT Oct 27
- SUP 1: 1.1787/60 Low Oct 23 / Oct 20
- SUP 2: 1.1749 50-day EMA
- SUP 3: 1.1735 Trendline support drawn off the Sep 28 low
- SUP 4: 1.1689 Low Oct 15 and a key support
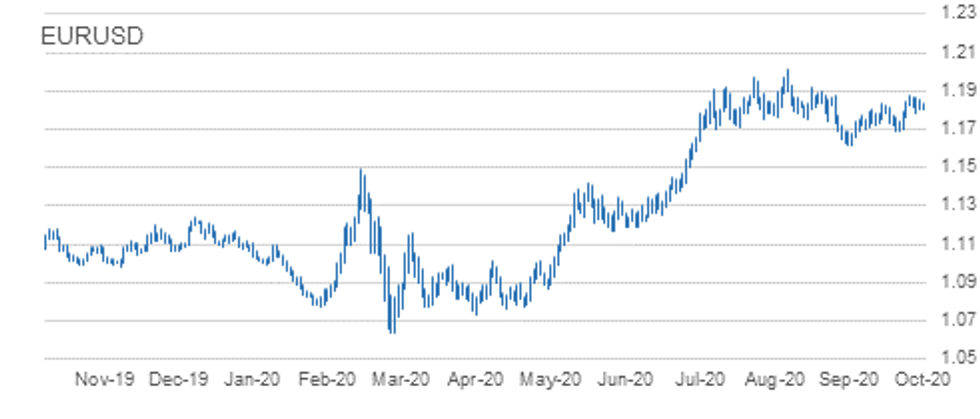
EURUSD is still trading below last week's high of 1.1881. Despite the recent shallow pullback, the outlook remains positive and the move lower is considered corrective. The recent breach of 1.1831, Oct 9 high reinforced the current bullish price structure and signals scope for 1.1917 next, a retracement level with the major resistance and hurdle for bulls at 1.2011, Sep 1 high. Key short-term trendline support is at 1.1735.
GBP/USD TECHS: Bounces Well Off Tuesday Low
- RES 4: 1.3292 76.4% retracement of the Sep 1 - 23 sell-off
- RES 3: 1.3256 2.0% 10-dma envelope
- RES 2: 1.3257 Former trendline support drawn off the Mar 20 low
- RES 1: 1.3177 High Oct 21
- PRICE: 1.3070 @ 16:20 GMT Oct 27
- SUP 1: 1.2983 20-day EMA
- SUP 2: 1.2940 Low Oct 21
- SUP 3: 1.2863 Low Oct 14 and key near-term support
- SUP 4: 1.2806 Low Sep 30
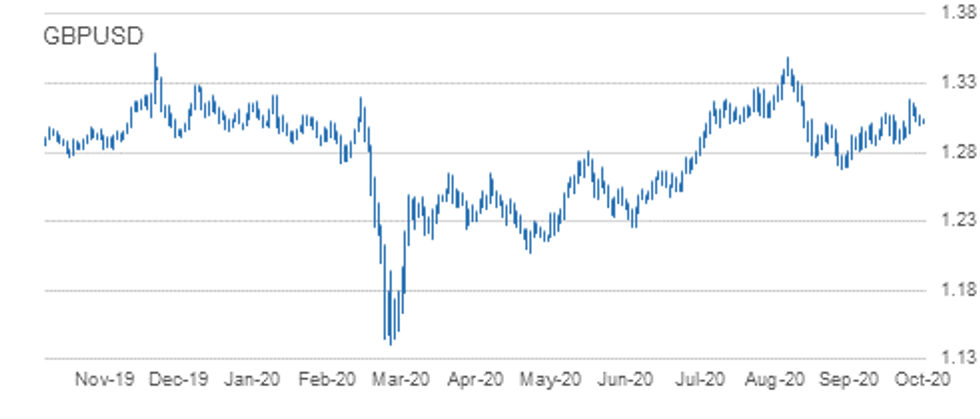
Having partially retraced the Oct 21 rally, GBP/USD bounced well Tuesday, inching above the Monday high ahead of the close. This confirms that the move lower was likely a correction, keeping the short-term bullish structure intact. The Oct 21 climb reinforced a bullish theme, confirming a resumption of the upleg that started Sep 23. Attention is on 1.3257, the former trendline support drawn off the Mar 20 low. The trendline was breached on Sep 9. Firm support is at 1.2940, Oct 21 low. The reversal trigger lies at 1.2863, Oct 14 low.
EUR/GBP TECHS: Choppy And Trading Above Support
- RES 4: 0.9220 High Sep 22
- RES 3: 0.9160/62 1.0% 10-dma envelope / High Oct 7
- RES 2: 0.9149 Oct 20 high
- RES 1: 0.9107 High Oct 23
- PRICE: 0.9052 @ 16:25 GMT Oct 27
- SUP 1: 0.9012 Low Oct 21
- SUP 2: 0.9007 Low Oct 14 and the bear trigger
- SUP 3: 0.8967 76.4% retracement of the Sep 3 - 11 rally
- SUP 4: 0.8925 Low Sep 7
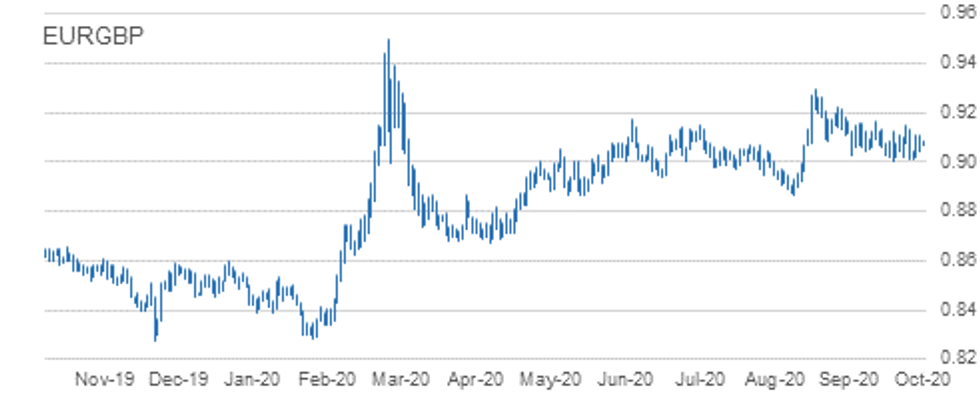
EURGBP maintains a choppy tone. The outlook is still bearish though following the sharp sell-off on Oct 21. Attention is on support at 0.9007, Oct 14 low and the near-term bear trigger. A break of 0.9007 would confirm a resumption of the downtrend that started Sep 11 and expose 0.8967, a retracement point. Key S/T resistance has been defined at 0.9149, Oct 20 high. Clearance of this level would undermine bearish conditions.
USD/JPY TECHS: Consolidating But Outlook Remains Bearish
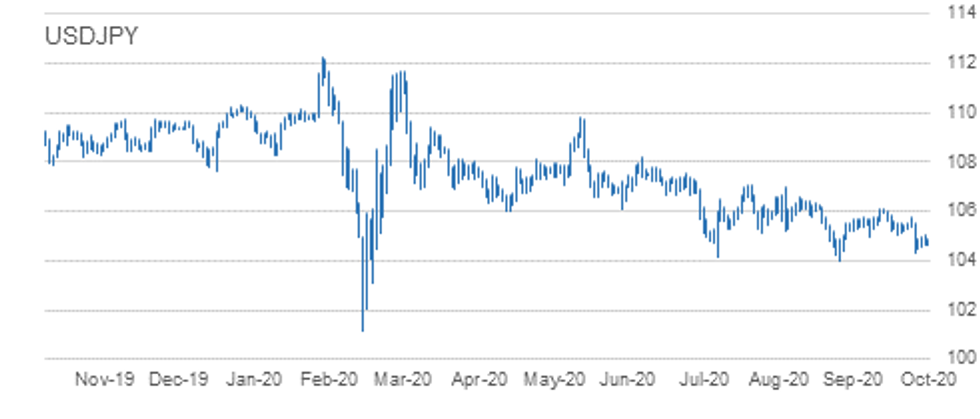
- RES 4: 106.11 High Oct 7 and key resistance
- RES 3: 105.75 High Oct 20
- RES 2: 105.53/60 High Oct 21 / 50-dma
- RES 1: 105.06 High Oct 26
- PRICE: 104.61 @ 16:26 GMT Oct 27
- SUP 1: 104.34 Low Oct 21
- SUP 2: 104.00 Low Sep 21 and the bear trigger
- SUP 3: 103.67 76.4% retracement of the Mar 9 - 24 rally
- SUP 4: 103.09 Low Mar 12
USDJPY is still trading within its recent range. The outlook remains bearish though following the Oct 21 sell-off and the resumption of the downleg from 106.11, Oct 7 high. A number of important supports have been cleared exposing the key 104.00 handle, Sep 21 low. A break of 104.00 would suggest scope for a deeper USD depreciation within the bear channel drawn off the Mar 24 high. Initial resistance is at 105.04.
EUR/JPY TECHS: Key near-Term Supports Remain Intact
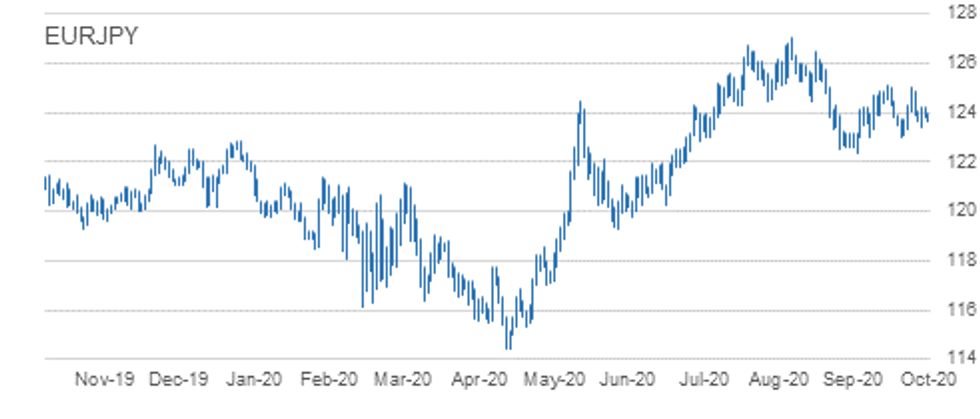
- RES 4: 125.97 76.4% retracement of the Sep 1 - 28 sell-off
- RES 3: 125.28 61.8% of the Sep 1 - 28 sell-off
- RES 2: 125.00/09 High Oct 20 and Oct 9
- RES 1: 124.23 High Oct 23 and 26
- PRICE: 123.56 @ 16:28 GMT Oct 27
- SUP 1: 123.41 Low Oct 23
- SUP 2: 123.03/02 Low Sep 29 and Oct 2 / Low Oct 15
- SUP 3: 122.38/28 Low Sep 28 / 61.8% of the Jun 22 - Sep 1 rally
- SUP 4: 122.25 38.2% retracement of the May - Sep rally
EURJPY is still trading below recent highs. Attention is on support at 123.03/02, low prints between Sep 29 and Oct 15. A break of this level would undermine the recent bullish outlook and instead signal scope for a deeper sell-off towards 122.38, Sep 28 low and the bear trigger. Moving average studies are in a neutral position. To strengthen a bullish argument, price needs to clear key resistance at 125.09, Oct 9 high.
AUD/USD TECHS: Focus Is On Trendline Resistance
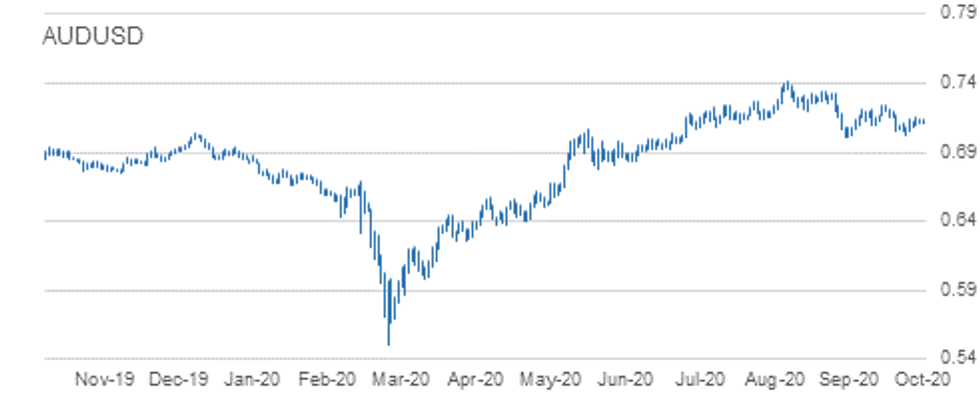
- RES 4: 0.7324 High Sep 21
- RES 3: 0.7243 High Oct 10 and the intraday bull trigger
- RES 2: 0.7163/70 Trendline drawn off the Sep 1 high / High Oct 15
- RES 1: 0.7158 High Oct 23
- PRICE: 0.7144 @ 16:29 GMT Oct 27
- SUP 1: 0.7085 Low Oct 22
- SUP 2: 0.7021 Low Oct 20
- SUP 3: 0.7006 Low Sep 25 and the bear trigger
- SUP 4: 0.6965 23.6% retracement of the Mar - Sep rally
AUDUSD outlook remains bearish although the pair is holding onto recent gains. The Aussie continues to trade below trendline resistance drawn off the Sep 1 high. The line intersects at 0.7163 and the recent failure at the trendline highlights a bearish risk. Attention is on the primary support and bear trigger at 0.7006, Sep 25 low. A trendline break however would alter the picture and signal a stronger reversal. This would open 0.7243, Oct 10 high.
USD/CAD TECHS: Returning Lower
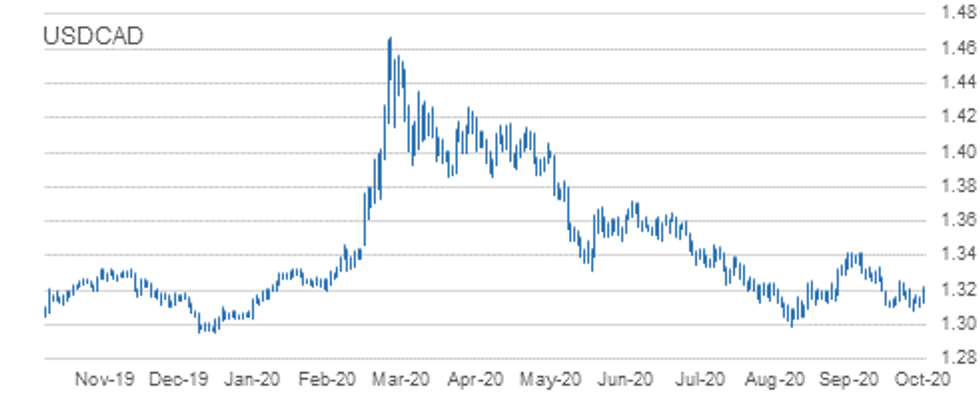
- RES 4: 1.3421 High Sep 30 and primary resistance
- RES 3: 1.3341 High Oct 7
- RES 2: 1.3240/59 50-day EMA / High Oct 15 and the bull trigger
- RES 1: 1.3219 High Oct 26
- PRICE: 1.3154 @ 16:30 GMT Oct 27
- SUP 1: 1.3109/3081 Low Oct 23 / Low Oct 21 and the bear trigger
- SUP 2: 1.3047 Low Sep 7
- SUP 3: 1.3038 Low Sep 2
- SUP 4: 1.2994 Low Sep 1 and the major support
USDCAD started the week on a firm note, rallying Monday. Despite recent gains, the outlook remains bearish though. This was confirmed on the pull lower Tuesday. The pair last week breached key support at 1.3099, Oct 13 low. The move lower confirms a resumption of the current downtrend that started Sep 30. Moving average studies are bearish too, reinforcing current conditions. Scope exists for a move towards the major support at 1.2994, Sep 1 low. Key resistance is at 1.3259, Oct 15 high.
EUR/USD: MNI KEY LEVELS
- *$1.2009/11 May03-2018 high/YTD Sep01 high
- *$1.1996 May14-2018 high
- *$1.1938 May15-2018 high
- *$1.1924 Upper Bollinger Band (3%)
- *$1.1912 Upper 1.0% 10-dma envelope
- *$1.1875 Upper Bollinger Band (2%)
- *$1.1857 100-mma
- *$1.1848/51 Cloud top/Jun14-2018 high
- *$1.1839 Intraday high
- *$1.1831 100-hma
- *$1.1828 ***CURRENT MARKET PRICE 17:44GMT TUESDAY***
- *$1.1815 Sep24-2018 high
- *$1.1800/96/95 200-hma, 55-dma/Intraday low/50-dma
- *$1.1776 21-dma
- *$1.1757 Sep27-2018 high
- *$1.1736 Fibo 38.2% 1.3993-1.0341
- *$1.1680/76 Lower Boll Band (2%)/Lower 1.0% 10-dma env
- *$1.1651 Sep28-2018 high
- *$1.1643 100-dma
- *$1.1633/31 Cloud base/Lower Boll Band (3%)
- *$1.1621/17 Oct16-2018 high/Down Trendline from Jul18-2008
GBP/USD: MNI KEY LEVELS
- *$1.3213 Mar28-2019 high
- *$1.3202 Upper Bollinger Band (3%)
- *$1.3196 Apr03-2019 high
- *$1.3191 Apr04-2019 high
- *$1.3185 May06-2019 high
- *$1.3139/44 Upper 1.0% 10-dma env/38.2% 1.4377-1.2382
- *$1.3128/31/33 Upper Boll Band (2%)/May07-2019 high/Apr12-2019 high
- *$1.3109 Fibo 50% 1.1841-1.4377
- *$1.3080 Intraday high, May08-2019 high
- *$1.3064 100-hma
- *$1.3063 ***CURRENT MARKET PRICE 17:44GMT TUESDAY***
- *$1.3041 May13-2019 high
- *$1.3018 55-dma
- *$1.3011/09 Cloud top, 200-hma/50-dma
- *$1.3001/99 Intraday low/61.8% 1.3381-1.2382
- *$1.2991 May10-2019 low
- *$1.2981 Cloud base
- *$1.2974/70 21-dma/May14-2019 high
- *$1.2953 50-mma
- *$1.2947 200-wma
- *$1.2904 May14-2019 low
EUR/GBP: MNI KEY LEVELS
- *Gbp0.9203 Sep08-2017 high
- *Gbp0.9163 Upper Bollinger Band (3%)
- *Gbp0.9157 Upper 1.0% 10-dma envelope
- *Gbp0.9129/34 Cloud top/Upper Boll Band (2%), Sep11-2017 high
- *Gbp0.9108 Jan03-2019 high
- *Gbp0.9084 Intraday high
- *Gbp0.9077/79 21-dma/Cloud base
- *Gbp0.9068/69 50-dma/200-hma
- *Gbp0.9062/65 Jan11-2019 high/55-dma
- *Gbp0.9056 100-hma
- *Gbp0.9054 ***CURRENT MARKET PRICE 17:44GMT TUESDAY***
- *Gbp0.9051/50 Jul17-2019 high/100-dma
- *Gbp0.9048/45 Jul16-2019 high/Intraday low
- *Gbp0.9039 Jul18-2019 high
- *Gbp0.9015/10 Lower Boll Band (2%)/Jul10-2019 high
- *Gbp0.9005/00 Jul23-2019 high/Jul22-2019 high
- *Gbp0.8985 Lower Bollinger Band (3%)
- *Gbp0.8976 Lower 1.0% 10-dma envelope
- *Gbp0.8953 Jul23-2019 low
- *Gbp0.8921 Jul02-2019 low
- *Gbp0.8896 200-dma
USD/JPY: MNI KEY LEVELS
- *Y105.34 21-dma
- *Y105.31 Cloud base
- *Y105.23 Cloud Kijun Sen
- *Y105.05 Cloud Tenkan Sen
- *Y105.04 200-hma
- *Y104.89 Intraday high
- *Y104.87 Jan03-2019 low
- *Y104.74 100-hma
- *Y104.56 Mar26-2018 low
- *Y104.45 Lower Bollinger Band (2%)
- *Y104.42 ***CURRENT MARKET PRICE 17:44GMT TUESDAY***
- *Y104.39 Intraday low
- *Y104.01 Lower Bollinger Band (3%)
- *Y104.00 YTD low
- *Y103.99 Lower 1.0% 10-dma envelope
- *Y103.94 200-mma
- *Y102.94 Lower 2.0% 10-dma envelope
- *Y101.89 Lower 3.0% 10-dma envelope
- *Y101.20 Nov09-2016 low
- *Y100.75 Sep30-2016 low
- *Y100.61 Fibo 50% 75.35-125.86
EUR/JPY: MNI KEY LEVELS
- *Y124.01 Cloud Tenkan Sen
- *Y124.00 Intraday high
- *Y123.95 200-hma
- *Y123.92 100-hma
- *Y123.80 Fibo 50% 126.81-120.78
- *Y123.74 Cloud Kijun Sen, May21-2019 high
- *Y123.72 Fibo 61.8% 115.21-137.50
- *Y123.68 Cloud base
- *Y123.56 100-dma
- *Y123.51/54 May22-2019 high/50% 109.57-137.50
- *Y123.51 ***CURRENT MARKET PRICE 17:44GMT TUESDAY***
- *Y123.49 Intraday low
- *Y123.18 Jun11-2019 high
- *Y123.11 Fibo 50% 118.71-127.50
- *Y123.08 38.2% 126.81-120.78, Lower Boll Band (2%)
- *Y123.01 Jun12-2019 high
- *Y122.64 Lower 1.0% 10-dma envelope
- *Y122.60 Lower Bollinger Band (3%)
- *Y122.56 Jun13-2019 high
- *Y122.23 Jul12-2019 high
- *Y122.13 Jun17-2019 high
AUD/USD: MNI KEY LEVELS
- *$0.7263 50-mma
- *$0.7252 Upper 2.0% 10-dma envelope
- *$0.7244 200-wma
- *$0.7234 Upper Bollinger Band (2%)
- *$0.7206/07 Apr17-2019 high/Feb21-2019 high
- *$0.7194/95 55-dma/50-dma
- *$0.7181 Upper 1.0% 10-dma envelope
- *$0.7168 Cloud base
- *$0.7153 Apr17-2019 low
- *$0.7147 Intraday high
- *$0.7143 ***CURRENT MARKET PRICE 17:44GMT TUESDAY***
- *$0.7140 Apr16-2019 low, 21-dma
- *$0.7122 100-hma
- *$0.7116 Apr12-2019 low, Intraday low
- *$0.7110 Apr10-2019 low, 100-dma
- *$0.7100 200-hma
- *$0.7088 Apr08-2019 low
- *$0.7073/69 Mar29-2019 low/Apr30-2019 high
- *$0.7057/53 Jul22-2019 high/Apr02-2019 low
- *$0.7048/46 Jul04-2019 high, May07-2019 high/Lower Boll Band (2%)
- *$0.7044 Jul16-2019 high
USD/CAD: MNI KEY LEVELS
- *C$1.3296/00 Upper 1.0% 10-dma env/Jun13-2019 low
- *C$1.3286 Jun20-2019 high
- *C$1.3224/26 50% 1.2783-1.3665/Jun10-2019 low
- *C$1.3207/12 21-dma/Intraday high
- *C$1.3198/01 50-dma/55-dma
- *C$1.3188 Cloud base
- *C$1.3175 50-mma
- *C$1.3166 200-hma
- *C$1.3160/63/64 200-wma, 100-hma/Feb21-2019 low/Jul23-2019 high
- *C$1.3150/51 Feb20-2019 low/Jun20-2019 low
- *C$1.3149 ***CURRENT MARKET PRICE 17:44GMT TUESDAY***
- *C$1.3142 Intraday low
- *C$1.3120/16 61.8% 1.2783-1.3665/Jul23-2019 low
- *C$1.3113 Feb25-2019 low
- *C$1.3107 Jun26-2019 low
- *C$1.3066 Fibo 38.2% 1.4690-1.2062
- *C$1.3057/53 Lower Boll Band (2%)/38.2% 1.2062-1.3665
- *C$1.3033 Lower 1.0% 10-dma envelope
- *C$1.3015 Oct25-2018 low
- *C$1.2986 Lower Bollinger Band (3%)
- *C$1.2970 Oct24-2018 low
Expiries for Oct28 NY cut 1000ET (Source DTCC)
EUR/USD: $1.1650-55(E521mln), $1.1675-78(E516mln), $1.1745-60(E1.3bln), $1.1800-05(E1.7bln), $1.1830(E555mln), $1.1850-65(E832mln), $1.1900(E958mln)
USD/JPY: Y103.50($519mln), Y103.90-00($607mln), Y104.50($772mln), Y104.85-00($3.0bln), Y105.30-40($1.8bln)
GBP/USD: $1.3100(Gbp669mln)EUR/GBP: Gbp0.9085-00(E1.1bln)
EUR/JPY: Y122.85(E843mln)
USD/CAD: C$1.3550($500mln)
USD/CNY: Cny6.68($550mln)
Larger Option Pipeline
EUR/USD: Oct30 $1.1800(E2.0bln), $1.1850(E1.5bln), $1.1950(E1.7bln-EUR calls), $1.2000(E1.3bln); Nov03 $1.1900-05(E1.3bln)
USD/JPY: Oct29 Y103.20-25($1.6bln), Y104.00($1.6bln), Y105.25($1.3bln), Y105.55-65($2.4bln), Y106.00($1.2bln); Oct30 Y104.00($1.2bln), Y104.50($2.3bln), Y104.80-85($1.4bln), Y104.95-105.00($1.0bln), Y106.00-05($2.2bln); Nov03 Y105.45-49($1.3bln); Nov04 Y105.00($1.1bln); Nov05 Y106.06-09($1.6bln)
EUR/JPY: Nov05 Y124.50(E1.0bln)
GBP/USD: Nov02 $1.3100(Gbp1.1bln), $1.3150(Gbp842mln)
EUR/GBP: Nov02 Gbp0.8900(E1.8bln-EUR puts), Gbp0.9000(E1.1bln)
AUD/USD: Oct30 $0.7180-00(A$1.4bln); Nov02 $0.7140-45(A$1.7bln)
AUD/JPY: Oct29 Y73.20(A$1.0bln-AUD puts), Y76.35-40(A$2.4bln-AUD calls); Oct30 Y77.45(A$1.2bln)
AUD/NZD: Oct30 N$1.0750(A$1.2bln)
USD/CAD: Oct30 C$1.3025($1.1bln), C$1.3150($1.2bln)
USD/CNY: Nov03 Cny6.5334($1.2bln); Nov05 Cny6.75($1.0bln), Cny6.80($1.9bln), Cny6.85($1.3bln)
Why MNI
MNI is the leading provider
of intelligence and analysis on the Global Fixed Income, Foreign Exchange and Energy markets. We use an innovative combination of real-time analysis, deep fundamental research and journalism to provide unique and actionable insights for traders and investors. Our "All signal, no noise" approach drives an intelligence service that is succinct and timely, which is highly regarded by our time constrained client base.Our Head Office is in London with offices in Chicago, Washington and Beijing, as well as an on the ground presence in other major financial centres across the world.