-
Policy
Policy
Exclusive interviews with leading policymakers that convey the true policy message that impacts markets.
LATEST FROM POLICY: -
EM Policy
EM Policy
Exclusive interviews with leading policymakers that convey the true policy message that impacts markets.
LATEST FROM EM POLICY: -
G10 Markets
G10 Markets
Real-time insight on key fixed income and fx markets.
Launch MNI PodcastsFixed IncomeFI Markets AnalysisCentral Bank PreviewsFI PiFixed Income Technical AnalysisUS$ Credit Supply PipelineGilt Week AheadGlobal IssuanceEurozoneUKUSDeep DiveGlobal Issuance CalendarsEZ/UK Bond Auction CalendarEZ/UK T-bill Auction CalendarUS Treasury Auction CalendarPolitical RiskMNI Political Risk AnalysisMNI Political Risk - US Daily BriefMNI Political Risk - The week AheadElection Previews -
Emerging Markets
Emerging Markets
Real-time insight of emerging markets in CEMEA, Asia and LatAm region
-
Commodities
-
Credit
Credit
Real time insight of credit markets
-
Data
-
Global Macro
Global Macro
Actionable insight on monetary policy, balance sheet and inflation with focus on global issuance. Analysis on key political risk impacting the global markets.
Global MacroDM Central Bank PreviewsDM Central Bank ReviewsEM Central Bank PreviewsEM Central Bank ReviewsBalance Sheet AnalysisData AnalysisEurozone DataUK DataUS DataAPAC DataInflation InsightEmployment InsightGlobal IssuanceEurozoneUKUSDeep DiveGlobal Issuance Calendars EZ/UK Bond Auction Calendar EZ/UK T-bill Auction Calendar US Treasury Auction Calendar Global Macro Weekly -
About Us
To read the full story
Sign up now for free trial access to this content.
Why MNI
MNI is the leading provider
of intelligence and analysis on the Global Fixed Income, Foreign Exchange and Energy markets. We use an innovative combination of real-time analysis, deep fundamental research and journalism to provide unique and actionable insights for traders and investors. Our "All signal, no noise" approach drives an intelligence service that is succinct and timely, which is highly regarded by our time constrained client base.Our Head Office is in London with offices in Chicago, Washington and Beijing, as well as an on the ground presence in other major financial centres across the world.
Real-time Actionable Insight
Get the latest on Central Bank Policy and FX & FI Markets to help inform both your strategic and tactical decision-making.
Free AccessMNI: Canada Apr-Dec Budget Deficit CAD21.7B Vs Prior CAD23.6B
MNI Credit Weekly: Fault Lines
MNI ASIA MARKETS ANALYSIS - So Long 2020, Scram

US TSY SUMMARY: Late Session Surge
Futures trading steady to mildly higher ahead the NY open, volumes light on the shortened final session of 2020 (TYH just over 750k on late duration extension trade).
- Where'd the Yield Go? 30YY currently at 1.6389% compares to 2.3896% 2019 EOY; 10YY at 0.9098% vs. 1.9175% 2019 EOY.
- Market moves more a function year-end asset allocation than a reaction to headline risk or data: Little react to lower than expected weekly claims (787k vs. 833k exp); same for limited Covid and stimulus relief related headlines as debate of latter stalled in Senate Wednesday.
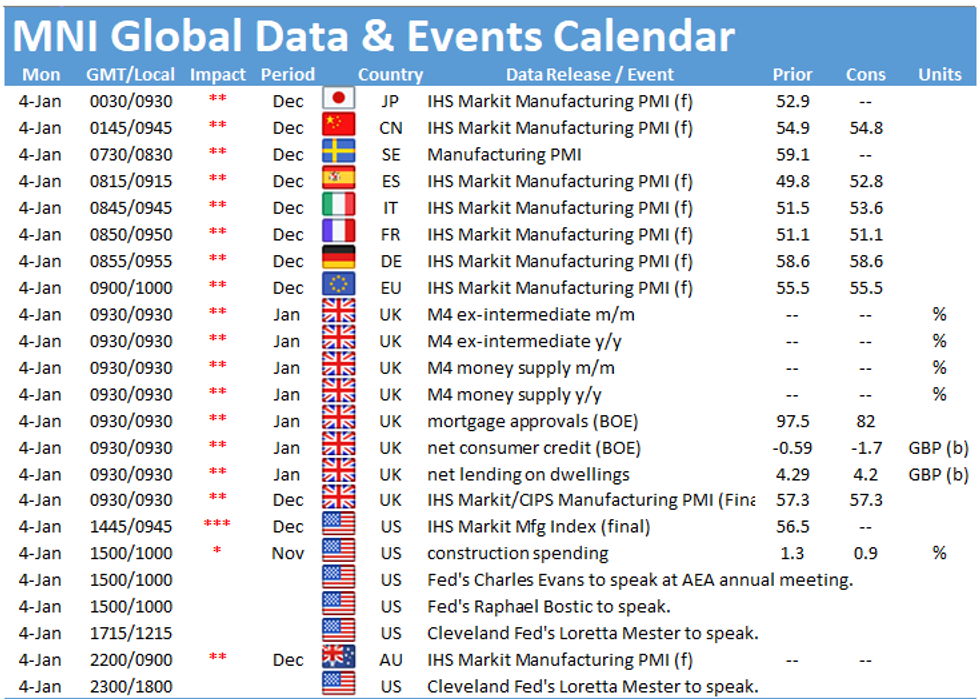
- Markets eager to put 2020 behind them will contend with a hectic start to 2021 with Electoral vote count on Jan 6, FOMC minutes Wed as well, and December employment data next week Friday (+245k prior, +50k est).
- The 2-Yr yield is unchanged at 0.1211%, 5-Yr is down 0.6bps at 0.3608%, 10-Yr is down 0.7bps at 0.9165%, and 30-Yr is down 0.7bps at 1.6482%.
MONTH-END EXTENSIONS
Final Bloomberg-Barclays US Extension Estimates Forecast summary compared to the avg increase for prior year and the same time in 2019. TIPS -0.03Y; Govt inflation-linked, -0.04. Note MBS extension climbs to 0.14Y from 0.09 in preliminary.
| Estimate | 1Y Avg Incr | Last Year | |
| US Tsys | 0.08 | 0.1 | 0.07 |
| Agencies | 0.08 | 0.05 | 0.09 |
| Credit | 0.07 | 0.12 | 0.07 |
| Govt/Credit | 0.07 | 0.1 | 0.07 |
| MBS | 0.14 | 0.07 | 0.09 |
| Aggregate | 0.08 | 0.09 | 0.06 |
| Long Gov/Cr | 0.07 | 0.09 | 0.06 |
| Iterm Credit | 0.05 | 0.1 | 0.06 |
| Interm Gov | 0.09 | 0.08 | 0.07 |
| Interm Gov/Cr | 0.08 | 0.09 | 0.06 |
| High Yield | 0.08 | 0.12 | 0.09 |
US TSY: Short Term Rates
US DOLLAR LIBOR: Latest settles:
- O/N -0.00800 at 0.07763% (-0.00337/wk)
- 1 Month -0.00010 to 0.14390% (-0.00123/wk)
- 3 Month +0.00090 to 0.23840% (-0.00173/wk)
- 6 Month -0.00190 to 0.25760% (-0.00903/wk)
- 1 Year -0.00050 to 0.34188% (+0.00150/wk)
STIR: FRBNY EFFR for prior session:
- Daily Effective Fed Funds Rate: 0.09% volume: $62B
- Daily Overnight Bank Funding Rate: 0.08%, volume: $155B
- Secured Overnight Financing Rate (SOFR): 0.09%, $916B
- Broad General Collateral Rate (BGCR): 0.08%, $338B
- Tri-Party General Collateral Rate (TGCR): 0.08%, $315B
- (rate, volume levels reflect prior session)
Updated NY Fed operational purchase schedule, $40.2B from 1/04-1/14
- Mon 1/04 1100-1120ET: Tsy 2.25Y-4.5Y, appr $8.825B
- Tue 1/05 1100-1120ET: Tsy 20Y-30Y, appr $1.750B
- Wed 1/06 1010-1030ET: TIPS 7.5Y-30Y, appr $1.225B
- Thu 1/07 1100-1120ET: Tsy 20Y-30Y, appr $1.750B
- Fri 1/08 1100-1120ET: Tsy 0Y-2.25Y, appr $12.825B
- Mon 1/11 1010-1030ET: TIPS 1Y-7.5Y, appr $2.425B
- Tue 1/12 1010-1030ET: Tsy 4.5Y-7Y, appr $6.025B
- Wed 1/13 1010-1030ET: Tsy 7Y-20Y, appr $3.625B
- Thu 1/14 1010-1030ET: Tsy 20Y-30Y, appr $1.750B
- Thu 01/14 Next forward schedule release at 1500ET
EURODOLLAR/TREASURY OPTIONS: Summary
Eurodollar Options:- +7,000 Dec 97/98/100 call flys, 4.0
- +30,000 Green Mar 92/100.25 put over risk reversals, 0.25 net vs. 99.75/0.04%
- +2,500 Blue Jun 88/91 put spds, 3.5
- +1,000 Red Jun 90/92/95/97 call condor, 3.25 legged
- +10,000 Green Jun 92/95 put spd
- 3,000 Jun 99.812 calls
- 1,000 Jun 97/81 1x2 call spds
- -1,500 TYH 136/140 strangles, 18
- 10,000 TYG 138 straddles, 62-63
- Update, +38,000 TYG 136.5 puts, 5-6
- +3,000 FVH 126.25 calls, 12.5
FOREX: US$ Index Bounce
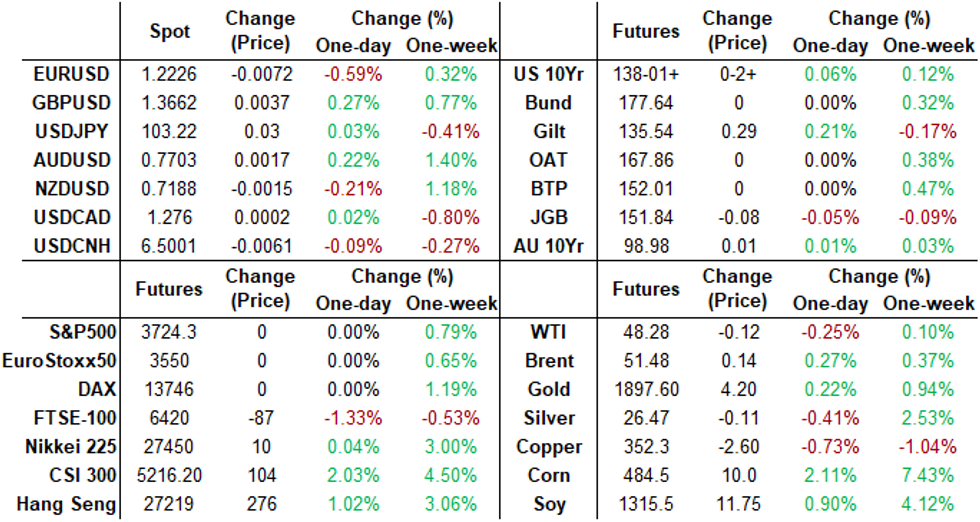
EUR continued the theme of the European morning, trading with a heavy tone throughout the US session. EURUSD made fresh session lows of 1.2225.
- The USD index had a fairly aggressive bounce as we approached the WMR month/year end fixing window. AUD, NZD and CAD giving up prior gains.
- GBP (+0.29%) remained well bid with EURGBP the notable mover as markets focused on the trade deal rather than the stricter Covid measures enforced throughout the country. Additionally, flows around month end saw EURGBP print fresh lows at 0.8947 (Down 0.85%).
- The USD index was certainly driven by its heavily weighted EUR component. Overall, G10 FX performance was mixed. AUD, CAD, GBP held onto gains, with NZD slipping into the red.
- USDCHF traded in tandem with EURUSD gaining 0.4% as of writing. USDCNH and USDJPY largely unchanged amid light volumes. Markets will continue to digest the news that China will adjust the weightings of currencies in its currency basket that helps set the yuan's daily reference rate, effective from Jan. 1.
Lower than expected U.S. initial jobless claims (787,000 through December - Lower than expected U.S. initial jobless claims (787,000 through December 26, far below expectations for 833,00 claims) was a sideshow as expected. In general, turnovers in FX have remained on the lower side, as we close out the year.
EQUITIES
Japan and Eurex closed for holiday, US indexes little weaker but finishing 2020 near all-time highs.
- Dow Jones mini down 15 pts or -0.05% at 30289,
- S&P 500 mini down 1 pts or -0.03% at 3724,
- NASDAQ mini down 24.25 pts or -0.19% at 12823.5.
- China's SHANGHAI closed up 58.616 pts or +1.72% at 3473.069,
- HANG SENG ended 84.02 pts higher or +0.31% at 27231.13
PIPELINE: 2020 Sets New High-Grade Corporate Debt Issuance
2020's Record $2.196.5B High-Grade Corporate Issuance Totals:
Note, 2020 started off with a bang, jumbo issuance largely from domestic names pushed issuance to $1.4T by the end of June, surpassed 2019 total of $1.156T.
- Dec $52.24B;$796.54B Second half of 2020
- Nov $126.83B
- Oct $111.65B
- Sep $207.82B
- Aug $204.5B
- Jul $93.5B
- Jun $180.5B; Whopping $1.400T for first half of year
- May $270.9B
- Apr $401.325B* one-month record
- Mar $275.48B
- Feb $107.5B
- Jan $165.18B
COMMODITIES: Modest Moves On Final Session of 2020
- WTI Crude down $0.22 or -0.45% at $48.18
- Natural Gas up $0.05 or +2.23% at $2.475
- Gold spot down $0.6 or -0.03% at $1893.64
- Copper down $2.6 or -0.73% at $352.45
- Silver down $0.34 or -1.26% at $26.3278
- Platinum down $0.82 or -0.08% at $1071.46

To read the full story
Sign up now for free trial access to this content.
Why MNI
MNI is the leading provider
of intelligence and analysis on the Global Fixed Income, Foreign Exchange and Energy markets. We use an innovative combination of real-time analysis, deep fundamental research and journalism to provide unique and actionable insights for traders and investors. Our "All signal, no noise" approach drives an intelligence service that is succinct and timely, which is highly regarded by our time constrained client base.Our Head Office is in London with offices in Chicago, Washington and Beijing, as well as an on the ground presence in other major financial centres across the world.
