
Why MNI
MNI is the leading provider
of intelligence and analysis on the Global Fixed Income, Foreign Exchange and Energy markets. We use an innovative combination of real-time analysis, deep fundamental research and journalism to provide unique and actionable insights for traders and investors. Our "All signal, no noise" approach drives an intelligence service that is succinct and timely, which is highly regarded by our time constrained client base.Our Head Office is in London with offices in Chicago, Washington and Beijing, as well as an on the ground presence in other major financial centres across the world.
Turnaround Tuesday, 10YY Sub 3%, Stocks Extend Late Highs
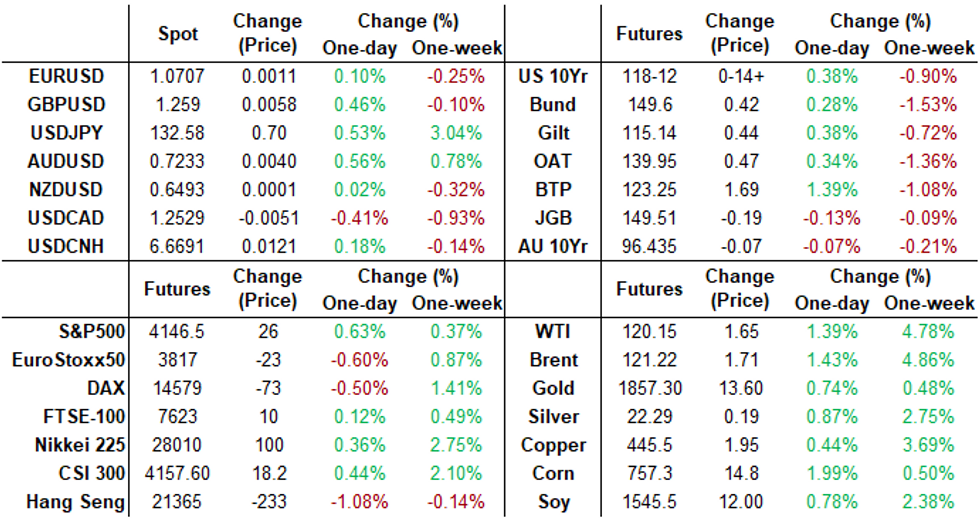
Turnaround Tuesday lives up to it's name. Except for yield curves that finished near lows (2s10s -6.418 at 24.339), rates stronger after the bell, near late session highs on strong volumes (TYU2>1.2M) w/bonds unwinding Mon's weakness. Current 30YY 3.1319% after nearly tapping Mon's 3.2044% high overnight; 10YY back below 3.0% at 2.9828% vs. 3.0621% overnight high.
- No specific driver for the reversal, trading desks say, though there are "big short positions per JPM survey .. while we usually rally through supply," on added, citing Tsy coupon auctions that start w/ $44B 3Y notes today.
- "Today is a buy everything day," another quipped as stocks extended session highs late (ESM2 +34.5 at 4154.5; Gold +13.00 at 1854.43; WTI crude +1.60 at 120.10.
- Treasury futures held gains after $44B 3Y note auction (91282CEU1) tailed: 2.927% high yield vs. 2.915% WI; 2.45x bid-to-cover vs. 2.59x last month.
- No react to limited data: US APR TRADE GAP -$87.1B VS MAR -$107.7B, nor Consumer credit ($38.1B).
- No react to Tsy Sec Yellen testimony to Committee on Finance, U.S. Senate, nothing really new as the former Fed chair touches upon supply constraints, chip shortages underpinning inflation. That said -- starting to see pick-up in stories suggesting global inflation may be topping out, Bbg citing semiconductor prices, spot rate for shipping containers and fertilizer prices plateauing.
SHORT TERM RATES
US DOLLAR LIBOR: Latest settlements
- O/N +0.00514 to 0.82657% (+0.00743/wk)
- 1M +0.03058 to 1.19029% (+0.07058/wk)
- 3M +0.02543 to 1.69043% (+0.06443/wk) * / **
- 6M +0.05043 to 2.23843% (+0.12914/wk)
- 12M +0.03728 to 2.88957% (+0.11414/wk)
- * Record Low 0.11413% on 9/12/21; ** New 2Y high: 1.69043% on 6/7/22
STIR: FRBNY EFFR for prior session:
- Daily Effective Fed Funds Rate: 0.83% volume: $85B
- Daily Overnight Bank Funding Rate: 0.82% volume: $266B
US TSYS: Repo Reference Rates
- Secured Overnight Financing Rate (SOFR): 0.78%, $959B
- Broad General Collateral Rate (BGCR): 0.78%, $360B
- Tri-Party General Collateral Rate (TGCR): 0.78%, $348B
- (rate, volume levels reflect prior session)
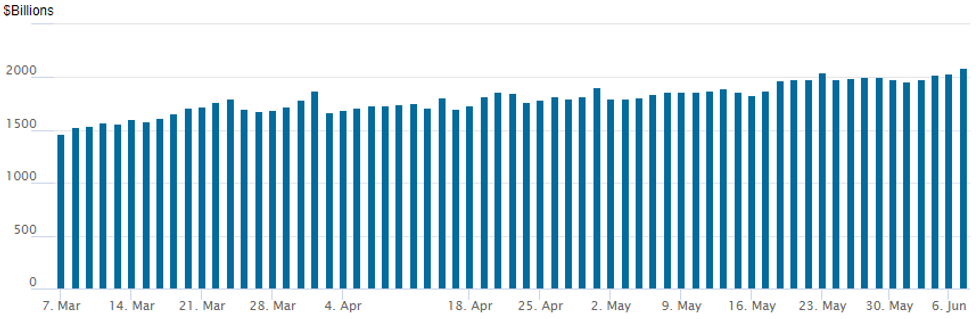
FED Reverse Repo Operation, New Record High
NY Federal Reserve/MNI
NY Fed reverse repo usage climbs to new record high of 2,091.395B w/ 98 counterparties vs. 2,040.093B prior session, compares to prior record of $2,044.658B from Monday, May 23.
EURODOLLAR/SOFR/TREASURY OPTIONS SUMMARY
Short-term tactical plays via OTM calls on Tuesday market direction made the right call Monday with underlying rates bouncing off four week lows, 10Y Tsy ylds back below 3% at 2.9644% vs. 3.0621% overnight high.- No specific driver for the reversal, trading desks said, though there are "big short positions per JPM survey .. while we usually rally through supply," on added, citing Tsy coupon auctions that start w/ $44B 3Y notes today. "Today is a buy everything day," another quipped as stocks bounce (ESM2 +21.0 at 4141.5; Gold +12.30 at 1853.73; WTI crude +1.15 at 119.65.
- 3,000 short Jul 96.00/96.12 put spds
- Block, 16,655 Dec 97.50 (.5 net) and 98.00 (1.0 met) call over risk reversals vs. EDZ2 97.75/100%
- Block, 16,655 Sep 98.00 call over risk reversals, 0.25 net vs. EDU2 98.00/100%
- 10,000 Sep 97.75/98.00/98.12 broken call flys
- 6,300 Sep 94.00 puts
- 3,500 Sep 97.00 puts, 4.5
- 3,500 Dec 96.00 puts
- 2,500 short Jun 96.61/96.43 3x2 put spds
- 4,500 Dec 97.62/98.00 put spds
- 5,000 Jul 96.00/96.12 put spds
- 7,500 TYN 116.5/118.5 put spds, 37 ref: 118-14-14.5
- 1,900 TYQ 122/123/124/125 call condors
- 5,000 TYN 117.75 puts, 29
- 4,000 TYQ 122.5/124.5 call spds
- 3,200 FVN 113.5 calls, 4
- 1,300 FVU 111/112.5 risk reversals
- 1,500 TYN 119.5/120.5/121.5 call flys
- 3,000 TYN 116.5/117 put spds, 8
EGBs-GILTS CASH CLOSE: Yields Settle Lower Amid Pre-ECB Squaring
Core European bond yields eased from fresh multi-year highs set earlier in the session, settling lower by Tuesday's cash close with modest bull flattening in both the UK and German curves.
- With little data and few headline drivers, the moves were seen as largely squaring/short-covering ahead of Thursday's ECB meeting. Though rate hike pricing didn't change much on the session, there was continued volatility in Periphery EGB spreads amid ongoing speculation over an anti-fragmentation tool.
- Periphery spreads easily outperformed, highlighted by a 9+bp drop in Italian 10Y spreads to the psychologically crucial 200bp mark once again.
- Our ECB preview went out earlier today.
Closing Yields / 10-Yr Periphery EGB Spreads To Germany:
- Germany: The 2-Yr yield is down 2.4bps at 0.669%, 5-Yr is down 2.1bps at 1.029%, 10-Yr is down 2.9bps at 1.293%, and 30-Yr is down 4.9bps at 1.526%.
- UK: The 2-Yr yield is down 3.3bps at 1.747%, 5-Yr is down 2.5bps at 1.844%, 10-Yr is down 3.3bps at 2.214%, and 30-Yr is down 5.6bps at 2.425%.
- Italian BTP spread down 9.2bps at 200.2bps / Spanish down 4.5bps at 111.6bps
EGB Options: More Hawkish ECB Plays
Tuesday's Europe rates / bond options flow included:
- RXN2 153/155cs 1x2 bought for 8 1930 vs RXN2 153.5/155.5cs 1x2 sold at 5.5 in1930 (rolling down).
- RXN2 144/142ps 1x2, bought for 1 in 1k.
- RXN2 150/148.5/146p ladder, sold at 41 in 1.5k
- RXN2 151/149ps, bought for 104 in 2.15k
- RXU2 150/153cs 1x2, bought for 7 in 2.5k
- RXN2 150/149/148p fly, sold at 12.5 and 12 in 5k
- RXN2 152/153.5cs, bought for 22 in 4.3k
- RXU2 144/161 ^^, bought for 78 in 1k
- OEQ2 122/126 Risk Reversal, bought the put for 4/4.5/5 in 12.5k. (This covers the July ECB meeting, expiry 22nd July vs ECB on the 21st July)
- 0RM2 98.50/98.25/98.12 broken p fly sold 14.5 in 5k
- ERU2 99.37/99.75^^ sold at 11 in 2k
- ERU2 99.50/99.375 ps vs 99.75c, bought the ps for half in 5k
- ERZ2 98.75p v ERM3 97.25p bought the Dec 1.25 in 2.5k
FOREX: Greenback Reverses Lower Amid Lower US Yields, Higher Equities
- The USD Index made fresh two-week highs in early trade on Tuesday, extending the late recovery seen on Monday from the key support at 101.81, 50-dma. However, a bounce for major equity indices and lower US yields weighed on the greenback throughout the US trading session.
- The softer US Dollar boosted the likes of GBP and CAD which look to post half percent gains on the day. The Euro (+0.10%) was more subdued as markets prepare for Thursday’s ECB meeting.
- The key outperformer was AUD, rising around 0.6% after the RBA surprised markets overnight, raising rates by 50bps against expectations of a 25bps move. The appreciation was by no means in a straight line. After spiking to 0.7246, the pair subsequently faded, printing fresh lows below 0.7160 at the start of NY trade. The currency eventually recovered amid a multitude of sell-side analysts bringing forward forecasts for the next 50bps hike and the renewed bid in global equity benchmarks.
- The Japanese Yen is once again the poorest performer in the G10 currency space. USDJPY has resumed its primary uptrend with the pair clearing resistance at 131.35, May 9 high. The move higher maintains the broader bullish price sequence of higher highs and higher lows and with moving average studies pointing north, indications are that the USD has further to go. The focus is on 134.48, a Fibonacci projection. Initial firm support is seen at 128.94, the 20-day EMA.
- The ECB meeting remains the nearest key risk event for global markets, due Thursday. The ECB is now clear that the APP will end in early July, policy rate lift-off will occur in the same month and policy rates will reach zero by September. A 50bp hike in July is a low, but increasing, risk. However, the probability is rising of a one-off 50bp hike or a series of such hikes from September onward.
- US CPI data and Canadian Employment will be released on Friday.
FX: Expiries for Jun08 NY cut 1000ET (Source DTCC)
- EUR/USD: $1.0600(E606mln), $1.0650(E658mln), $1.0680-85(E510mln), $1.0750-60(E880mln), $1.0800(E880mln)
- USD/JPY: Y130.00-15($709mln)
- GBP/USD: $1.2450(Gbp702mln)
- EUR/GBP: Gbp0.8585-95(E662mln)
- NZD/USD: $0.6315(A$1.1bln)
Late Equity Roundup: Finishing Strong
Stocks trading firmer heading into the FI close, near late session highs after trimming gains around midday w/ SPX emini futures ESM2 at 4149.25 (+28.0).
- SPX leading/lagging sectors: Energy sector continued to outperform (+2.84%) lead by O&G shares, while Industrials (+1.01%) outpaced Information Technology and Health Care both +0.90%. Laggers: Consumer Discretionary (-0.81%) as internet and direct marketing retailers remained weaker: Etsy -3.88% at 80.58, Amazon -2.28% at 121.94, Ebay -0.61% at 47.38.
- DJIA +185.29 (0.56%) at 33103.93; Nasdaq +89.3 (0.7%) at 12151.64.
- Dow Industrials Leaders/Laggers: United Health Care leads (UNH) +4.20 at 494.38, cloud-based software company Salesforce.com remains strong +4.11 at 186.98 followed by Chevron (CVX) +3.30 at 180.13 as crude rebounds. Laggers: Home Depot (HD) remains weak but off lows at 299.02 (-4.87), Walmart (WMT) -1.80 at 123.07.
E-MINI S&P (M2): Bull Flag?
- RES 4: 4509.00 High Apr 21
- RES 3: 4393.25 High Apr 22
- RES 2: 4303.50 High Apr 26/28 and a key short-term resistance
- RES 1: 4178.95/4202.25 50-day EMA / High May 31
- PRICE: 4093.00 @ 14:34 BST June 7
- SUP 1: 3960.50/3807.50 Low May 26 / Low May 20 and bear trigger
- SUP 2: 3801.97 38.2% of the Mar ‘20 - Jan ‘22 bull leg (cont)
- SUP 3: 3787.74 2.618 proj of the Mar 29 - Apr 18 - 21 price swing
- SUP 4: 3747.52 2.764 proj of the Mar 29 - Apr 18 - 21 price swing
S&P E-Minis continues to trade inside its recent range and the current consolidation appears to be a bull flag. If correct, this reinforces short-term bullish conditions. Attention is on the 50-day EMA, at 4178.95 today. A clear break of this average would strengthen a bullish outlook and open 4303.50, the Apr 26/28 high. Gains are still considered corrective and the primary trend direction is down. First support to watch is 3960.50, May 26 low.
COMMODITIES: Oil and Gold See Late Boost From Risk-On
- Crude oil saw some volatility after what had been a quiet day, sliding sharply and then bouncing through settlement, helped by a further rise in equities.
- The latest GS forecast puts Brent crude averaging $140/bbl in 3Q22 before $125/bbl in 2023 adding to a wide range of analyst forecasts. They suggest further demand destruction is required next year for global inventories to normalise by late 2023.
- Products demand meanwhile remains extremely high, with US gasoline touching new record highs.
- WTI is +1.4% at $120.16, hovering just under resistance at $120.99 (Jun 6 high) after which it could open round number resistance at $122. The most active strikes in the Jul’22 contract have clearly been $125/bbl calls.
- Brent is +1.4% at $121.23, again just below resistance at $121.95 (Jun 6 high), clearance of which could open +123.49 (1.5 proj of the May 11-17-19 price swing).
- Gold meanwhile firms +0.7% to $1854.49 as the UST yields and the US dollar pull back. Recent gains have been considered corrective with the primary trend direction is down but a run at resistance at $1874.1 could test this.
- US natural gas meanwhile sits +0.5% at $9.37/mmbtu off earlier record highs of $9.54 as hot temperatures boost domestic power generation demand with Texas expected to see all-time electricity demand highs this week.
Wednesday Data Calendar
| Date | GMT/Local | Impact | Flag | Country | Event |
| 08/06/2022 | 0545/0745 | ** |  | CH | unemployment |
| 08/06/2022 | 0600/0800 | ** |  | DE | Industrial Production |
| 08/06/2022 | 0645/0845 | * |  | FR | Foreign Trade |
| 08/06/2022 | 0645/0845 | * | | FR | Current Account |
| 08/06/2022 | 0800/1000 | * |  | IT | Retail Sales |
| 08/06/2022 | 0830/0930 | ** |  | UK | IHS Markit/CIPS Construction PMI |
| 08/06/2022 | 0900/1000 | ** | | UK | Gilt Outright Auction Result |
| 08/06/2022 | 0900/1100 | *** |  | EU | GDP (2nd est.) |
| 08/06/2022 | 0900/1100 | * | | EU | Employment |
| 08/06/2022 | 1100/0700 | ** |  | US | MBA Weekly Applications Index |
| 08/06/2022 | 1400/1000 | ** | | US | Wholesale Trade |
| 08/06/2022 | 1430/1030 | ** | | US | DOE weekly crude oil stocks |
| 08/06/2022 | 1700/1300 | ** | | US | US Note 10 Year Treasury Auction Result |
Why MNI
MNI is the leading provider
of intelligence and analysis on the Global Fixed Income, Foreign Exchange and Energy markets. We use an innovative combination of real-time analysis, deep fundamental research and journalism to provide unique and actionable insights for traders and investors. Our "All signal, no noise" approach drives an intelligence service that is succinct and timely, which is highly regarded by our time constrained client base.Our Head Office is in London with offices in Chicago, Washington and Beijing, as well as an on the ground presence in other major financial centres across the world.