
Why MNI
MNI is the leading provider
of intelligence and analysis on the Global Fixed Income, Foreign Exchange and Energy markets. We use an innovative combination of real-time analysis, deep fundamental research and journalism to provide unique and actionable insights for traders and investors. Our "All signal, no noise" approach drives an intelligence service that is succinct and timely, which is highly regarded by our time constrained client base.Our Head Office is in London with offices in Chicago, Washington and Beijing, as well as an on the ground presence in other major financial centres across the world.
- China Asks Big Banks to Cut Deposit Rates to Boost Growth, Bbg
- DIMON: NOT PARTICULARLY SIGNIFICANT IF FED RAISES 25 BP, Bbg
- SEC CHAIR GENSLER: BINANCE OPERATED `WEB OF DECEPTION AND CONFLICTS' -- SAYS THAT BINANCE CASE HAS PARALLELS WITH FTX CASE, Bbg
US TSYS: Rates and Stocks Back Near Mid-Range
- Treasury futures trading mixed after the bell, near the middle of the session range, curves extending inversion with short end rates underperforming.
- Front month Treasury 2Y futures tapped 102-18.38 low (-4.38) after a large 10.5k midday Block sale, with yield climbing to 4.5413% high. Sep 10Y futures tapped 113-18.5 (-10) low, above initial technical support of 113-10 (Monday low) before drifting back to 113-26 (-2.5) after the bell.
- Attention is on key support and the bear trigger at 112-29+, the May 26 / 30 low. A break would resume the downtrend since May 4.
- Curves extending inversion but remain above early March low around -110 (multi-decade low not seen since early 1980s).
- The early morning selloff was partially tied to swings in EGBs, while incoming corporate debt issuance is creating some rate lock sale pressure, surge in supply is expected to continue as issuers return following the passage of debt ceiling bill late last week.
- Meanwhile, stocks have rebounded back to mildly higher levels, SPX (+9.5 at 4290.5) buoyed by bank shares recovering from Monday sell-off tied to talk of increasing capital requirements for banks by an average of 20%.
SHORT TERM RATES
SOFR Benchmark Settlements:
- 1M -0.01160 to 5.13842 (-.00225/wk)
- 3M -0.01439 to 5.23884 (+.00850/wk)
- 6M -0.01078 to 5.27695 (+.03148/wk)
- 12M +0.00223 to 5.09477 (+.06780/wk)
US DOLLAR LIBOR: Latest settlements:
- O/N +0.00400 to 5.06871%
- 1M +0.01057 to 5.20114%
- 3M +0.00415 to 5.51329 */**
- 6M -0.01872 to 5.64457%
- 12M -0.03543 to 5.74414%
- * Record Low 0.11413% on 9/12/21; ** New 16Y high: 5.51671% on 5/31/23
- Daily Effective Fed Funds Rate: 5.08% volume: $136B
- Daily Overnight Bank Funding Rate: 5.07% volume: $294B
- Secured Overnight Financing Rate (SOFR): 5.06%, $1.472T
- Broad General Collateral Rate (BGCR): 5.05%, $605B
- Tri-Party General Collateral Rate (TGCR): 5.05%, $594B
- (rate, volume levels reflect prior session)
FED Reverse Repo Operation
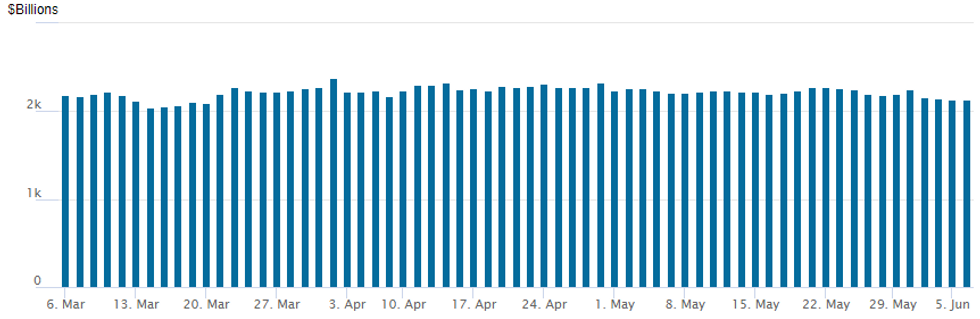
NY Federal Reserve/MNI
NY Fed reverse repo usage inches back up to $2,134.638B w/ 101 counterparties, compared to $2,131.417B in the prior session. The high for 2023 stands at $2,375.171B on Friday March 31, 2023; all-time record high of $2,553.716B reached December 30, 2022.
SOFR/TREASURY OPTION SUMMARY
After generally pared trade in the first half, interest shifted toward calls and call spreads in the second half. Notable trades targeted a rebound in July SOFR and and 5Y underlying futures as well as Dec'23 call opener hedging for projected rate hikes to return.- SOFR Options:
- Block, 27,500 SFRZ3 98.87 calls, 2.0 vs. 95.105/0.05%
- -8,000 3QM3 96.87/97.25 call spds 8.5 vs. 96.87/0.40%
- +20,000 SFRN3 94.93/95.00/95.06 call flys, 0.5 ref 94.795
- Block, total 6,000 OQU3 98.00 calls, 4.5 ref 96.39
- Block, 4,000 OQN3 96.00/96.43 put spds 6.5 over 2QN3 96.68 puts
- 5,000 SFRM3 94.68/94.75/94.81 put flys ref 94.7375
- 2,000 SFRM3 94.75/94.81/94.87 call flys ref 94.7375
- 7,300 SFRM3 94.81/94.87 call spds ref 94.7425
- over 10,000 SFRM3 94.75/94.81/94.87 put flys, ref 94.745
- 1,500 SFRZ3 94.50/94.75 put spds ref 95.115
- 1,800 SFRZ3 96.00/97.12 1x2 call spds ref 95.115
- 1,000 SFRM3 94.37/94.56 1x2 call spds ref 94.725
- Treasury Options:
- 2,000 TYN3 114/115 call spds, 22 ref 113-24.5
- 3,000 FVU3 109.5/111 call spds, ref 108-17.75
- +11,600 FVN3 109/110 call spds .5 over FVN3 107.5 puts ref 108-18
- over 4,000 TYN3 115 calls, 23 ref 114-04.5
- 4,000 TYN3 111/112 put spds, ref 114-05.5
- 10,000 FVN3 110 calls, 11 ref 108-24.5
EGBs-GILTS CASH CLOSE: Rally Fades, German Short End Outperforms
A morning rally across EGBs and Gilts faded in the afternoon Tuesday, with the only consistent theme throughout being German short-end outperformance.
- The stand out move early in the session was strong bull steepening in the German curve as Schatz yields dropped over 9bp.
- Multiple factors were behind the move, including some comments by ECB's Knot interpreted as relatively dovish; weak German factory orders; lower oil prices and equities; a pullback in consumer inflation expectations per the ECB survey; and mixed Eurozone retail sales.
- The move faded in the afternoon, with no particular driver, though heavy issuance (including multiple syndications today and announced for tomorrow, including E7bln in EU today / Spain Weds) weighed, as did a recovery in equities in the afternoon alongside some selling pressure in US Treasuries.
- By the end of the session, the German curve had twist steepened, with the UK's twist flattening. Periphery EGB spreads widened slightly, led by BTPs.
- Wednesday's docket includes German industrial and Italian retail sales data, and appearances by ECB's Guindos / Knot / Panetta.
Closing Yields / 10-Yr Periphery EGB Spreads To Germany:
- Germany: The 2-Yr yield is down 3.5bps at 2.854%, 5-Yr is down 1.9bps at 2.384%, 10-Yr is down 0.9bps at 2.372%, and 30-Yr is up 1bps at 2.555%.
- UK: The 2-Yr yield is up 3.3bps at 4.478%, 5-Yr is up 1.5bps at 4.184%, 10-Yr is down 0.1bps at 4.207%, and 30-Yr is down 3.8bps at 4.473%.
- Italian BTP spread up 2.7bps at 178.4bps / Spanish up 0.4bps at 99.9bps
EGB Options: Mostly Upside Tuesday Expressed Via Call Structures
Tuesday's Europe rates / bond options flow included:
- DUN3 105.50/105.80/106.10c fly, bought for 6.5 in 2.5k
- ERU3 96.37/96.50/96.62c fly, bought for 1.25 in 22k total
- 0RZ3 97.25/97.62cs, bought for 12.5 in 10k
- SFIN3 95/95.10cs vs 94.40/94.30ps, bought the cs for half in 4k
FOREX: AUD Consolidates Post-RBA Strength, USD Index Moderately Firmer
- Despite the initial greenback advance moderating on Tuesday, the USD index has risen 0.15%, reasserting itself above the 104.00 handle following Monday’s post ISM slide. Greenback strength was not enough to keep the Australian dollar from consolidating its post RBA strength. AUDUSD remains the strongest pair across G10, advancing 0.85% to a three-week high.
- As a reminder, the RBA marginally pushed against consensus with a 25bps hike to the cash rate target, boosting rates to 4.10% and signalling that further policy tightening could follow.
- In response, AUD surged to an intra-day peak of 0.6685 and despite the pullback throughout the first half of the European session, sits firmer against all others in G10 - helping to extend the streak of higher intraday lows into a fifth session against the USD.
- Technically, price action marks an extension of the recovery from the May 31 low and resistance at the 50-day EMA, which intersects at 0.6653, has been cleared. This signals scope for a stronger recovery and opens 0.6710, May 16 high. Above here, the May 10 high at 0.6818 remains the key short-term resistance point.
- Elsewhere, the Mexican Peso rose to a seven-year high against the dollar, with USDMXN once again testing below the bear trigger at 17.4207. A sustained break would confirm a resumption of the downtrend and opens the potential for a move to 17.0507, the Apr 29 2016 low.
- Focus on Wednesday turns to RBA Governor Lowe who will speak at the Morgan Stanley Australia Summit, in Sydney where Q&A is expected. Additionally, Australian Q1 GDP Data will hit the wires. Attention will then turn to the Bank of Canada rate decision where analysts remain split whether the BOC will hike by 25bps or keep rates unchanged at 4.50%.
FX Expiries for Jun07 NY cut 1000ET (Source DTCC)
- EUR/USD: $1.0615-25(E1.2bln), $1.0645-50(E535mln), $1.0730(E1.2bln)
- USD/JPY: Y137.95-05($1.4bln), Y139.00($1.2bln), Y142.00($3.3bln)
- AUD/USD: $0.6620-30(A$718mln), $0.6650(A$541mln), $0.6700(A$1.2bln)
Late Equities Roundup: Regional Banks Rebound
- Stocks are drifting near the middle of a narrow session range early in the second half, S&P E-Mini futures currently trading down 2 points (-0.05%) at 4279.5; Nasdaq up up 29 points (0.2%) at 13259.03; DJIA down down 85.13 points (-0.25%) at 33478.33.
- Financials sector stocks lead gainers on the day, regional banks bouncing after Monday's sell-off tied to talk of increasing capital requirements for banks by an average of 20%. At the moment, Comerica (CMA) +6.3%, Zion Bancorp (ZION) +5.75%, and Key Bank +5.25%.
- Communication Services and Consumer Discretionary sectors also posted modest gains, consumer durables and apparel stocks supporting the latter. Meanwhile, Health Care, Consumer Staples and information Technology sectors underperformed..
- For a technical perspective, trend conditions for S&P E-minis remain bullish following recent gains. Resistance at 4244.00, the Feb 2 high and a medium-term bull trigger, has been cleared. The break reinforces bullish conditions and confirms a resumption of the uptrend that started in October 2022. The focus is on 4327.50 next, the Aug 16 2022 high (cont). The 50-day EMA, at 4149.71 remains a key support. A break is required to signal a reversal.
E-MINI S&P TECHS: (M3) Bullish Outlook
- RES 4: 4400.00 Round number resistance
- RES 3: 4393.25 High Apr 22 2022 (cont)
- RES 2: 4327.50 High Aug 16 2022 (cont)
- RES 1: 4305.75 High Jun 5
- PRICE: 4273.50 @ 14:30 BST Jun 6
- SUP 1: 4229.00 Low Jun 2
- SUP 2: 4193.47 20-day EMA
- SUP 3: 4149.71 50-day EMA
- SUP 4: 4144.00 Low May 24 and a key support
S&P E-minis trend conditions remain bullish following recent gains. Resistance at 4244.00, the Feb 2 high and a medium-term bull trigger, has been cleared. The break reinforces bullish conditions and confirms a resumption of the uptrend that started in October 2022. The focus is on 4327.50 next, the Aug 16 2022 high (cont). The 50-day EMA, at 4149.71 remains a key support. A break is required to signal a reversal.
COMMODITIES: Crude Oil Limits Declines As Attention Turns To China Trade Data
- Crude oil prices are trading modestly lower on the day having recovered from larger declines earlier in the session as the market assesses lower OPEC production in the second half of 2023 and in 2024 against economic driven demand fears in US and China.
- The intraday recovery was halted by Russia failing to cut output by 500kbp in May, with crude production instead only slightly down from 9.67mbpd to 9.66mbpd.
- China May trade data is out later with the market watching for a slowing in export growth following the previous weaker official manufacturing PMI data.
- WTI is -0.65% at $71.69 after a session low of $70.15 came close to $70.00 (Jun 2 low).
- Brent is -0.65% at $76.22 after a low of $74.76 held above support at $74.18 (Jun 2 low).
- Gold is +0.1% at $1963.97 with little change in the USD index on the day but holding up well considering the climb front end Treasury yields. Technical levels are untouched with resistance at $1985.3 (May 24 high) and support at $1932.2 (May 31 low).
Wednesday Data Calendar
| Date | GMT/Local | Impact | Flag | Country | Event |
| 07/06/2023 | 0130/1130 | *** |  | AU | Quarterly GDP |
| 07/06/2023 | 0545/0745 | ** |  | CH | Unemployment |
| 07/06/2023 | 0600/0800 | ** |  | DE | Industrial Production |
| 07/06/2023 | 0645/0845 | * |  | FR | Foreign Trade |
| 07/06/2023 | 0750/0950 |  | EU | ECB de Guindos Speech at EC/ECB Conference | |
| 07/06/2023 | 0800/1000 | * |  | IT | Retail Sales |
| 07/06/2023 | 0900/1000 | ** |  | UK | Gilt Outright Auction Result |
| 07/06/2023 | 0910/1110 | | EU | ECB Panetta Moderates EC/ECB Conference Panel | |
| 07/06/2023 | 1100/0700 | ** |  | US | MBA Weekly Applications Index |
| 07/06/2023 | - | *** |  | CN | Trade |
| 07/06/2023 | 1230/0830 | ** |  | CA | International Merchandise Trade (Trade Balance) |
| 07/06/2023 | 1230/0830 | ** | | US | Trade Balance |
| 07/06/2023 | 1400/1000 | *** | | CA | Bank of Canada Policy Decision |
| 07/06/2023 | 1430/1030 | ** | | US | DOE Weekly Crude Oil Stocks |
| 07/06/2023 | 1900/1500 | * | | US | Consumer Credit |
Why MNI
MNI is the leading provider
of intelligence and analysis on the Global Fixed Income, Foreign Exchange and Energy markets. We use an innovative combination of real-time analysis, deep fundamental research and journalism to provide unique and actionable insights for traders and investors. Our "All signal, no noise" approach drives an intelligence service that is succinct and timely, which is highly regarded by our time constrained client base.Our Head Office is in London with offices in Chicago, Washington and Beijing, as well as an on the ground presence in other major financial centres across the world.