
Why MNI
MNI is the leading provider
of intelligence and analysis on the Global Fixed Income, Foreign Exchange and Energy markets. We use an innovative combination of real-time analysis, deep fundamental research and journalism to provide unique and actionable insights for traders and investors. Our "All signal, no noise" approach drives an intelligence service that is succinct and timely, which is highly regarded by our time constrained client base.Our Head Office is in London with offices in Chicago, Washington and Beijing, as well as an on the ground presence in other major financial centres across the world.
- MNI EU: Von Der Leyen: EU And NATO Launch Joint Taskforce On Threats To Key Sectors
- ECB’S VILLEROY: RATE HIKES SHOULD BE LIMITED IN SIZE AND NUMBER
- SCHNABEL: 50 BPS ECB HIKE NEXT WEEK NOT OFF TABLE: POLITICO
US TSYS: Holding Near Early Friday Highs
- Front month Treasury futures extended early gains after April Dallas Fed manufacturing index comes out much weaker than expected -23.4 vs. -12.0 est. June 10Y futures marking a session high of 114-31 (+16), a tick away from Friday's early session high of 114-15.
- Despite the rebound today, 10Y futures remain vulnerable and recent activity appears to be a bear flag - a bearish continuation pattern that reinforces the current downtrend. The contract has recently traded through the 20- and 50-day EMAs and pierced 114-00. The move lower opens 113-23, a Fibonacci retracement.
- On the upside, initial firm resistance is at 115-00, Friday’s high. A break and close above this level would ease the current bearish threat.
- Otherwise, Monday was a quiet start to the week with the Federal Reserve in policy blackout through May 4.
- Focus on Tuesday's Data Calendar with House Price Index, New Home Sales, Consumer Confidence and US Tsy $42B 2Y Note auction (91282CGX3) in the afternoon.
SHORT TERM RATES
SOFR Benchmark Settlements:
- 1M +0.00692 to 4.97744 (+.07746 total last wk)
- 3M +0.00028 to 5.06803 (+.08487 total last wk)
- 6M +0.00003 to 5.08837 (+.14532 total last wk)
- 12M -0.00519 to 4.87728 (+.19820 total last wk)
US DOLLAR LIBOR: Latest settlements:
- O/N +0.00100 to 4.80771%
- 1M -0.00429 to 5.01614%
- 3M +0.01300 to 5.26814% */**
- 6M -0.00057 to 5.43400%
- 12M +0.01871 to 5.42771%
- * Record Low 0.11413% on 9/12/21; ** New 16Y high: 5.26500% on 4/17/23
- Daily Effective Fed Funds Rate: 4.83% volume: $114B
- Daily Overnight Bank Funding Rate: 4.81% volume: $283B
- Secured Overnight Financing Rate (SOFR): 4.80%, $1.324T
- Broad General Collateral Rate (BGCR): 4.76%, $530B
- Tri-Party General Collateral Rate (TGCR): 4.76%, $523B
- (rate, volume levels reflect prior session)
FED Reverse Repo Operation
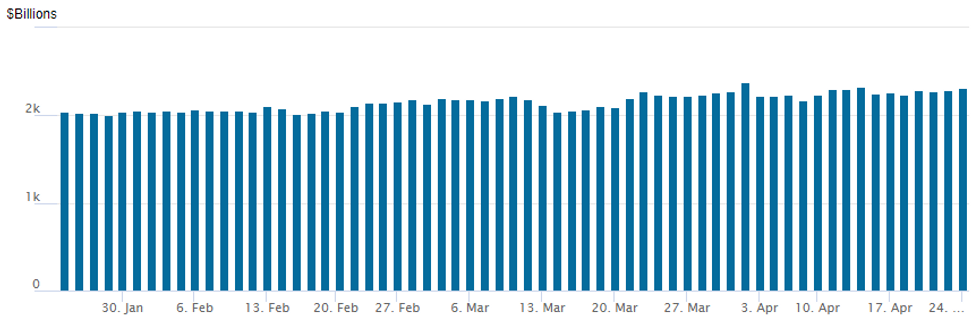
NY Federal Reserve/MNI
NY Fed reverse repo usage climbs to $2,308.538B w/ 103 counterparties, compares to prior $2,290.023B. Compares to high usage for 2023: $2,375.171B on Friday March 31, 2023; all-time record high of $2,553.716B reached December 30, 2022.
SOFR/TREASURY OPTIONS SUMMARY
Derivatives trade remained mixed Monday as underlying SOFR and Treasury futures climbed back near Early Friday highs after Dallas Fed Manufacturing Index came out lower than expected: -23.4; EST. -12.0. SOFR structures leaned toward upside calls in the second half with paper adding to some 50,000 Dec'23 SOFR call condors bought last week. Treasury options saw a handful of mixed 5- and 10Y structures in the first half while a large July 10Y strangle was sold vs. June strangles. Salient trade:- SOFR Options:
- Update, over 17,500 (Block/screen/Pit) SFRZ3 96.00/96.50/97.00/97.50 call condors, 5.5 adds to +50k bought last week
- +10,000 SFRZ3 95.50/96.00/96.50 call flys, 4.5
- Update, 8,000 SFRU3 94.62/94.75/95.37/95.50 iron condors ref 95.14
- 1,800 SFRN3 94.87/95.00/95.12 put flys ref 95.145
- 1,000 SFRM3 94.43/94.68/95.25/95.50 call condors
- over +11,600 SFRM3 94.75 puts, 6.5 ref 94.91 to -.905
- Block, 5,000 SFRZ3 96.00/96.50/97.00/97.50 call condors, 5.5 ref 95.51
- Treasury Options:
- Block, -20,000 TYN3 112.5/119 strangles, 5 over TYM3 113/117 strangles
- 5,000 FVM3 108.5/109 put spds, 14 ref 109-17
- 3,000 TYM3 116/117 call spds, 19 ref 114-28.5
- 4,300 FVM3 111.25/112.25 call spds ref 109-14
- 4,000 TYM3 117.5/119.5 call spds ref 114-24.5
- 4,000 Wed/wkly 114.75 straddles 3 over TYM3 111/117.5 strangles
- 40,000 wk4 10Y 113.25/114.25 put spds, 10 ref 114-23.5
- 10,500 wk4 10Y 113.5 puts, 4 ref 114-22
- 9,000 TYM3 113.5 puts vs. 115/116.5 call spd 0.0 net ref 114-22
- over 18,200 FVM3 111 calls, 17 ref 109-11.25
- 8,600 FVM3 108 puts, 15.5-16 ref 109-08.75 to -09.5
- 2,000 TYM3 117 calls, 17 ref 114-16.5
EGBs-GILTS CASH CLOSE: Bear Flattening With Euro CPI Awaited
Short-end UK and German yields rose modestly Monday with limited movement further down the curves.
- The bear flattening came as ECB and BoE hike expectations ticked higher (ECB terminal +5bp, BoE +3bp), carrying over from last week's hawkish moves.
- But there were few macro or headline drivers to start the week (German IFO was a little better than expected), keeping Bunds and Gilts trading in tight ranges.
- ECB's Schnabel said (in an April 20 interview published today) that a 50bp May hike was "not off the table", but this would be data-dependent. This had little impact on implied rates, which had already been edging higher all session.
- German yields closed the session at the highs, with the Schnabel comments helping catalyse a bit of weakness focused on the short end.
- Villeroy's comments (may be a need for more rate hikes; hikes should be limited in size and number), came on the cash close and judging from futures don't appear to have made much of an impact.
- The undoubted focus of the week is on Friday's Euro CPI readings, which will make or break the case for 25bp vs 50bp at next week's ECB meeting.
- In the meantime, Tuesday sees an MNI event with ECB's Enria.
Closing Yields / 10-Yr Periphery EGB Spreads To Germany:
- Germany: The 2-Yr yield is up 5.6bps at 2.977%, 5-Yr is up 3.9bps at 2.56%, 10-Yr is up 2.7bps at 2.508%, and 30-Yr is up 0.9bps at 2.559%.
- UK: The 2-Yr yield is up 5.8bps at 3.804%, 5-Yr is up 3.3bps at 3.654%, 10-Yr is up 2.3bps at 3.781%, and 30-Yr is up 2.3bps at 4.12%.
- Italian BTP spread up 0.1bps at 187.2bps / Spanish down 0.5bps at 103.4bps
EGB Options: All Euribor Put Structures To Start The Week
Monday's Europe rates / bond options flow included:
- ERH4 96.12/96.00/95.87p fly, bought for 1 in 10k
- ERM3 96.375/96.00ps 1x2, bought the 1 for 6.5 in 5k
- ERZ3 96.375/96.25/96.125p fly with ERZ3 96.125/96.00/95.875p fly, bought as a strip for 2.5 in 7.5k
FOREX: Greenback Grinding Lower In Late Session, EURUSD Eyes 1.1076 High
- As we approach the APAC crossover, the USD index is fading to its worst levels of the session, now comfortably below last week’s lows. Corresponding G10 gains are being led by the Euro, which after recapturing the 1.10 handle has not looked back.
- Despite the uninspiring price action, both EURUSD and GBPUSD are pressing session highs amid the moderate bounce off the lows for equities. EURUSD now tracks 0.53% higher, keeping trend signals bullish for now. Recent weakness appears to be a correction, with price well supported above 1.0913, the 20-day EMA as well as the Apr 17 high.
- Moving average studies are in a bull mode position, highlighting an uptrend. The bull trigger is unchanged at 1.1076, Apr 14 high, a break would open 1.1127, a Fibonacci projection and 1.1185, Mar 31 2022 high.
- Furthermore, today EURJPY has broken the 2022 highs at 148.40 and the pair’s high of 148.47 represents the highest print since late 2014. With the Bank of Japan widely expected to not tweak its easy policy settings at the April 27-28 meeting, the path of least resistance for XXX/JPY looks set to remain higher.
- For EURJPY, the next topside level resides at 149.39, the 1.00 projection of the Mar 20 - 21 - Apr 6 price swing.
FX Expiries for Apr25 NY cut 1000ET (Source DTCC)
- EUR/USD: $1.0923-25(E602mln), $1.0937-50(E947mln), $1.1000(E1.2bln), $1.1020-25(E539mln), $1.1050(E1.4bln), $1.1080(E568mln), $1.1100(E2.2bln)
- USD/JPY: Y133.35($724mln)
- GBP/USD: $1.2300(Gbp628mln)
- AUD/USD: $0.6665(A$510mln), $0.6720-35(A$774mln), $0.6750-65(A$519mln), $0.6800(A$616mln)
- NZD/USD: $0.6150(N$817mln)
- USD/CNY: Cny7.00($1.8bln)
Equities Roundup: Awaiting Next Round of Earnings
- Stock indexes holding mildly mixed levels in afternoon trade, Dow shares outperforming (+9.1 at 33817.99) vs. weaker Nasdaq (-43.7 at 12028.98) while SPX Eminis holding steady (4156.75). SPX futures reversed modest early gains following notably weaker than expected Dallas Fed manufacturing index at -23.4 (cons -11.0) after -15.7.
- Equity desks awaited the next round of earnings after the close with the following stocks reporting: Ameriprise Financial Inc, Crown Holdings Inc, First Republic Bank, Alexandria Real Estate, Cadence Design Systems Inc, AGNC Investment Corp, Range Resources Corp, Cleveland-Cliffs Inc.
- Oddly, First Republic Bank (FRC) shares rallied to 16.35 high on the open (highest since March 27) ahead of the earning announcement after the bell.
- For a technical perspective, The trend outlook in S&P E-minis remains bullish and the latest move lower from the Apr 18 high is considered corrective. Support to watch lies at 4125.73, the 20-day EMA where a break is required to suggest scope for a deeper pullback - this would expose 4083.76, the 50-day EMA.
- Attention is on the 4200.00 handle where a breach would resume the uptrend and open 4205.50, Feb 16 high ahead of 4244.00, the Feb 2 high and key resistance
E-MINI S&P TECHS: (M3) Corrective Pullback
- RES 4: 4244.00 High Feb 2 and a bull trigger
- RES 3: 4223.00 High Feb 14
- RES 2: 4205.50 High Feb 16
- RES 1: 4200.00 Round number resistance
- PRICE: 4151.00 @ 1440ET Apr 24
- SUP 1: 4125.73 20-day EMA
- SUP 2: 4083.76 50-day EMA
- SUP 3: 3980.75 Low Mar 28
- SUP 4: 3937.00 Low Mar 24
The trend outlook in S&P E-minis remains bullish and the latest move lower from the Apr 18 high is considered corrective. Support to watch lies at 4125.73, the 20-day EMA where a break is required to suggest scope for a deeper pullback - this would expose 4083.76, the 50-day EMA. Attention is on the 4200.00 handle where a breach would resume the uptrend and open 4205.50, Feb 16 high ahead of 4244.00, the Feb 2 high and key resistance.
COMMODITIES: Crude Oil And Gold Chip Away At Last Wk's Declines, Helped By Softer USD
- Crude oil has seen decent intraday gains after reversing weakness through Asia hours to sit a little more than 1% higher on the day after last week’s sell-off. The USD index extending declines through the session helps with relatively few oil-specific drivers.
- Libya is to ramp up its crude oil exports in May, aiming for 1.06mbpd from the 993kbpd planned for April.
- Gasoline prices at the pump marked a modest weekly decline on Sunday, their first in four weeks -- and may have already reached their summer season peak, according to GasBuddy - more.
- WTI is +1.3% at $78.74, with a high of $79.18 poking above resistance at $79.07 (Apr 20 high) to open $81.24 (Apr 19 high). In options space, the day’s most active strikes in the CLM3 are seen in $75/bbl puts.
- Brent is +1.3% at $82.75 after a high of $82.95 poked above resistance at $82.92 (Apr 20 high) with a clearer break required to open $85.15 (Apr 19 high).
- Gold is +0.3% at $1989.37 with gains concentrating in recent hours with that aforementioned continued decline in the DXY. Resistance remains at $2015.1 (Apr 17 high).
Tuesday Data Calendar
| Date | GMT/Local | Impact | Flag | Country | Event |
| 25/04/2023 | 0600/0700 | *** |  | UK | Public Sector Finances |
| 25/04/2023 | 0600/0800 | ** |  | SE | PPI |
| 25/04/2023 | 0700/0900 | ** |  | ES | PPI |
| 25/04/2023 | 0800/1000 |  | EU | ECB Supervisory Board Chair Andrea Enria and MNI event | |
| 25/04/2023 | 0900/1000 | | UK | BOE Broadbent Speech at NIESR | |
| 25/04/2023 | 1000/1100 | ** | | UK | CBI Industrial Trends |
| 25/04/2023 | 1230/0830 | ** |  | US | Philadelphia Fed Nonmanufacturing Index |
| 25/04/2023 | 1255/0855 | ** | | US | Redbook Retail Sales Index |
| 25/04/2023 | 1300/0900 | ** | | US | S&P Case-Shiller Home Price Index |
| 25/04/2023 | 1300/0900 | ** | | US | FHFA Home Price Index |
| 25/04/2023 | 1400/1000 | *** | | US | New Home Sales |
| 25/04/2023 | 1400/1000 | *** | | US | Conference Board Consumer Confidence |
| 25/04/2023 | 1400/1000 | ** | | US | Richmond Fed Survey |
| 25/04/2023 | 1430/1030 | ** | | US | Dallas Fed Services Survey |
| 25/04/2023 | 1700/1300 | * | | US | US Treasury Auction Result for 2 Year Note |
Why MNI
MNI is the leading provider
of intelligence and analysis on the Global Fixed Income, Foreign Exchange and Energy markets. We use an innovative combination of real-time analysis, deep fundamental research and journalism to provide unique and actionable insights for traders and investors. Our "All signal, no noise" approach drives an intelligence service that is succinct and timely, which is highly regarded by our time constrained client base.Our Head Office is in London with offices in Chicago, Washington and Beijing, as well as an on the ground presence in other major financial centres across the world.