
Free Trial
Why MNI
MNI is the leading provider
of intelligence and analysis on the Global Fixed Income, Foreign Exchange and Energy markets. We use an innovative combination of real-time analysis, deep fundamental research and journalism to provide unique and actionable insights for traders and investors. Our "All signal, no noise" approach drives an intelligence service that is succinct and timely, which is highly regarded by our time constrained client base.Our Head Office is in London with offices in Chicago, Washington and Beijing, as well as an on the ground presence in other major financial centres across the world.
HIGHLIGHTS
- MN-CBOI: US DEFICIT STANDS AT $1.1T IN FIRST SIX MONTHS OF FY23
- MNI-CBOUS FEDERAL GOVERNMENT SAW $376B DEFICIT IN MARCH
- WORLD BANK CHIEF DE COS: SEES US '23 GDP EXPANDING 1.2% VS 2022'S 2.1%, Bbg
- WORLD BANK CHIEF DE COS: GLOBAL GROWTH TO SLOW TO 2% IN 2023, Bbg
Key links: MNI BRIEF: Price Views Increase For 1st Time Since Oct- NY Fed / MNI BOC WATCH: Macklem To Affirm Hold As Economy Rumbles Ahead / MNI BRIEF: BOJ's Ueda Says To Consider No More Than YCC Tweaks
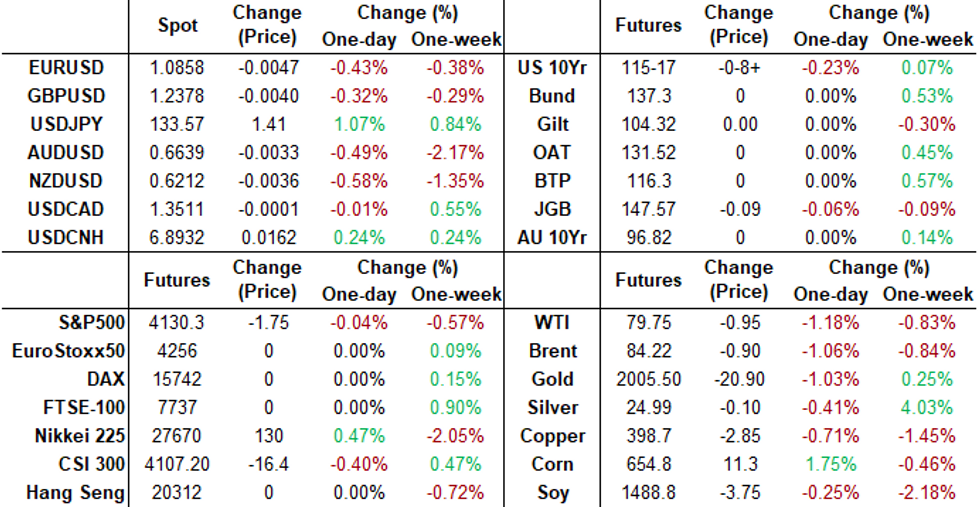
US Tsys: Yields Inch Higher Ahead Wed's CPI, FOMC Minutes
- Treasury yield climbed higher in the first half of Monday's trade, holding a narrow range through the rest of the session on generally quiet second half. Yield curves reverse early steepening, 2s10s currently -.277 at -59.294 vs. -55.765 high.
- Fed funds implied hike for May'23 at 18.4bp, Jun'23 18.8bp cumulative at 5.014%. Projected rate cuts later in the year also holding near Fri's levels with just under two 25bp cuts priced in for December: -44.1 cumulative at 4.396.
- Trade volumes were light (TYM3<720k) with much of Europe still out for an extended Easter holiday, while markets showed little reaction to FEB. WHOLESALE SALES +0.4% M/M; EST. +0.6%, INVENTORIES +0.1%; EST. 0.2% data.
- Market depth/trade volumes will likely improve tomorrow with London bank on-line, but many will be close to the sidelines ahead Wednesday's CPI (0.2% MoM est vs. 0.4% prior; 5.1% YoY est vs. 6.0% prior) and FOMC minutes for the March meeting.
- NatWest economists suspect weaker energy prices "should weigh on the headline CPI; we expect the earlier drop in energy prices should lead to about a 5% decline in gasoline component, while increases in food prices (0.3%) and the core CPI (0.434%) should not be too different than last month (0.452%)."
SHORT TERM RATES
US DOLLAR LIBOR: No settlements Monday due to ongoing London bank holiday, resume Tuesday. For reference, the levels below are from Thursday, April 6:
- O/N +0.00042 to 4.80971% (+0.00885 total last wk)
- 1M +0.01015 to 4.90029% (+0.04258 total last wk)
- 3M -0.01314 to 5.19786% (+0.00515 total last wk)*/**
- 6M -0.05471 to 5.23743% (-0.07557 total last wk)
- 12M -0.07386 to 5.12571% (-0.17958 total last wk)
- * Record Low 0.11413% on 9/12/21; ** New 16Y high: 5.22257% on 4/3/23
- Daily Effective Fed Funds Rate: 4.83% volume: $100B
- Daily Overnight Bank Funding Rate: 4.83% volume: $123B
US TSYS: Repo Reference Rates
- Secured Overnight Financing Rate (SOFR): 4.81%, $1.431T
- Broad General Collateral Rate (BGCR): 4.79%, $538B
- Tri-Party General Collateral Rate (TGCR): 4.79%, $523B
- (rate, volume levels reflect prior session)
FED Reverse Repo Operation
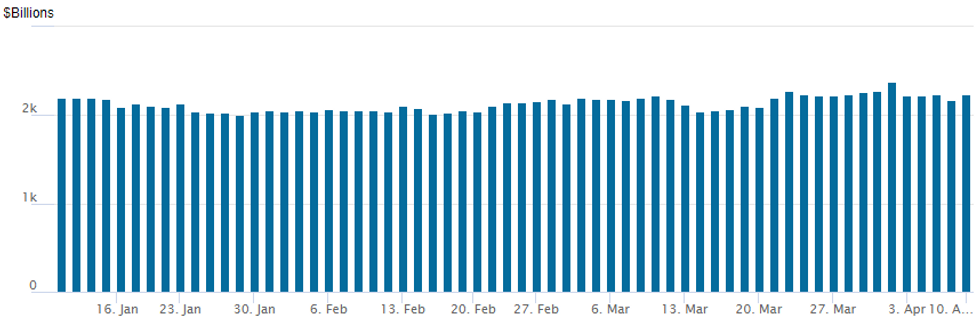
NY Federal Reserve/MNI
NY Fed reverse repo usage rebounds to $2,239.655B w/ 115 counterparties, compares to prior $2,173.663B. All-time record high of $2,553.716B reached December 30, 2022; high usage for 2023: $2,375.171B on Friday March 31, 2023
EURODOLLAR/SOFR/TREASURY OPTIONS SUMMARY
Option trades leaned bullish Monday, fading the post-jobs unwind of implied rate cuts (Dec FF appr 88bp last Wed to appr 42bp now). Ergo, looking for rate cuts to get priced back in. Markets won’t have long to see if that is the case with the next major data metric of CPI out this Wednesday.- SOFR Options:
- -20,000 SFRM4 95.75/96.50/97.25 call flys, 13.0-12.5 ref 96.55
- Block, 20,000 SFRU3 95.50/95.75 put spds, 18.0 ref 95.30
- 2,000 SFRM3 94.75/95.25 2x1 put spds,
- +5,000 SFRK3 94.62/94.75/94.87 put flys, 2.0
- 1,000 SFRJ3 94.75/94.87/95.00 put flys ref 95.045
- -5,000 SFRU 94.75/94.87 put spds 0.5 over SFRU3 95.37/95.50 call spds vs 95.35/0.10%
- 3,500 SFRU3 95.50 calls, ref 95.355
- 2,000 SFRJ3 95.00/95.25 call spds
- 2,000 OQU3 95.75/96.00 put spds, 4.5 ref 96.92
- 1,000 SFRK3 94.75/95.00/95.25 put flys
- Treasury Options:
- 15,000 TYM3 114.5/117 put over risk reversals, 5 ref 115-15.5
- 2,000 TYM3 113.5/114.5 put spds, 23 ref 115-17
- Block, 7,500 TYM3 117 calls, 14 vs. 115-14/0.20%
- 1,000 FVM3 112.5 calls 8 over FVM3 108/109 put spds ref 109-29.25
- 1,000 TYM3 113.5/118 strangles
- 4,000 TYK3 120 calls, 3 ref 115-20.5
- 2,000 FVK3 109.75 puts, 24.5 ref 110-02
- 3,600 wk2 FV 109/109.5 put spds, 6 ref 110-06.25
- 3,300 wk2 FV 109/109.75 put spds, 13 ref 110-07
- 1,800 TYM3 113 puts, 24 ref 115-29.5
- 1,500 FVM3 109.25 puts, 36 ref 110-06.25
Late Equities Roundup: FHLB Lending Drop Not Reason for Bank Bounce
- US stocks climbing off early session lows in early afternoon trade: Dow Industrials (33,540.58 +55.20) outperforming SPX Eminis (4131.5 -0.50) and Nasdaq (12,077.73 -10.23) at the moment.
- Potentially buoying stocks earlier, Bloomberg story cited FHLB data that showed a drop in lending to $37B in last week of March from $304B prior as "an early sign that the banking crisis has started to subside."
- While Financials sector lead by banks did bounce off morning lows, the FHLB data likely not the reason one analyst said "When emergencies hit, issuance soars, almost all of it is short and has to be rolled over," he explained. "As demand ebbs, FHLB lengthens its maturities and reduces reliance on constant roll-over. So, issuance NATURALLY declines after a sudden burst of unexpected demand."
- Additionally, "individual HL banks borrow more than they actually need to fund loans to members so they don't have to rely on the market every day. So, maturities fall and surplus funding reduces .. and issuance declines."
- Lastly, a drop in lending as a sign of cooling bank stress "goes against the takeaways from the borrowing data in last week's H.8 report."
- Industrials and Energy sectors continue to outperform while Communication Services and Information Technology sectors lag (Google, META and Match all weaker).
COMMODITIES
- WTI Crude Oil (front-month) down $0.92 (-1.14%) at $79.78
- Gold is down $17.34 (-0.86%) at $1990.56
Tuesday Data Calendar
| Date | GMT/Local | Impact | Flag | Country | Event |
| 11/04/2023 | 2301/0001 | * |  | UK | BRC-KPMG Shop Sales Monitor |
| 11/04/2023 | 0600/0800 | * |  | NO | CPI Norway |
| 11/04/2023 | 0900/1100 | ** |  | EU | Retail Sales |
| 11/04/2023 | 1000/0600 | ** |  | US | NFIB Small Business Optimism Index |
| 11/04/2023 | - | | EU | ECB Lagarde and Panetta in IMF/World Bank Spring Meetings | |
| 11/04/2023 | 1255/0855 | ** | | US | Redbook Retail Sales Index |
| 11/04/2023 | 1600/1200 | *** | | US | USDA Crop Estimates - WASDE |
| 11/04/2023 | 1700/1300 | *** | | US | US Note 03 Year Treasury Auction Result |
| 11/04/2023 | 1730/1330 | | US | Chicago Fed's Austan Goolsbee | |
| 11/04/2023 | 2200/1800 | | US | Philadelphia Fed's Patrick Harker |
Why MNI
MNI is the leading provider
of intelligence and analysis on the Global Fixed Income, Foreign Exchange and Energy markets. We use an innovative combination of real-time analysis, deep fundamental research and journalism to provide unique and actionable insights for traders and investors. Our "All signal, no noise" approach drives an intelligence service that is succinct and timely, which is highly regarded by our time constrained client base.Our Head Office is in London with offices in Chicago, Washington and Beijing, as well as an on the ground presence in other major financial centres across the world.
We are facing technical issues, please contact our team.
ok
Your request was sent sucessfully! Our team will contact you soon.
ok