
Why MNI
MNI is the leading provider
of intelligence and analysis on the Global Fixed Income, Foreign Exchange and Energy markets. We use an innovative combination of real-time analysis, deep fundamental research and journalism to provide unique and actionable insights for traders and investors. Our "All signal, no noise" approach drives an intelligence service that is succinct and timely, which is highly regarded by our time constrained client base.Our Head Office is in London with offices in Chicago, Washington and Beijing, as well as an on the ground presence in other major financial centres across the world.
J&J Pauses Covid-19 Vaccine Study, Triggering Defensive Flows
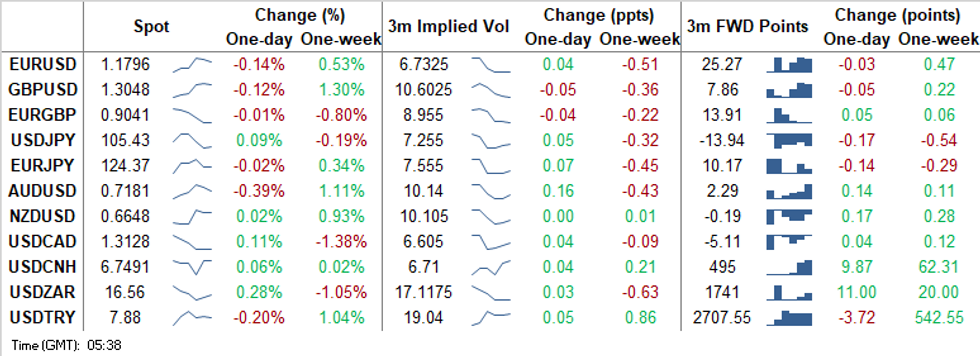
G10 FX space switched into a defensive mode as U.S. Tsys re-opened after the elongated weekend, while STAT published a report noting that J&J paused their Covid-19 vaccine study owing to an unexplained illness in one participant. AUD was the worst G10 performer, as reports outlining fresh tensions in Sino-Australian relations did the rounds, with stories re: informal ban taking focus. It is worth noting that there is A$1.0bn worth of options with strikes at $0.7100 expiring at today's NY cut. The Kiwi held up well amid AUD/NZD sales. Safe haven currencies were bid on the back of the broader risk-off mood.
- USD/CNH rallied past yesterday's high as cash Tsys re-opened/STAT published its story, which put a bid into the greenback. The rate eased off after an in-line PBoC fix and continued to trade in positive territory, but comfortably shy of highs.
- IDR led losses in Asia, ahead of today's monetary policy decision from Bank Indonesia. KRW also faced some additional headwinds as South Korea's daily coronavirus case count returned above 100.
- German ZEW Survey, U.S., German & Swedish CPIs, UK labour market report take focus today. BoE's Bailey, ECB's de Cos, Fed's Barkin & Riksbank's Ingves are set to speak.
TECHNICALS:
Bulls Pause For Breath
- RES 4: 1.2011 High Sep 1 and major resistance
- RES 3: 1.1917 High Sep 10 and 76.4% of the Sep 1 - 25 sell-off
- RES 2: 1.1859 61.8% retracement of the Sep 1 - 25 sell-off
- RES 1: 1.1831 High Oct 10 and the intraday bull trigger
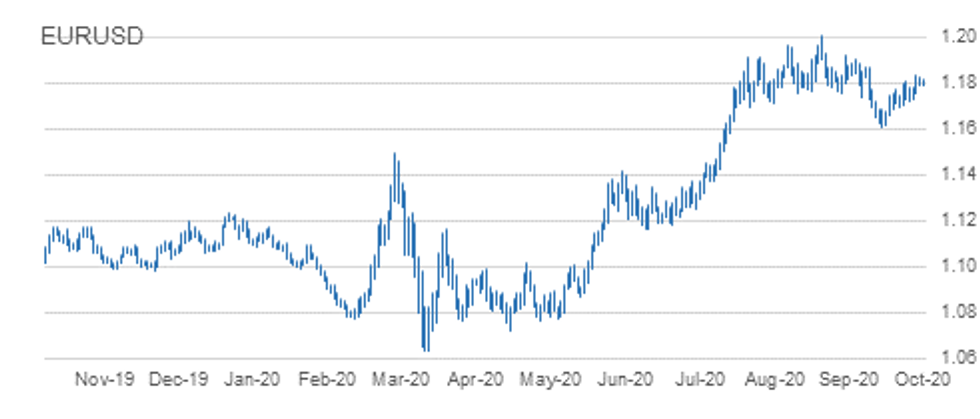
- PRICE: 1.1796 @ 05:44 BST Oct 13
- SUP 1: 1.1756/25 Low Oct 9 / Low Oct 7 and key near-term support
- SUP 2: 1.1685 Low Sep 30
- SUP 3: 1.1612/1581 Low Sep 25 and the bear trigger / Low Jul 24
- SUP 4: 1.1576 100-dma
EURUSD bulls have paused for breath with the outlook remaining bullish. The pair traded higher Friday, pushing through resistance at 1.1808, Oct 6 high. The breach reinforces S/T bullish conditions and confirms the clear break of trendline resistance drawn off the Sep 1 high. Price moved through the trendline on Oct 5. Further gains would open 1.1859 next, 61.8% of the Sep 1 - 25 sell-off. 1.1725 marks the key near-term support.
Bullish Focus
- RES 4: 1.2280 High Sep 7
- RES 3: 1.3174 61.8% retracement of the Sep 1 - 23 sell-off
- RES 2: 1.3139 Former trendline support drawn off the Mar 20 low
- RES 1: 1.3083 High Oct 12
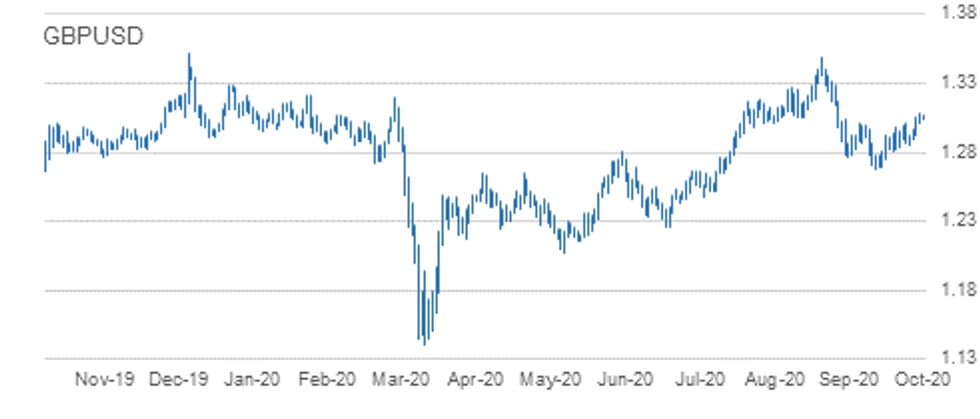
- PRICE: 1.3047 @ 05:49 BST Oct 13
- SUP 1: 1.2939/31 20- day and 50-day EMA
- SUP 2: 1.2846 Low Oct 7 and key near-term support
- SUP 3: 1.2806 Low Sep 30
- SUP 4: 1.2745 Low Sep 28
GBPUSD maintains a bullish tone and traded higher Monday. The pair cleared key resistance at 1.3007 on Oct 9, negating recent bearish signals and confirming a resumption of the current bullish cycle. 1.3079 has been achieved opening 1.3139 next. The former is a Fibonacci retracement and the latter, the former trendline support drawn off the Mar 20 low. To re-engage with any bearish themes, Cable needs to break 1.2846, Oct 7 low.
Approaching The Bear Trigger
- RES 4: 0.9220 High Sep 22 and a key near-term resistance
- RES 3: 0.9190 61.8% retracement of the Sep 11 - 28 sell-off
- RES 2: 0.9162 High Oct 7 and the bull trigger
- RES 1: 0.9132 High Oct 10
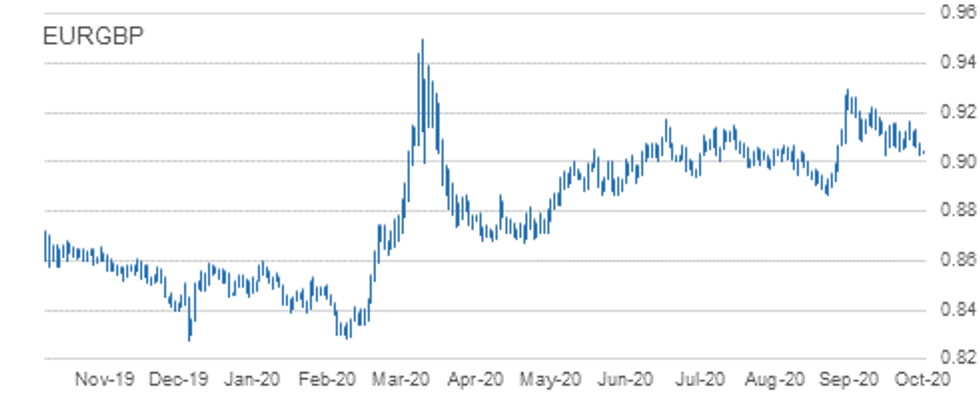
- PRICE: 0.9043 @ 05:51 BST Oct 13
- SUP 1: 0.9028 Low Oct 12
- SUP 2: 0.9025 Low Sep 28 and the bear trigger
- SUP 3: 0.9000 Round number support
- SUP 4: 0.8967 76.4% retracement of the Sep 3 - 11 rally
EURGBP failed last week to hold above trendline resistance drawn off the Sep 11 high. This suggests the cross is vulnerable to further weakness. The move lower Monday highlights this risk with key support at 0.9025 exposed, Sep 28 low. A break of this level would confirm a resumption of bearish trending conditions and open 0.8967, a retracement level. On the upside, firm resistance has been defined at 0.9062, Oct 7 high.
Corrective Pullback Extends
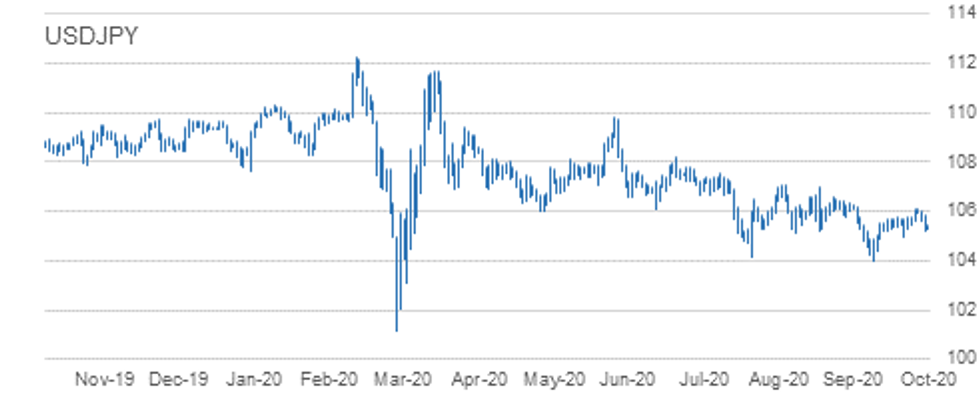
- RES 4: 106.62 Bear channel resistance drawn off the Mar 24 high
- RES 3: 106.55 High Sep 3
- RES 2: 106.11/38 High Oct 7 and the bull trigger / High Sep 8
- RES 1: 105.83 20-day EMA
- PRICE: 105.43 @ 06:00 BST Oct 13
- SUP 1: 105.24 Low Oct 12
- SUP 2: 104.94 Low Oct 2 and key near-term support
- SUP 3: 104.41 Low Sep 22
- SUP 4: 104.00 Low Sep 21 and the bear trigger
USDJPY has started this week on a softer note having found resistance last week at 106.11, Oct 7 low. Short-term weakness however is considered a correction following last week's climb. Intraday momentum studies point south however to strengthen a bearish theme, price needs to trade below key near-term support at 104.94, Oct 2 low. This would open 104.00, Sep 21 low. The bull trigger is at 106.11. A break resumes the recent uptrend.
Bullish Focus Intact Despite Pullback
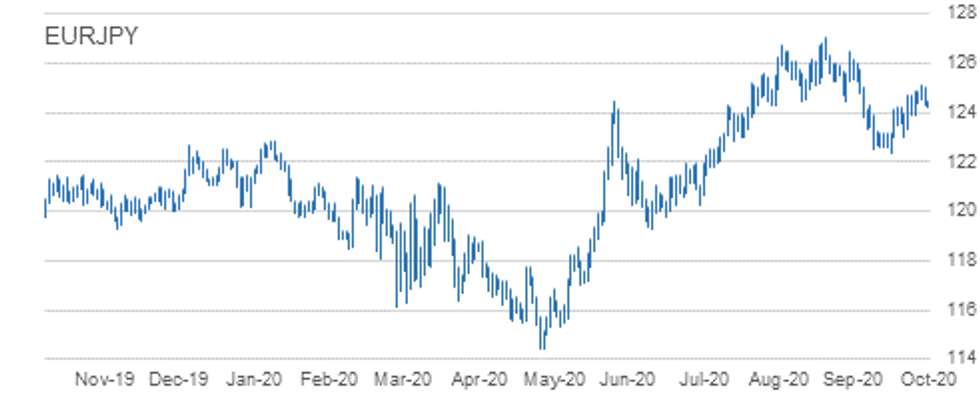
- RES 4: 127.08 High Sep 1 and primary resistance
- RES 3: 126.46 High Sep 10 and a key resistance
- RES 2: 125.77 High Sep 15
- RES 1: 125.09/28 High Oct 10 / 61.8% of the Sep 1 - 28 sell-off
- PRICE: 124.40 @ 06:05 BST Oct 13
- SUP 1: 124.12 50-day EMA
- SUP 2: 123.86 Low Oct 6
- SUP 3: 123.03 Low Sep 29 and Oct 2 and key near-term support
- SUP 4: 122.38/28 Low Sep 28 / 61.8% of the Jun 22 - Sep 1 rally
EURJPY traded lower Monday but maintains a bullish tone. The cross rallied sharply higher on Oct 5 extending the bounce off the Oct 2 low of 123.03. Furthermore, resistance at 124.25, Sep 30 high has recently been cleared and this paves the way for a climb towards 125.28 next, a Fibonacci retracement. Initial key support has been defined at 123.03, Oct 2 low. First support lies at 124.12, the 50-day EMA.
Trendline Resistance Still Intact
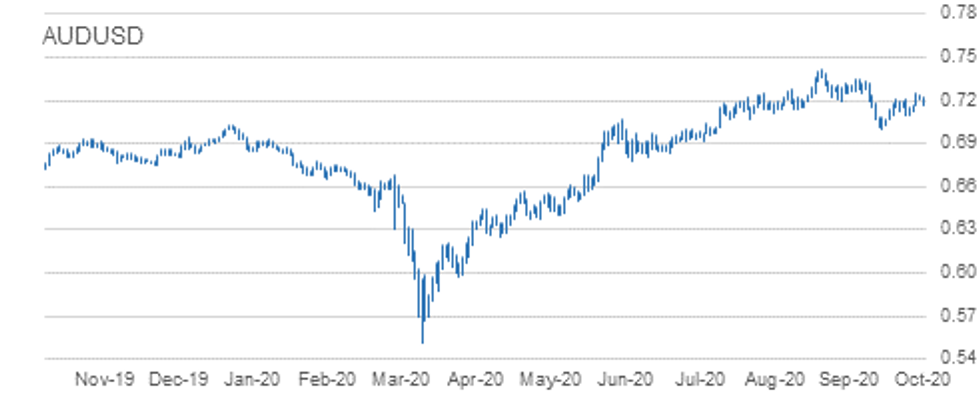
- RES 4: 0.7318 76.4% retracement September Sell-Off
- RES 3: 0.7318 High Sep 21
- RES 2: 0.7258 61.8% retracement September Sell-Off
- RES 1: 0.7243 High Oct 10 and the intraday bull trigger
- PRICE: 0.7186 @ 06:09 BST Oct 13
- SUP 1: 0.7161 Sep 9 low
- SUP 2: 0.7096 Low Oct 7 and the near-term bear trigger
- SUP 3: 0.7070 Low Sep 29
- SUP 4: 0.7006 Low Sep 25 and the bear trigger
AUDUSD rallied sharply higher Friday clearing resistance at 0.7209, Oct 1 and 6 high. This brought the pair into contact with trendline resistance drawn off the Sep 1 high. The line intersects at 0.7226 today and remains intact. A move above Friday's high of 0.7243, would confirm a breach of the line and reinforce S/T bullish conditions, opening 0.7258, a Fibonacci retracement. Initial support is 0.7161, a break would highlight a failure at the trendline.
Heavy!
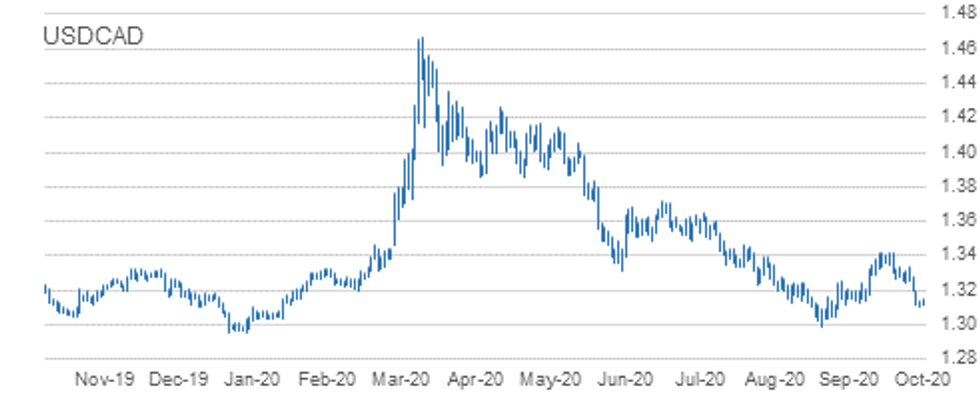
- RES 4: 1.3341 High Oct 7 and a reversal trigger
- RES 3: 1.3243 20-day EMA
- RES 2: 1.3273 High Oct 7 and key near-term resistance
- RES 1: 1.3202 Oct 9 high
- PRICE: 1.3122 @ 06:15 BST Oct 13
- SUP 1: 1.3101 Low Oct 12
- SUP 2: 1.3095 76.4% retracement of the Sep 1 - 30 rally
- SUP 3: 1.3038 Low Sep 2
- SUP 4: 1.2994 Low Sep 1
USDCAD traded lower again Monday, extending the pullback that started on Sep 30. The move lower follows the clear break last week of trendline support drawn off the Sep 1 low. Recent weakness has extended through 1.3157, a Fibonacci retracement to open the next retracement at 1.3095. Initial resistance is at Friday's high of 1.3202. Clearance of 1.3273 though, Oct 7 high is required to ease bearish pressure. Heavy!
LEVELS:
EUR/USD: MNI Key Levels
- *$1.1917/29 Sep10 high/Sep02 high
- *$1.1900 Sep15 high
- *$1.1883 Upper 1.0% 10-dma envelope
- *$1.1872/76/82 Sep21 high/Upper Boll Band (2%)/Sep16 high
- *$1.1857/70 100-mma/Cloud top
- *$1.1817/27/31 Intraday high/Oct12 high/Oct09 high
- *$1.1801/02 55-dma/50-dma
- *$1.1794 ***CURRENT MARKET PRICE 05:03BST TUESDAY***
- *$1.1791/87 Intraday low/Oct12 low, 100-hma
- *$1.1782/67 Oct08 high, Oct07 high/200-hma
- *$1.1756/55 Oct09 low/21-dma
- *$1.1736/33/25 38.2% 1.3993-1.0341/Oct08 low/Oct07 low
- *$1.1696/85 Oct02 low/Sep30 low, Sep25 high
- *$1.1661/48 Sep29 low/Lower 1.0% 10-dma env
- *$1.1625/12 Lower Boll Band (2%)/Sep25 low
GBP/USD: MNI Key Levels
- *$1.3266 Cloud top
- *$1.3220 Upper 2.0% 10-dma envelope
- *$1.3207 Upper Bollinger Band (3%)
- *$1.3173 Sep08 high
- *$1.3103 Upper Bollinger Band (2%)
- *$1.3083/90 Oct12 high/Upper 1.0% 10-dma env
- *$1.3072 Intraday high
- *$1.3041 ***CURRENT MARKET PRICE 05:11BST TUESDAY***
- *$1.3037/32/28 Intraday low/55-dma/50-dma
- *$1.3007/06 Sep16 high, Oct06 high/Oct12 low
- *$1.2977/70 100-hma/Oct08 high
- *$1.2952 200-hma, 50-mma
- *$1.2940 200-wma
- *$1.2923 Oct09 low
- *$1.2896/92 21-dma/Oct08 low
EUR/GBP: MNI Key Levels
- *Gbp0.9203 Upper Bollinger Band (2%)
- *Gbp0.9169/81 Upper 1.0% 10-dma env/Sep24 high
- *Gbp0.9156/57/62 Oct01 high/Sep30 high/Oct07 high
- *Gbp0.9132 Oct09 high
- *Gbp0.9116/23 21-dma/Oct08 high
- *Gbp0.9079/84/86 Oct12 high/100-hma/200-hma
- *Gbp0.9046/57/59 Intraday high/55-dma/50-dma
- *Gbp0.9043 ***CURRENT MARKET PRICE 05:16BST TUESDAY***
- *Gbp0.9037/36/28 100-dma/Intraday low/Oct12 low
- *Gbp0.9025/21 Sep28 low/Cloud top, Lower Boll Band (2%)
- *Gbp0.8987/75 Lower 1.0% 10-dma env/Lower Boll Band (3%)
- *Gbp0.8967 Sep08 low
- *Gbp0.8952 Cloud base
- *Gbp0.8925 Sep07 low
- *Gbp0.8900/96 Sep04 low/Lower 2.0% 10-dma env
USD/JPY: MNI Key Levels
- *Y106.04 Oct09 high
- *Y105.85 Oct12 high
- *Y105.79 50-dma
- *Y105.76 100-hma
- *Y105.75 55-dma
- *Y105.66 200-hma
- *Y105.44/53 Intraday high/Cloud Tenkan Sen
- *Y105.42 ***CURRENT MARKET PRICE 05:24BST TUESDAY***
- *Y105.38/28/24 21-dma/Intraday low/Oct12 low
- *Y105.21 Sep24 low
- *Y105.20 Aug28 low
- *Y105.19 Cloud Kijun Sen
- *Y105.10 Aug19 low
- *Y105.08 Sep22 high
- *Y104.94 Oct02 low
EUR/JPY: MNI Key Levels
- *Y125.03 Oct12 high
- *Y124.93 Fibo 38.2% 149.78-109.57
- *Y124.85 50-dma
- *Y124.81 55-dma
- *Y124.80 50-mma
- *Y124.66 100-hma
- *Y124.42/48 Cloud Kijun Sen/Intraday high
- *Y124.37 ***CURRENT MARKET PRICE 05:28BST TUESDAY***
- *Y124.33/19 200-hma/Intraday low
- *Y124.06 Cloud Tenkan Sen
- *Y123.88 21-dma
- *Y123.87 Oct07 low
- *Y123.86 Oct06 low
- *Y123.45 Cloud base
- *Y123.31 100-dma
AUD/USD: MNI Key Levels
- *$0.7334/40 Sep18 high/Sep03 high
- *$0.7316/24/31 Upper 2.0% 10-dma env/Sep21 high/Upper Boll Band (2%)
- *$0.7264/73 50-mma/Cloud top
- *$0.7245/54 200-wma/Sep17 low
- *$0.7235/43/44 Sep22 high, Oct12 high/Oct09 high/Upper 1.0% 10-dma env
- *$0.7206/10/18 55-dma/50-dma/Intraday high
- *$0.7183 100-hma
- *$0.7181 ***CURRENT MARKET PRICE 05:33BST TUESDAY***
- *$0.7175/74/65 21-dma/200-hma/Intraday low
- *$0.7161 Oct09 low
- *$0.7124/23 Cloud base/Oct08 low
- *$0.7101/96 Lower 1.0% 10-dma env/Oct07 low
- *$0.7083/70 100-dma/Sep29 low
- *$0.7029 Sep28 low, Lower 2.0% 10-dma env
- *$0.7007/06 Lower Boll Band (2%)/Sep25 low
USD/CAD: MNI Key Levels
- *C$1.3264/73 21-dma/Oct08 high
- *C$1.3238/42 200-hma/Oct06 low
- *C$1.3220/34 50-dma/55-dma
- *C$1.3202 Oct09 high
- *C$1.3187 100-hma
- *C$1.3161/63/75 Cloud base/200-wma/50-mma
- *C$1.3145 Intraday high
- *C$1.3127 ***CURRENT MARKET PRICE 05:37BST TUESDAY***
- *C$1.3110/01 Intraday low/Oct12 low
- *C$1.3098/87 Lower 1.0% 10-dma env/Sep08 low
- *C$1.3082 Lower Bollinger Band (2%)
- *C$1.3038 Sep02 low
- *C$1.2994/89 Sep01 low/Lower Boll Band (3%)
- *C$1.2976/66 Jan08 low/Lower 2.0% 10-dma env
- *C$1.2957/52 YTD Jan07 low/Dec31-2019 low
Why MNI
MNI is the leading provider
of intelligence and analysis on the Global Fixed Income, Foreign Exchange and Energy markets. We use an innovative combination of real-time analysis, deep fundamental research and journalism to provide unique and actionable insights for traders and investors. Our "All signal, no noise" approach drives an intelligence service that is succinct and timely, which is highly regarded by our time constrained client base.Our Head Office is in London with offices in Chicago, Washington and Beijing, as well as an on the ground presence in other major financial centres across the world.