
Why MNI
MNI is the leading provider
of intelligence and analysis on the Global Fixed Income, Foreign Exchange and Energy markets. We use an innovative combination of real-time analysis, deep fundamental research and journalism to provide unique and actionable insights for traders and investors. Our "All signal, no noise" approach drives an intelligence service that is succinct and timely, which is highly regarded by our time constrained client base.Our Head Office is in London with offices in Chicago, Washington and Beijing, as well as an on the ground presence in other major financial centres across the world.
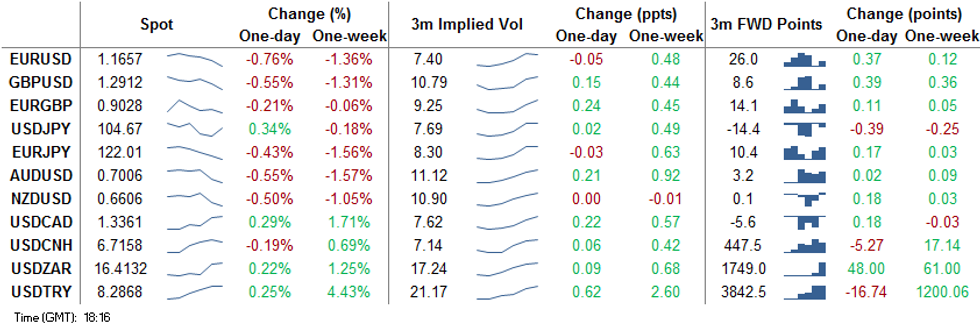
Greenback Extends Strength, ECB Flags Dec Policy Tweak
The ECB rate decision was seen by markets as a placeholder for December's likely more critical meeting. Lagarde and the executive board stopped just short of pre-announcing another stimulus package before the end of the year, with the governing council seen waiting for an update to economic projections and further national fiscal aid before composing such a 'recalibration' of policy. This prompted EUR to lag, and USD to outperform into the Thursday close.
Greenback strength may have also carried an element of pre-setting ahead of October month-end Friday. Equity underperformance this week has prompted the bulk of month-end models to signal USD demand into the Friday close.
Preliminary GDP data from France, Germany, the Eurozone and Canada take focus Friday and are expected to echo the pattern seen in Thursday's US GDP release - showing a firm, but insufficient bounceback from the lockdown-induced slumps suffered in Q2. October MNI Chicago PMI data also crosses. ECB's Mersch, de Guindos & Weidmann speak post-rate decision.
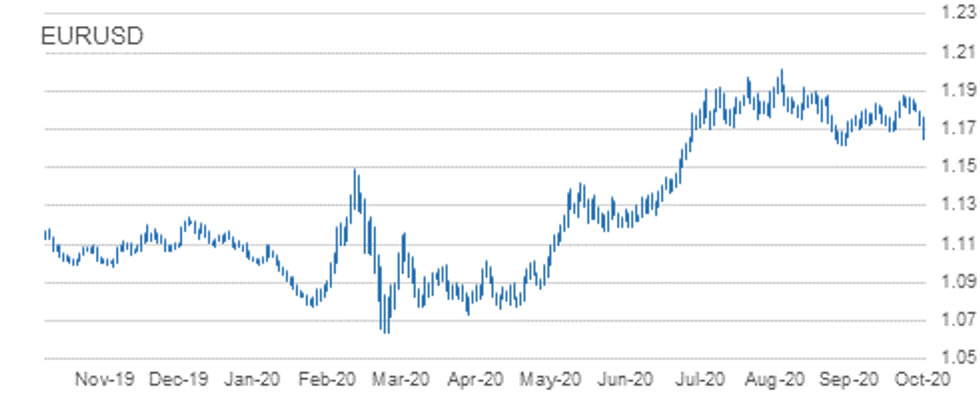
EUR/USD TECHS: Key Trendline Support Cleared
- RES 4: 1.1881 High Oct 21 and the bull trigger
- RES 3: 1.1839 High Oct 27
- RES 2: 1.1798 High Oct 28
- RES 1: 1.1759 Intraday high
- PRICE: 1.1658 @ 16:33 GMT Oct 29
- SUP 1: 1.1655 Low Oct 29
- SUP 2: 1.1612 Low Sep 25 and the bear trigger
- SUP 3: 1.1576 0.764 proj of Sep 1 - 25 sell-off from Oct 21 high
- SUP 4: 1.1541 Low Jul 23
EURUSD came under considerable pressure Thursday and has confirmed a clear breach of its short-term trendline support drawn off the Sep 28 low. The clear break, confirmed by a move below Wednesday's low of 1.1718 as well as key support at 1.1689, Oct 15 low strengthens the bearish case. This opens 1.1612, Sep 25 low and the primary bear trigger. Initial resistance is at 1.1759, Thursday's intraday high.
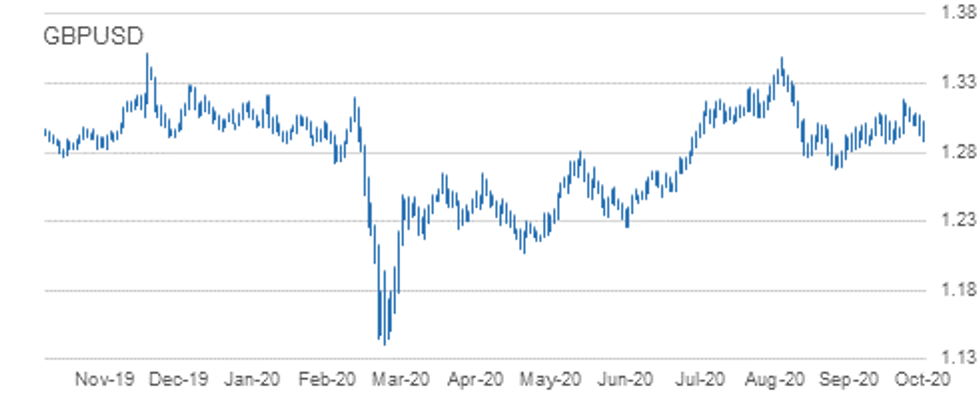
GBP/USD TECHS: Bearish Pressure Firms
- RES 4: 1.3280 Former trendline support drawn off the Mar 20 low
- RES 3: 1.3264 2.0% 10-dma envelope
- RES 2: 1.3177 High Oct 21 and the bull trigger
- RES 1: 1.3080 High Oct 27
- PRICE: 1.2908 @ 16:36 GMT Oct 29
- SUP 1: 1.2881 Low Oct 29
- SUP 2: 1.2863 Low Oct 14 and key near-term support
- SUP 3: 1.2806 Low Sep 30
- SUP 4: 1.2794 76.4% retracement of the Sep 23 - Oct 21 rally
GBPUSD fell well through Wednesday's low on broad-based USD strength. This reaffirms the bearish threat, which continues to dominate following recent weakness and Wednesday's move lower. The print below 1.2940 suggests scope for a deeper corrective pullback exposing 1.2863, Oct 14 low and a key support. Price action has defined initial resistance at 1.3080, Oct 27 high. A move back above this hurdle would ease bearish pressure and open 1.3177.
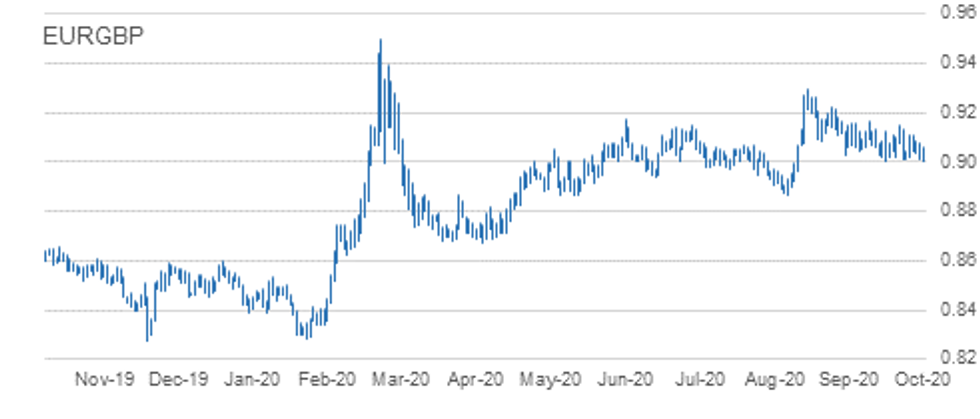
EUR/GBP TECHS: Tests Key Support
- RES 4: 0.9220 High Sep 22
- RES 3: 0.9158/62 1.0% 10-dma envelope / High Oct 7
- RES 2: 0.9149 Oct 20 high
- RES 1: 0.9107 High Oct 23
- PRICE: 0.9032 @ 16:39 GMT Oct 29
- SUP 1: 0.9007 Low Oct 14 / 29 and bear trigger
- SUP 2: 0.8967 76.4% retracement of the Sep 3 - 11 rally
- SUP 3: 0.8925 Low Sep 7
- SUP 4: 0.8900 Low Sep 4
EURGBP is trading close to recent lows. The outlook remains bearish following the sharp sell-off on Oct 21. Attention is on 0.9007, Oct 14 and 29 low, the near-term bear trigger. A break of 0.9007 would confirm a resumption of the downtrend that started Sep 11 and expose 0.8967, a retracement. Key S/T resistance has been defined at 0.9149, Oct 20 high. Clearance of this level would undermine bearish conditions.
USD/JPY TECHS: Shallow Bounce
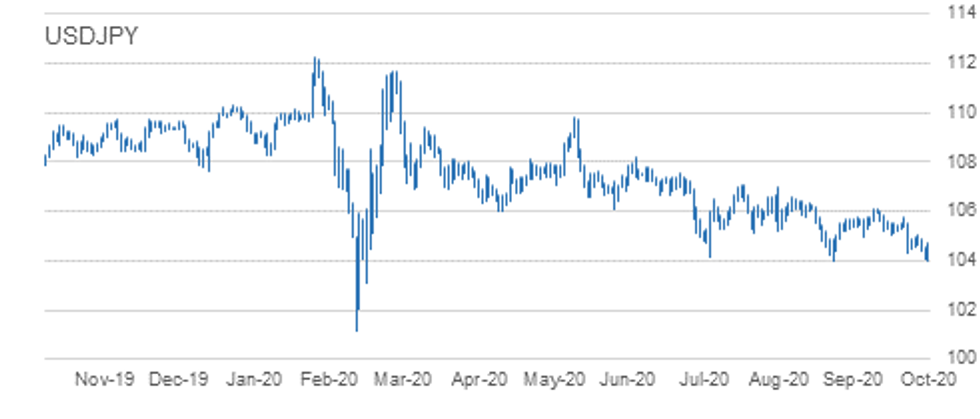
- RES 4: 105.75 High Oct 20
- RES 3: 105.53 High Oct 21 / 50-dma
- RES 2: 105.06 High Oct 26 and key near-term resistance
- RES 1: 104.71 High Oct 29
- PRICE: 104.65 @ 16:42 GMT Oct 29
- SUP 1: 104.00 Low Sep 21 and the bear trigger
- SUP 2: 103.67 76.4% retracement of the Mar 9 - 24 rally
- SUP 3: 103.09 Low Mar 12
- SUP 4: 102.02 Low Mar 10
Having traded softer for much of the week, USDJPY bounced slightly Thursday, but the recovery is, so far, insufficient to counter the bearish outlook. To the downside, a number of important supports have been cleared and attention is on the key 104.00 handle, Sep 21 low. Clearance of 104.00 would suggest scope for a deeper USD sell-off within the bear channel drawn off the Mar 24 high. Firm resistance is at 105.06.
EUR/JPY TECHS: Erodes Key Support Levels
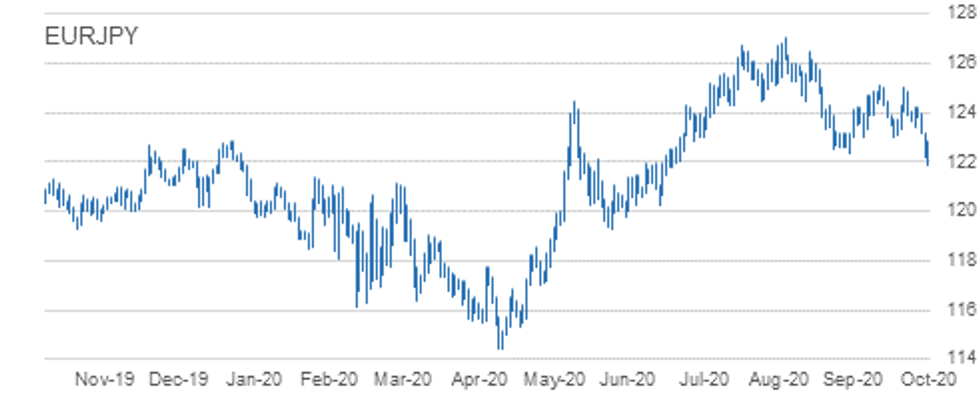
- RES 4: 125.00/09 High Oct 20 and Oct 9
- RES 3: 124.23 High Oct 23 and 26
- RES 2: 123.84 20-day EMA
- RES 1: 123.19 High Oct 28
- PRICE: 122.17 @ 16:46 GMT Oct 29
- SUP 1: 121.90 Low Oct 29
- SUP 2: 121.82 Low Jul 15 / 16
- SUP 3: 121.50 0.764 proj of Sep 1 - 28 decline from Oct 9 high
- SUP 4: 120.70 Low Jul 13
This week, EURJPY cleared support at 123.03/02 as well as 122.38, Sep 28 low. This undermines the recent bullish outlook and instead signals a likely resumption of the downleg that started on Sep 1. Scope is seen for weakness towards 121.82 - levels not seen since July. 121.50, a Fibonacci projection has also appeared on the radar. Initial resistance is at 123.19, the Wednesday high.
AUD/USD TECHS: Cracks September Low
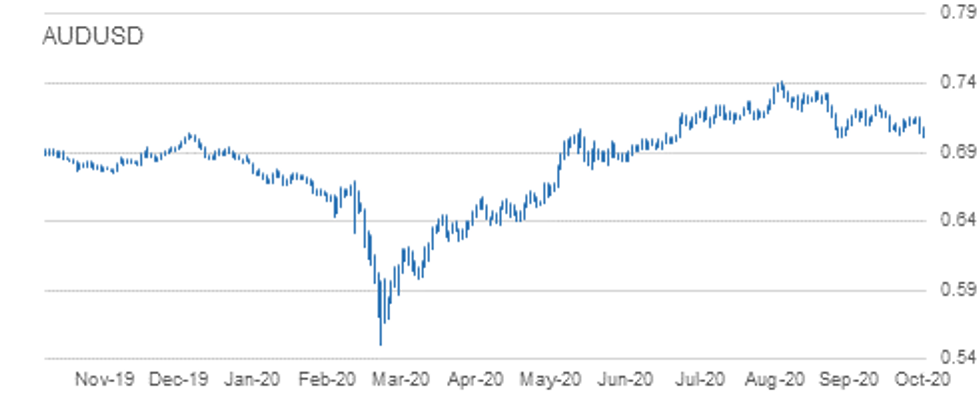
- RES 4: 0.7324 High Sep 21
- RES 3: 0.7258 61.8% retracement of the Sep 1 - 25 decline
- RES 2: 0.7243 High Oct 10 and a key resistance
- RES 1: 0.7151/58 Trendline drawn off the Sep 1 high / High Oct 23
- PRICE: 0.7015 @ 16:47 GMT Oct 29
- SUP 1: 0.7002 Low Oct 29
- SUP 2: 0.6965 23.6% retracement of the Mar - Sep Rally
- SUP 3: 0.6947 2.0% 10-dma envelope
- SUP 4: 0.6823 50% 2018 - 2020 Sell Off
AUDUSD outlook is bearish. The pair pulled further away from trendline resistance drawn off the Sep 1 high, falling to new multi-month lows in the process. Trendline resistance rests at 0.7151 and represents a key hurdle for bulls. This resistance line was tested Wednesday and capped gains. While the trendline holds, a bearish theme remains intact, which was strengthened Thursday with the fall through 0.7006, Sep 25 low. A trendline breach would signal a reversal and open 0.7243, Oct 10 high.
USD/CAD TECHS: Adds to Recent Rally
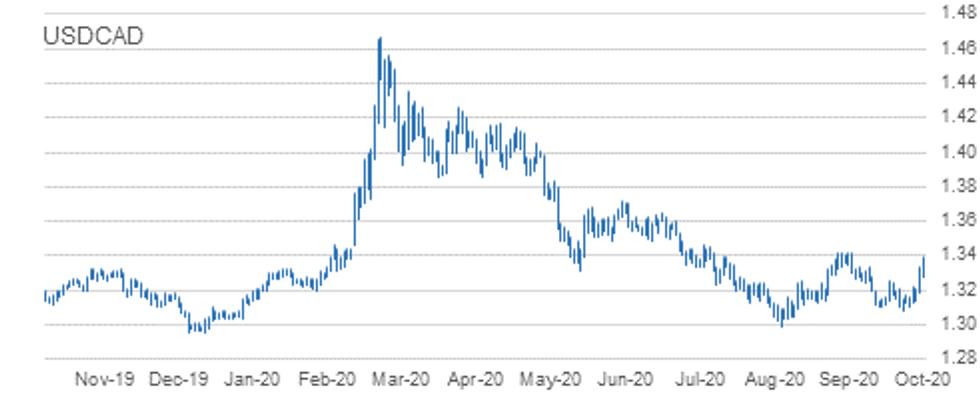
- RES 4: 1.3545 200-dma
- RES 3: 1.3450 2.0% 10-dma envelope
- RES 2: 1.3421 High Sep 30 and primary resistance
- RES 1: 1.3390 High Oct 29
- PRICE: 1.3349 @ 16:54 GMT Oct 29
- SUP 1: 1.329 High Oct 15 and recent breakout level
- SUP 2: 1.3180 Low Oct 28
- SUP 3: 1.3109/3081 Low Oct 23 / Low Oct 21 and the bear trigger
- SUP 4: 1.3047 Low Sep 7
USDCAD started the week on a firm note, which extended further Thursday. This cemented the break of key S/T resistance at 1.3259, Oct 15 high as well as 1.3341, Oct 7 high. This signals scope for a climb towards 1.3421, Sep 30 and primary resistance. Initial firm support is seen at Wednesday's low of 1.3180. A break of this level is required to undermine the developing bullish tone.
EUR/USD: MNI KEY LEVELS
- *$1.1878 Upper Bollinger Band (2%)
- *$1.1851/55 Jun14-2018 high/100-mma
- *$1.1815 Sep24-2018 high
- *$1.1804/05 Cloud top/200-hma
- *$1.1796 55-dma
- *$1.1785/88 100-hma/50-dma
- *$1.1772 21-dma
- *$1.1757/59 Sep27-2018 high/Intraday high
- *$1.1736 Fibo 38.2% 1.3993-1.0341
- *$1.1668/69 Lower Boll Band (2%), Cloud base/Lower 1.0% 10-dma env
- *$1.1664 ***CURRENT MARKET PRICE 18:20GMT THURSDAY***
- *$1.1651/50 Sep28-2018 high/100-dma, Intraday low
- *$1.1621 Oct16-2018 high
- *$1.1615/14 Lower Boll Band (3%)/Down Trendline from Jul18-2008
- *$1.1613 161.8% swing $1.1497-1.1309
- *$1.1570 Jan10-2019 high
- *$1.1551 Lower 2.0% 10-dma envelope
- *$1.1540 Jan11-2019 high
- *$1.1490 Jan15-2019 high
- *$1.1450/48 Jan29-2019 high/Mar20-2019 high
- *$1.1437/33 Mar21-2019 high/Lower 3.0% 10-dma env
GBP/USD: MNI KEY LEVELS
- *$1.3080 May08-2019 high
- *$1.3041 May13-2019 high
- *$1.3026 Intraday high, 200-hma
- *$1.3012/14 100-hma/55-dma
- *$1.2999/00 61.8% 1.3381-1.2382/50-dma
- *$1.2991 May10-2019 low
- *$1.2979/81 21-dma/Cloud top
- *$1.2970 May14-2019 high
- *$1.2960 Cloud base
- *$1.2946/50 200-wma/50-mma
- *$1.2916 ***CURRENT MARKET PRICE 18:20GMT THURSDAY***
- *$1.2904 May14-2019 low
- *$1.2882/81 50% 1.3381-1.2382/Intraday low
- *$1.2875/71 Lower 1.0% 10-dma env/100-dma
- *$1.2852 May16-2019 high
- *$1.2842 Lower Bollinger Band (2%)
- *$1.2833/31 Feb12-2019 low/Jan21-2019 low
- *$1.2825 Jan16-2019 low
- *$1.2813/10 May21-2019 high/61.8% 1.1841-1.4377
- *$1.2784 Jun25-2019 high
- *$1.2772 Lower Bollinger Band (3%)
EUR/GBP: MNI KEY LEVELS
- *Gbp0.9160 Upper Bollinger Band (3%)
- *Gbp0.9154 Upper 1.0% 10-dma envelope
- *Gbp0.9130/33/34 Upper Boll Band (2%)/Cloud top/Sep11-2017 high
- *Gbp0.9108 Jan03-2019 high
- *Gbp0.9079 Cloud base
- *Gbp0.9069/70 50-dma/21-dma
- *Gbp0.9062/63/65 Jan11-2019 high/200-hma/55-dma
- *Gbp0.9057/59 100-hma/Intraday high
- *Gbp0.9048/51/52 Jul16-2019 high/Jul17-2019 high/100-dma
- *Gbp0.9039 Jul18-2019 high
- *Gbp0.9030 ***CURRENT MARKET PRICE 18:20GMT THURSDAY***
- *Gbp0.9010/07 Jul10-2019 high/Lower Boll Band (2%)
- *Gbp0.9006/05 Intraday low/Jul23-2019 high
- *Gbp0.9000 Jul22-2019 high
- *Gbp0.8976/73 Lower Boll Band (3%)/Lower 1.0% 10-dma env
- *Gbp0.8953 Jul23-2019 low
- *Gbp0.8921 Jul02-2019 low
- *Gbp0.8902 200-dma
- *Gbp0.8882 Lower 2.0% 10-dma envelope
- *Gbp0.8874/73/72 Jun19-2019 low/Jun20-2019 low/Jun12-2019 low
- *Gbp0.8865 Fibo 61.8% 0.9108-0.8473
USD/JPY: MNI KEY LEVELS
- *Y105.77 Cloud top
- *Y105.55 55-dma
- *Y105.51 50-dma
- *Y105.30 Cloud base
- *Y105.24 21-dma
- *Y105.07 Cloud Kijun Sen
- *Y104.89 Cloud Tenkan Sen
- *Y104.87 Jan03-2019 low
- *Y104.80 200-hma
- *Y104.73 Intraday high
- *Y104.71 ***CURRENT MARKET PRICE 18:20GMT THURSDAY***
- *Y104.57/56 100-hma/Mar26-2018 low
- *Y104.22 Lower Bollinger Band (2%)
- *Y104.03 Intraday low
- *Y104.00 YTD low
- *Y103.94 200-mma
- *Y103.83 Lower 1.0% 10-dma envelope
- *Y103.72 Lower Bollinger Band (3%)
- *Y102.78 Lower 2.0% 10-dma envelope
- *Y101.73 Lower 3.0% 10-dma envelope
- *Y101.20 Nov09-2016 low
EUR/JPY: MNI KEY LEVELS
- *Y123.18 Jun11-2019 high
- *Y123.11 Fibo 50% 118.71-127.50
- *Y123.08 Fibo 38.2% 126.81-120.78
- *Y123.01 Jun12-2019 high
- *Y122.88 Intraday high
- *Y122.56 Jun13-2019 high
- *Y122.42 Lower Bollinger Band (2%)
- *Y122.38 Lower 1.0% 10-dma envelope
- *Y122.23 Jul12-2019 high
- *Y122.13 Jun17-2019 high
- *Y122.13 ***CURRENT MARKET PRICE 18:20GMT THURSDAY***
- *Y122.07 Fibo 61.8% 118.71-127.50
- *Y121.95 Fibo 50% 94.12-149.78
- *Y121.92 Jun20-2019 high
- *Y121.90 Intraday low
- *Y121.85 Jul15-2019 high
- *Y121.84 100-wma
- *Y121.69 Lower Bollinger Band (3%)
- *Y121.42 Jul15-2019 low
- *Y121.15 200-dma
- *Y121.14 Lower 2.0% 10-dma envelope
AUD/USD: MNI KEY LEVELS
- *$0.7140 Apr16-2019 low
- *$0.7128 21-dma
- *$0.7116 Apr12-2019 low
- *$0.7110/12 Apr10-2019 low/100-dma
- *$0.7096/01 200-hma/100-hma
- *$0.7088 Apr08-2019 low
- *$0.7076 Intraday high
- *$0.7069/73 Apr30-2019 high/Mar29-2019 low
- *$0.7053/57 Apr02-2019 low/Jul22-2019 high
- *$0.7044/48 Jul16-2019 high/May07-2019 high, Jul04-2019 high
- *$0.7023 ***CURRENT MARKET PRICE 18:20GMT THURSDAY***
- *$0.7019/15 Lower 1.0% 10-dma env/Lower Boll Band (2%)
- *$0.7002 Intraday low
- *$0.6985 Jan03-2019 low
- *$0.6971/67 Jul12-2019 low/Jun11-2019 high
- *$0.6959 Lower Bollinger Band (3%)
- *$0.6948 Lower 2.0% 10-dma envelope
- *$0.6909 Jun19-2019 high
- *$0.6895 100-wma
- *$0.6879/77 Jun20-2019 low/Lower 3.0% 10-dma env
- *$0.6855 Jun19-2019 low
USD/CAD: MNI KEY LEVELS
- *C$1.3452 Jun04-2019 high
- *C$1.3431/32 Jun06-2019 high/Jun18-2019 high
- *C$1.3425 Upper Bollinger Band (3%)
- *C$1.3407 Fibo 61.8% 1.3565-1.3151
- *C$1.3390 Intraday high
- *C$1.3383 Jun19-2019 high
- *C$1.3376/77 50% 1.4690-1.2062/100-wma
- *C$1.3358 Fibo 50% 1.3565-1.3151
- *C$1.3351 Upper Bollinger Band (2%)
- *C$1.3345 Jun12-2019 high
- *C$1.3338 ***CURRENT MARKET PRICE 18:20GMT THURSDAY***
- *C$1.3334/29 100-dma/Upper 1.0% 10-dma env
- *C$1.3328 Fibo 38.2% 1.2783-1.3665
- *C$1.3320 Cloud top
- *C$1.3309 Fibo 38.2% 1.3565-1.3151
- *C$1.3300 Jun13-2019 low
- *C$1.3286 Jun20-2019 high
- *C$1.3278 Intraday low
- *C$1.3226/24 Jun10-2019 low, 100-hma/50% 1.2783-1.3665, Cloud base
- *C$1.3207/05/04 21-dma/55-dma/50-dma
- *C$1.3185 200-hma
Expiries for Oct30 NY cut 1000ET (Source DTCC)
EUR/USD: $1.1700(E628mln), $1.1750-54(E1.5bln), $1.1800(E2.2bln), $1.1850(E1.7bln), $1.1870-75(E573mln), $1.1925(E570mln), $1.1950(E1.7bln-EUR calls)
USD/JPY: Y103.00($870mln), Y104.00($1.3bln), Y104.50($2.5bln), Y104.80-85($1.6bln), Y104.95-105.00($1.1bln), Y106.00-05($2.2bln)
GBP/USD: $1.3100-10(Gbp543mln)
EUR/JPY: Y123.50-55(E562mln)
AUD/JPY: Y77.45(A$1.2bln)
AUD/USD: $0.7180-00(A$1.4bln)
AUD/NZD: N$1.0695-00(A$752mln), N$1.0750(A$1.2bln)
USD/CAD: C$1.3025($1.1bln), C$1.3150($1.3bln), C$1.3225-30($626mln)
Larger Option Pipeline
EUR/USD: Nov03 $1.1900-05(E1.4bln)
USD/JPY: Nov03 Y105.45-49($1.3bln); Nov04 Y105.00($1.1bln); Nov05 Y106.06-09($1.6bln)
EUR/JPY: Nov05 Y124.50(E1.1bln)
GBP/USD: Nov02 $1.3100(Gbp1.2bln), $1.3150(Gbp911mln)
EUR/GBP: Nov02 Gbp0.8900(E2.1bln-EUR puts), Gbp0.9000(E1.4bln)
AUD/USD: Nov02 $0.7140-45(A$1.9bln)
USD/CNY: Nov03 Cny6.5334($1.2bln); Nov05 Cny6.75($1.0bln), Cny6.80($1.9bln), Cny6.85($1.3bln)
Why MNI
MNI is the leading provider
of intelligence and analysis on the Global Fixed Income, Foreign Exchange and Energy markets. We use an innovative combination of real-time analysis, deep fundamental research and journalism to provide unique and actionable insights for traders and investors. Our "All signal, no noise" approach drives an intelligence service that is succinct and timely, which is highly regarded by our time constrained client base.Our Head Office is in London with offices in Chicago, Washington and Beijing, as well as an on the ground presence in other major financial centres across the world.