
Why MNI
MNI is the leading provider
of intelligence and analysis on the Global Fixed Income, Foreign Exchange and Energy markets. We use an innovative combination of real-time analysis, deep fundamental research and journalism to provide unique and actionable insights for traders and investors. Our "All signal, no noise" approach drives an intelligence service that is succinct and timely, which is highly regarded by our time constrained client base.Our Head Office is in London with offices in Chicago, Washington and Beijing, as well as an on the ground presence in other major financial centres across the world.
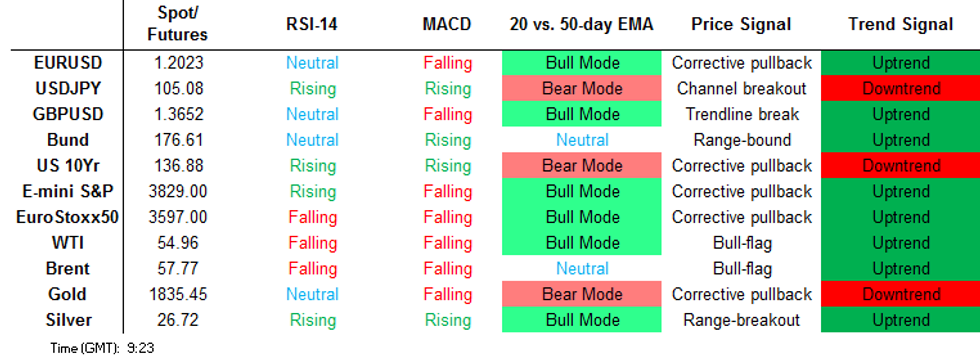
Tech Focus: Price Signal Summary - EURUSD Cracks Support
In equities, E-mini S&P futures extend this week's recovery and are pressuring the 3800.00 level. The next resistance and likely near-term objective is 3823.50, Jan 28 high.
In the FX space, USDJPY is holding onto recent gains and pressuring the 105.00 handle. The recent break of the channel resistance drawn off the Mar 24 high and 104.40, Nov 11 high, paves the way for a climb towards 105.16, Nov 13 high and 105.68, Nov 11 high. The latter level is a key resistance.
- EURUSD is softer and has this morning traded through support at 1.2054, Jan 18 low. The break confirms a resumption of the corrective downtrend and opens 1.2011, Sep 1 high and a former breakout level. The 1.2000 handle is exposed too.
- EURGBP is softer too and is pressuring the 0.8800 handle. Scope is seen for weakness towards 0.8759, the May 12, 2020 low.
On the commodity front, Gold directional triggers are the resistance at $1875.2, Jan 21 high and the support at $1831.5, Jan 27 low. Silver surged higher yesterday but is under pressure today. Further weakness would open $27.073, the 50% retracement of the Jan 18 - Feb 1 rally. Volatility is likely to remain elevated. Oil contracts are firm. Brent (J1) has cleared resistance at $57.31, Jan 13 high to confirm a resumption of the broader uptrend. This opens $58.59, 76.4% of the Jan - Apr 2020 sell-off (cont). WTI (H1) has also resumed its underlying uptrend and targets $55.00 next, a round number resistance.
In the FI space:- Bunds (H1) have probed support at 176.89/88, Jan 29 low and a trendline drawn off the Jan 12 low. This exposes 176.63 next, Jan 22 low.
- Gilts (H1) are softer too and approaching key support at 133.55, Jan 12 low.
FOREIGN EXCHANGE
EURUSD TECHS: Eyeing The 1.2000 Psychological Handle
- RES 4: 1.2230/85 High Jan 11 / 8
- RES 3: 1.2190 High Jan 22 and a key resistance
- RES 2: 1.2156 High Jan 29
- RES 1: 1.2103 50-day EMA
- PRICE: 1.2042 @ 05:55 GMT Feb 3
- SUP 1: 1.2012/11 Low Feb 2 / High Sep 1 and a former breakout level
- SUP 2: 1.2000 Psychological round number
- SUP 3: 1.1976 50.0% retracement of the Nov 4 - Jan 6 rally
- SUP 4: 1.18797 2.0% 10-dma envelope
EURUSD traded lower again yesterday. Importantly, the pair has cleared the Jan 18, 1.2054 low and hit new 2021 lows. This confirms a resumption of the downleg that started off the Jan 6 high and opens 1.2011, Sep 1 high and the psychological 1.2000 handle. A breach of 1.2000 would signal scope for 1.1976, a Fibonacci retracement. Clearance of 1.2190, Jan 22 high is required to reinstate a bullish theme. Initial firm resistance is at 1.2156.
GBPUSD TECHS: Consolidating
- RES 4: 1.3935 High Apr 27, 2018
- RES 3: 1.3804 High Apr 30, 2018
- RES 2: 1.3773 High May 1, 2018
- RES 1: 1.3759 High Jan 27 and the bull trigger
- PRICE: 1.3655 @ 06:03 GMT Feb 3
- SUP 1: 1.3610 Low Jan 26
- SUP 2: 1.3526/20 Low 50-day EMA / Low Jan 18 and key support
- SUP 3: 1.3505 Low Jan 12
- SUP 4: 1.3452 Low Jan 11
GBPUSD is consolidating. The pair maintains a bullish stance. Last week's high print of 1.3759 on aJan 27, reinforces bullish conditions and maintains the current bullish price sequence of higher highs and higher lows. Attention is on 1.3773 next, May 1 2018 high. Near-term firm support has been defined at 1.3520, Jan 18 low. A breach would signal scope for a deeper short-term sell-off and expose 1.3452, Jan 11 low. Initial support lies at 1.3610, Jan 26.
EURGBP TECHS: 0.8800 Remains Under Pressure
- RES 4: 0.9093 High Dec 29
- RES 3: 0.9085 High Jan 6
- RES 2: 0.8950/96 50-day EMA / High Jan 12
- RES 1: 0.8891/0.8925 20-day EMA / High Jan 18 and key resistance
- PRICE: 0.8820 @ 06:18 GMT Feb 3
- SUP 1: 0.8796 Low Feb 2
- SUP 2: 0.8764 1.0% 10-dma envelope
- SUP 3: 0.8759 Low May 12, 2020
- SUP 4: 0.8676 2.0% 10-dma envelope
EURGBP reaffirmed the bearish case Tuesday as the cross printed a new 2021 low. Further weakness is seen likely with the 0.8800 handle still under pressure. A clear break of this level would open 0.8759, the May 12 low from last year. Moving average studies are pointing south reinforcing current trend conditions. On the upside, 0.8925, Jan 18 high remains a firm resistance. A break of this level is required to ease the bearish pressure.
USDJPY TECHS: Holding Onto Recent Gains
- RES 4: 106.05 1.50 proj of the Jan 6 - 11 rally from the Jan 21 low
- RES 3: 105.68 High Nov 11 and a key resistance
- RES 2: 105.34 Upper 3.0% Bollinger Band
- RES 1: 105.17 High Feb 2 / 1.0% 10-dma envelope
- PRICE: 105.03 @ 06:22 GMT Feb 3
- SUP 1: 104.40 High Jan 11 and recent breakout level
- SUP 2: 103.78 Former channel top drawn off the Mar 2020 high
- SUP 3: 103.33 Low Jan 21
- SUP 4: 103.28/02 61.8% and 76.4 % of the Jan 6 - 11 rally
USDJPY outlook is unchanged. Bullish conditions remain intact following last week's price developments and the pair is holding onto recent gains. On Jan 27 USDJPY cleared a bear channel resistance drawn off the Mar 2020 high. Resistance at 104.40 gave way on Jan 28, confirming a resumption of the uptrend that started Jan 6 and this reinforces the significance of the channel breakout. The focus is on 105.68, Nov 11 high. Support is at 104.40.
EURJPY TECHS: Corrective Pullback
- RES 4: 128.39 High Dec 20. 2018
- RES 3: 127.88 0.618 projection of May - Jun rally from Oct 30 low
- RES 2: 127.49/50 High Jan 7 / High Mar 1, 2019
- RES 1: 127.34 High Jan 29
- PRICE: 126.45 @ 06:28 GMT Feb 3
- SUP 1: 126.27 Low Feb 2 and the 20-day EMA
- SUP 2: 125.60 Low Jan 27
- SUP 3: 125.09 Low Jan 18
- SUP 4: 124.87 100-DMA
The EURJPY bullish tone remains intact despite trading softer again yesterday. Last week's strength reinforces the current positive theme with attention on key resistance at 127.49, Jan 7 high. A break of this hurdle would confirm a resumption of the broader uptrend that has been in place since early May 2020. This would open 127.88 initially, a Fibonacci projection. On the downside, initial support is at 126.27, the 20-day EMA.
AUDUSD TECHS: Probes The 50-day EMA
- RES 4: 0.7917 High Mar 14, 2018 and a key resistance
- RES 3: 0.7885 High Mar 15. 2018
- RES 2: 0.7782/7820 High Jan 21 / High Jan 6 and the bull trigger
- RES 1: 0.7704 High Jan 29
- PRICE: 0.7611 @ 06:33 GMT Feb 3
- SUP 1: 0.7564 Low Feb 2
- SUP 2: 0.7557 Low Dec 28
- SUP 3: 0.7517 Low Dec 22
- SUP 4: 0.7462 Low Dec 21
AUDUSD maintains a bearish tone following last week's move lower and this week's extension. Scope is seen for a deeper pullback as part of a corrective cycle with momentum studies also trending down and unwinding a recent overbought reading. Attention is on the 50-day EMA. This was probed yesterday and a clear break would strengthen a bearish case and open 0.7517, Dec 22 low. On the upside, 0.7704 marks initial resistance.
USDCAD TECHS: Still Looking For Gains
- RES 4: 1.3003 2.0% 10-dma envelope
- RES 3: 1.2957 High Dec 21 and key resistance
- RES 2: 1.2915 High Dec 23
- RES 1: 1.2881 High Jan 28
- PRICE: 1.2785 @ 06:43 GMT Feb 3
- SUP 1: 1.2738 Low Jan 29
- SUP 2: 1.2686 Low Jan 27 and key near-term support
- SUP 3: 1.2635 Low Jan 22
- SUP 4: 1.2590 Low Jan 21 and major support
USDCAD is consolidating. The pair maintains a bullish stance and appears set to extend the current corrective recovery following the rebound off cycle lows at 1.2590. The recent break of resistance at 1.2799, Jan 18 high and a move through the 50-day EMA signals scope for an extension higher. Prices last week topped 1.2880, Dec 24 high exposing 1.2957, the Dec 21 high. On the downside, firm near-term support is seen at 1.2686, Jan 27 low.
FIXED INCOME
BUND TECHS: (H1) Bearish Extension
- RES 4: 178.27 High Jan 5
- RES 3: 178.12 High Jan 27 and the bull trigger
- RES 2: 177.66 High Jan 29
- RES 1: 177.39 20-day EMA
- PRICE: 176.58 @ 05:04 GMT Feb 3
- SUP 1: 176.55 Intraday low
- SUP 2: 176.34 Low Jan 12 and the bear trigger
- SUP 3: 175.84 Low Nov 11 and a key support
- SUP 4: 175.61 1.23 proj of Jan 4 - 12 sell-off from Jan 27 high
Bund futures maintain a softer tone weakening again yesterday. The contract traded through support at 176.89, Jan 29 low and a short-term trendline support at 176.88, drawn off the Jan 12 low. The break lower strengthens a bearish case and signals scope for weakness towards the important support at 176.34, Jan 12 low. Key resistance and the bull trigger has been defined at 178.12, Jan 27 high. Initial resistance is at 177.39, the 20-day EMA.
BOBL TECHS: (H1) Weakens Further
- RES 4: 135.497 76.4% retracement of the Dec 11 - Jan 12 downleg
- RES 3: 135.480 High Jan 27
- RES 2: 135.370 High Jan 29
- RES 1: 135.247 50-day EMA
- PRICE: 135.040 @ 05:11GMT Feb 3
- SUP 1: 135.000 Round number support
- SUP 2: 134.970 Low Jan 22
- SUP 3: 134.930 Low Jan 13
- SUP 4: 134.840 Low Jan 12 and a bear trigger
BOBL futures traded lower again yesterday extending the recent sell-off from 135.480, Jan 27 high. The continued weakness this week exposes support at 134.970, Jan 22 low. Clearance of this level would strengthen a bearish argument and also signal scope for a move towards the key support at 134.840, the Jan 12 low and a bear trigger. Initial resistance is seen at 135.247, the 50-day EMA.
SCHATZ TECHS: (H1) Sell-Off Threatens Triple Bottom Reversal
- RES 4: 112.390 High Dec 16
- RES 3: 112.368 61.8% retracement of the Dec 11 - 28 downleg
- RES 2: 112.335 High Jan 1
- RES 1: 112.305 High Feb 2
- PRICE: 112.275 @ 04:34 GMT Feb 3
- SUP 1: 112.270 Low Jan 25 and Low Feb 2
- SUP 2: 112.240 Low Jan 12, 21 and 22 low
- SUP 3: 112.235 Low Dec 23 and the bear trigger
- SUP 4: 112.201 0.764 proj of Dec 11 -28 sell-off from Jan 27 high
Schatz futures traded higher Jan 27 and confirmed a break of 112.330 in the process, Jan 4, 5 and 15 highs. The break also confirmed a triple bottom reversal highlighting a shift in sentiment. While this reversal pattern remains valid, the current sell-off threatens recent bullish price action. This has exposed key support at 112.235, Dec 23 low and 112.240, Jan 2, 21 and 22 low. Initial resistance is at 112.305. Key resistance is 112.365, Jan 27 high.
GILT TECHS: (H1) Eyeing Key Support
- RES 4: 135.04 61.8% retracement of the Jan 4 - 12 downleg
- RES 3: 134.95 High Jan 27/28
- RES 2: 134.57 50-day EMA
- RES 1: 134.10 High Feb 2
- PRICE: 133.75 @ Close Feb 2
- SUP 1: 133.60 Low Feb 2
- SUP 2: 133.55 Low Jan 12 and the bear trigger
- SUP 3: 133.52 Low Dec 2
- SUP 4: 133.22 1.382 projection of Dec 11 - 24 sell-off from Jan 4 high
Recent weakness in Gilt futures have erased all the gains achieved between Jan 21 - 28. A short-term trendline drawn off the Jan 12 low has also been breached and this week's move below 133.79, Jan 21 low strengthens a bearish case. Note too that moving average studies are in a bear mode reinforcing a bearish threat. Key support at 133.55, Jan 12 low has been exposed. On the upside, initial resistance is at 134.10, Feb 1 high.
BTP TECHS: (H1) Gaps Higher And Breaches A Trendline Resistance
- RES 4: 153.00 Round number resistance
- RES 3: 152.67 High Jan 8 and key resistance
- RES 2: 152.45 High Jan 11
- RES 1: 152.14 High Jan 20
- PRICE: 151.92 @ 07:33 GMT Feb 3
- SUP 1: 150.70/43 Low Feb 2 / Low Jan 26
- SUP 2: 149.57 Low Jan 22 and bear trigger
- SUP 3: 149.09 Low Nov 11 (cont)
- SUP 4: 148.82 50.0% retracement of the Sep - Jan rally (cont)
BTP futures have gapped higher at the open. Importantly, the contract is trading above a trendline resistance drawn off the Jan 8 high. The break higher alters the recent picture that appeared bearish and instead, today's gains signal scope for a stronger short-term recovery. Attention turns to 152.14, Jan 20 high where a break would expose key resistance at 152.67, Jan 8 high and a bull trigger. Initial support is at 150.70, Feb 2 low.
EQUITIES
EUROSTOXX 50 Techs: Bounce Extends
- RES 4: 3668.70 High Feb 25
- RES 3: 3657.83 High Jan 8 and the bull trigger
- RES 2: 3621.49 High Jan 25
- RES 1: 3596.20 High Feb 2
- PRICE: 3590.46 @ Close Feb 2
- SUP 1: 3545.09 Low Feb 2
- SUP 2: 3473.76 Low Jan 28 and the bear trigger
- SUP 3: 3455.94 Low Dec 22
- SUP 4: 3401.14 Low Dec 21 and a key support
EUROSTOXX 50 has rebounded this week and defined a key short-term support at 3473.76, Jan 28 low. An extension of this week's recovery would open 3621.49, the Jan 25 high and if this level is cleared, attention would turn to the key resistance and bull trigger at 3657.83, Jan 8 high would be left exposed. For bears, the index needs to clear support at 3473.49 to reinstate a bearish theme. This would open the 3400.00 level.
COMMODITIES
BRENT TECHS: (J1) Clears The January High
- RES 4: $60.00 - Round number resistance
- RES 3: $59.71 - 1.382 proj of the Apr - Aug - Nov 2020 price swing
- RES 2: $58.59 - 76.4% of the Jan - Apr 2020 sell-off (cont)
- RES 1: $58.05 - High Feb 2
- PRICE: $57.68 @ 06:39 GMT Feb 3
- SUP 1: $55.09 - 20-day EMA
- SUP 2: $54.40 - Low Jan 22
- SUP 3: $52.90 - Low Jan 6
- SUP 4: $52.18 - 50-day EMA
Brent futures started the week on a firm note and pushed higher again yesterday. Futures have cleared this year's former high of $57.31, Jan 13 high and this confirms a resumption of the broader uptrend paving the way for strength towards $58.59, a Fibonacci retracement. Key support has been defined at $54.40, Jan 22 low. A breach is required to signal a top and would allow for a deeper corrective decline.
WTI TECHS: (H1) Uptrend Remains Intact
- RES 4: $59.06 - 1.382 proj of Apr - Aug rally from the Nov 2 low
- RES 3: $57.00 - Round number resistance
- RES 2: $56.52 - 1.236 proj of Apr - Aug rally from the Nov 2 low
- RES 1: $55.26 - High Feb 2
- PRICE: $55.00 @ 07:01 GMT Feb 3
- SUP 1: $53.45 - Low Feb 2
- SUP 2: $51.44 - Low Jan 22
- SUP 3: $50.86 - Low Jan 8
- SUP 4: $49.52 - High Dec 18 and a former breakout level
WTI futures started the week on a firm note and extended gains yesterday. Importantly, futures have this week traded above former resistance at $53.94, Jan 13 high and a bull trigger. The breach of this level confirms a resumption of the underlying uptrend and paves the way for strength towards $56.52 next, a Fibonacci projection. Key support remains $51.44, Jan 22 low where a break is required to signal a top.
GOLD TECHS: Probes Support
- RES 4: $1900.3 - 61.8% retracement of the Jan 6 - 11 rally
- RES 3: $1882.0 - 50.0% retracement of the Jan 6 - 11 rally
- RES 2: $1875.7 - High Jan 29 and key resistance
- RES 1: $1864.1 - High Feb 2
- PRICE: $1838.8 @ 07:16 GMT Feb 3
- SUP 1: $1829.6 - Low Feb2
- SUP 2: $1804.7 - Low Jan 18 and key support
- SUP 3: $1800.0 - Round number support
- SUP 4: $1775.9 - Low Dec 1
Gold remains below the Jan 29 high of $1875.7 and continues to trade within a range although the metal did probe support at $1831.5 yesterday, the Jan 27 low. A clear break $1831.5 would strengthen a bearish case and undermine recent bullish price development. Furthermore, this would suggest scope for a move towards the key support at $1804.7, Jan 18 low. On the upside, clearance of $1875.7 would be bullish and open $1882.0 initially.
SILVER TECHS: Volatile And Vulnerable
- RES 4: $30.100 - High Feb 1
- RES 3: $29.053 - High Feb 2
- RES 2: $28.000 - Round number resistance
- RES 1: $27.195 - Intraday high
- PRICE: $28.073 @ 07:37 GMT Feb 2
- SUP 1: $26.287 - Low Feb 2
- SUP 2: $25.483 - 76.4% retracement of the Jan 18 - Feb 1 rally
- SUP 3: $24.700 - Low Jan 27
- SUP 4: $24.057 - Low Jan 18 and a key support
Silver traded sharply higher Monday clearing resistance at $27.931, Jan 6 high. The climb resulted in a test of $30.00 and more importantly registered a fresh trend high print of the upleg that started mid-March last year. Yesterday's price action highlights a reversal of Monday's direction and Silver remains vulnerable. Activity is volatile and further weakness would open 25.483, a Fibonacci retracement. Key resistance is at $30.100.
Why MNI
MNI is the leading provider
of intelligence and analysis on the Global Fixed Income, Foreign Exchange and Energy markets. We use an innovative combination of real-time analysis, deep fundamental research and journalism to provide unique and actionable insights for traders and investors. Our "All signal, no noise" approach drives an intelligence service that is succinct and timely, which is highly regarded by our time constrained client base.Our Head Office is in London with offices in Chicago, Washington and Beijing, as well as an on the ground presence in other major financial centres across the world.