
Why MNI
MNI is the leading provider
of intelligence and analysis on the Global Fixed Income, Foreign Exchange and Energy markets. We use an innovative combination of real-time analysis, deep fundamental research and journalism to provide unique and actionable insights for traders and investors. Our "All signal, no noise" approach drives an intelligence service that is succinct and timely, which is highly regarded by our time constrained client base.Our Head Office is in London with offices in Chicago, Washington and Beijing, as well as an on the ground presence in other major financial centres across the world.
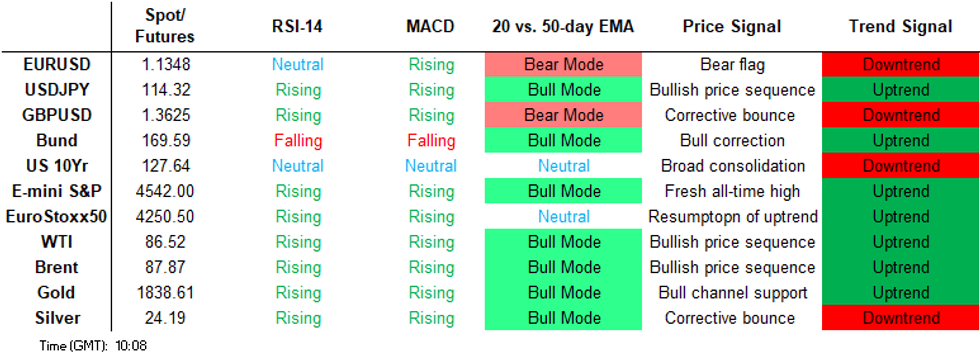
Price Signal Summary - Gold Clears Resistance
- In the equity space, S&P E-minis traded lower again yesterday. This week’s sell-off has resulted in a break of support at 4572.75, the Jan 10 low. This once again highlights the developing bearish risk and exposes 4520.25, the Dec 20 low (probed) and the next key support at 4485.75, Dec 3 low. EUROSTOXX 50 futures briefly probed support at 4216.50 yesterday, the Jan 10 low. This level has held for now and support has again surfaced below the 50-day EMA. Weakness below 4212.00, Jan 19 low, would trigger a resumption of bearish pressure. Key near-term resistance to watch is at 4324.50, Jan 13 high.
- In FX, this week’s sell-off in EURUSD has resulted in a breach of the 20- and 50-day EMAs. The sell-off threatens the recent bullish theme and suggests that at this stage, last week’s range and bear channel breakout appears to have been a false one. Further weakness would expose 1.1272, the Jan 4 low. GBPUSD trend conditions remain bullish. Attention is on the 200-dma, at 1.3735. This average has been probed, a clear break would open 1.3835, Oct 20 high. Support to watch is at 1.3553, the 20-day EMA. USDJPY remains above Friday's low of 113.49. The Jan 14 doji candle pattern continues to highlight a reversal and signals the end of the recent corrective pullback. A resumption of gains would open 115.68, Jan 11 high. Sub 113.49 levels would be bearish.
- On the commodity front, Gold traded sharply higher yesterday. This has resulted in a break of resistance at $1831.9, Jan 3 high and a bull trigger. The break reinforces bullish conditions following the recent recovery from the base of its bull channel drawn from the Aug 9, 2021 low. Attention is on $1848.0 next, 76.4% retracement of the Nov 16 - Dec 15 downleg. WTI futures remain in an uptrend and the contract traded higher once again yesterday. The focus is on $87.47, 2.00 projection of the Dec 2 - 9 - 20 price swing.
- In the FI space, Bund futures remain vulnerable. The focus is on 168.31, the Nov 2 low (cont). Gilts remain in a downtrend. This week’s move lower has resulted in a break of former support at 122.78, Jan 10 low. This confirms a resumption of the underlying downtrend. The focus is 121.61, the Nov 13 2018 low on the continuation chart.
FOREIGN EXCHANGE
EURUSD TECHS: Trading Closer To Its Recent Lows
- RES 4: 1.1692 High Oct 28, 2021
- RES 3: 1.1608 High Nov 9
- RES 2: 1.1483/1514 High Jan 14/ Low Nov 5
- RES 1: 1.1421 High Jan 18
- PRICE: 1.1349 @ 06:12 GMT Jan 20
- SUP 1: 1.1315 Low Jan 17
- SUP 2: 1.1272 Low Jan 04
- SUP 3: 1.1260/22 1.0% 10-dma envelope / Low Dec 15
- SUP 4: 1.1186/85 Low Nov 24 / Low Jul 1, 2020 and the bear trigger
EURUSD is trading closer to its recent lows. Tuesday’s sell-off resulted in a breach of the 20-day EMA, currently at 1.1354. This week’s price action threatens the recent bullish theme and suggests that at this stage, last week’s range and bear channel breakout appears to have been a false one and has failed to deliver a bullish reversal. A resumption of weakness would expose 1.1272, Jan 4 low. Key resistance is at 1.1483, Jan 14 high.
GBPUSD TECHS: 20-Day EMA Is Support
- RES 4: 1.3958 High Aug 4, 2021
- RES 3: 1.3913 High Sep 14, 2021
- RES 2: 1.3835/99 High Oct 20 and key resistance / 2.0% 10-dma env
- RES 1: 1.3735/49 200-dma / High Jan 13
- PRICE: 1.3627@ 06:18 GMT Jan 20
- SUP 1: 1.3573 Low Jan 18
- SUP 2: 1.3553/3500 20-day EMA / 50-day EMA
- SUP 3: 1.3409 Low Dec 29
- SUP 4: 1.3343 Low Dec 23
GBPUSD trend conditions remain bullish and the recent pullback is considered a correction. MA conditions are in a bull mode and last week’s breach of 1.3676, 76.4% of the Oct - Dec downleg strengthened a positive theme and the price sequence of higher highs and higher lows remains intact. The 200-dma at 1.3735 has recently provided resistance. A break would open 1.3835, Oct 20 high. Support to watch is 1.3553, the 20-day EMA.
EURGBP TECHS: Fresh Multiyear Lows
- RES 4: 0.8465 High Dec 24
- RES 3: 0.8428 50-day EMA
- RES 2: 0.8419 High Jan 3
- RES 1: 0.8379 High Jan 18 and key near-term resistance
- PRICE: 0.8330 @ 06:23 GMT Jan 20
- SUP 1: 0.8313 Low Jan 19, lowest since 2020
- SUP 3: 0.8300 Base of the multi-year broad range
- SUP 4: 0.8282/77 Low Feb’20 / Dec’19 and key bear trigger
- SUP 4: 0.8242 50% Fibonacci Retracement 2015-2020 Upleg
EURGBP traded to a fresh multiyear low of 0.8313 on Wednesday. This keeps the outlook bearish with attention on the major support and bear triggers at 0.8282/77, marking the Feb’20 and Dec’19 lows. The focus is also on the base of a broad multi-year range at 0.8300. This level represents a key pivot chart point and if cleared, would highlight an important range breakout. Initial firm resistance is at 0.8379, Tuesday’s high.
USDJPY TECHS: Recent Lows Remain Intact
- RES 4: 118.07 2.236 proj of Apr 23 - Jul 2 - Aug 4 2021 price swing
- RES 3: 117.08 2.00 proj of Apr 23 - Jul 2 - Aug 4 2021 price swing
- RES 2: 115.68/116.35 High Jan 11 / High Jan 4 and the bull trigger
- RES 1: 115.06 High Jan 18
- PRICE: 114.49 @ 06:27 GMT Jan 20
- SUP 1: 114.03 Intraday low
- SUP 2: 113.49/43 Low Jan 14 / 76.4% of the Nov 30 - Jan 4 rally
- SUP 3: 113.14 Low Dec 17
- SUP 4: 112.55 2.0% 10-dma envelope
USDJPY remains above last week’s Jan 14 low of 113.49. The recent recovery from below the 50-day EMA is a bullish development and this is reinforced by a reversal signal last Friday - a doji candle pattern. 113.49 marks a key short term support where a break is required to reinstate a bearish threat. Attention is on 115.68, Jan 11 high and the key resistance at 116.35 further out, the Jan 4 high and a bull trigger.
EURJPY TECHS: Bearish Risk Still Present
- RES 4: 132.21/56 3% Upper Bollinger Band / High Nov 4
- RES 3: 132.04 76.4% retracement of the Oct 20 - Dec 3 downleg
- RES 2: 131.60 High Jan 5 and the bull trigger
- RES 1: 130.25/131.18 20-day EMA / High Jan 18
- PRICE: 129.96 @ 06:34 GMT Jan 20
- SUP 1: 129.39 Low Jan 19
- SUP 2: 129.00 61.8% retracement of the Dec 3 - Jan 5 high
- SUP 3: 128.38 76.4% retracement of the Dec 3 - Jan 5 high
- SUP 4: 128.05 Low Dec 21
EURJPY has failed to hold onto recent highs and traded lower again Wednesday. The move down threatens the recent bullish theme and the cross has traded below its 50-day EMA. An extension lower would open 129.00 and 128.38, Fibonacci retracement levels. On the upside, key short-term resistance has been defined at 131.60, Jan 5 high, where a break is required to reinstate the recent bullish theme.
AUDUSD TECHS: Evening Star Candle Still In Play
- RES 4: 0.7393 High Nov 10
- RES 3: 0.7371 High Nov 15
- RES 2: 0.7355 Former channel base drawn from the Aug 20 low
- RES 1: 0.7257/7314 Intraday high / High Jan 13
- PRICE: 0.7230 @ 06:40 GMT Jan 20
- SUP 1: 0.7170 Low Jan 18
- SUP 2: 0.7130 Low Jan 7
- SUP 3: 0.7082 Low Dec 20 and a key support
- SUP 4: 0.7069 76.4% retracement of the Dec 3 - Jan 13 upleg
AUDUSD remains below recent highs and still appears vulnerable. The move lower represents a concern for bulls and a deeper retracement would expose 0.7130, Jan 7 low. The 3-day price action between Dec 12 -14 is an evening star candle pattern and is a strong reversal signal. A turn higher and importantly a break of 0.7314, Jan 13 high, would cancel the reversal pattern and resume the recent upleg.
USDCAD TECHS: Bearish Outlook
- RES 4: 1.2924 High Dec 22
- RES 3: 1.2814 High Jan 6 and a key resistance
- RES 2: 1.2732 High Jan 7
- RES 1: 1.2621/2633 Low Dec 31 / 20-day EMA
- PRICE: 1.2488 @ 06:44 GMT Jan 20
- SUP 1: 1.2451/48 Low Jan 19 / 76.4% of the Oct - Dec rally
- SUP 2: 1.2387 Low Nov 10
- SUP 3: 1.2328 Low Oct 29
- SUP 4: 1.2288 Low Oct 21 and a key support
USDCAD is consolidating. The outlook remains bearish though and a recent head and shoulders reversal pattern continues to highlight this risk. The break of support at 1.2621, Dec 31 low has strengthened the case for bears and has opened 1.2448, 76.4% of the Oct - Dec rally. A move through this chart point would open 1.2387, the Nov 10 low. Initial resistance is at 1.2621. A firmer short-term resistance is at 1.2633, the 20-day EMA.
FIXED INCOME
BUND TECHS: (H2) Heading South
- RES 4: 171.81 50-day EMA
- RES 3: 171.77 Low Nov 24 and recent breakout level
- RES 2: 171.00/170.85 High Jan 13 and the 20-day EMA
- RES 1: 169.92 High Jan 17
- PRICE: 169.29 @ 05:03 GMT Jan 20
- SUP 1: 168.95 Low Jan 19
- SUP 2: 168.31 Low Nov 2 (cont)
- SUP 3: 168.00 Round number support
- SUP 4: 167.69 Low Nov 1 (cont)
Bund futures traded lower again yesterday. The outlook remains bearish following this week’s resumption of the downtrend - key support at 169.34, Oct 29 low has been breached. An extension lower and a clear break strengthens bearish conditions and opens 168.84 next, a Fibonacci projection. Initial firm short-term resistance has been defined at 171.00, the Jan 13 high where a break is required to signal a short-term reversal.
BOBL TECHS: (H2) Trend Needle Points South
- RES 4: 133.530 High Dec 29
- RES 3: 133.260 High Jan 3 and 4
- RES 2: 133.110 High Jan 6 and 13 and key resistance
- RES 1: 132.730/133.070 High Jan 17 / 20-day EMA
- PRICE: 132.520 @ 08:12 GMT Jan 20
- SUP 1: 132.400 Low Jan 19
- SUP 2: 132.350 2.50 proj of the Nov 30 - Dec 8 - 20 price swing
- SUP 3: 132.253 2.618 proj of the Nov 30 - Dec 8 - 20 price swing
- SUP 4: 132.230 Low Mar 19, 2019 (cont)
Bobl futures remain bearish and the contract traded lower again yesterday. Price has breached former support at 132.620, Jan 11 low and a bear trigger. This has confirmed a resumption of the downtrend and maintains the bearish price sequence of lower lows and lower highs. The move lower opens 132.350 next, a Fibonacci projection level. On the upside, firm resistance is seen at 133.110, Jan 6 and 13 high.
SCHATZ TECHS: (H2) Remains Vulnerable
- RES 4: 112.120 High Dec 27
- RES 3: 112.080 High Jan 5
- RES 2: 112.015/020 20-day EMA / High Jan 13 / 14
- RES 1: 111.950 Congestion area between Jan 17 - 19
- PRICE: 111.935 @ 05:40 GMT Jan 20
- SUP 1: 111.890 Low Jan 19
- SUP 2: 112.861 1.618 proj of the Nov 26 - Dec 16 - 20 price swing
- SUP 3: 111.824 3.0% Lower Bollinger Band
- SUP 4: 111.800 Round number support
Trend conditions in Schatz futures remain bearish. This week’s weakness has resulted in a break of support at 111.935, the Jan 11 low and bear trigger. The move confirms a resumption of the broader downtrend and maintains a bearish price sequence of lower lows and lower highs. Attention is on 111.890 next, a Fibonacci projection. On the upside, initial firm resistance is seen at 112.020, the Jan 13 / 14 high. A break is required to ease bearish pressure.
GILT TECHS: (H2) Downtrend Accelerates
- RES 4: 124.46 High Jan 4
- RES 3: 123.87/124.17 20-day EMA / Low Nov 24
- RES 2: 123.79 High Jan 13 and a key near-term resistance
- RES 1: 122.78 Low Jan 10 and recent breakout level
- PRICE: 122.28 @ Close Jan 19
- SUP 1: 121.93 Low Jan 19
- SUP 2: 121.61 Low Nov 13 2018 (cont)
- SUP 3: 121.12 Low Nov 8 2018 (cont)
- SUP 4: 121.01 3.0% Lower Bollinger Band
Gilt futures traded sharply lower again Wednesday. Bearish trend conditions remain intact and this week’s move lower has resulted in a break of former support at 122.78, Jan 10 low. This confirms a resumption of the downtrend and maintains a bearish price sequence of lower lows and lower highs. The MA set-up is in a bear mode too. The focus is on 121.61 next, the Nov 13 2018 low (cont). Firm resistance is seen at 123.87, the 20-day EMA.
BTP TECHS: (H2) Resumes Its Downtrend
- RES 4: 148.02 High Dec 29
- RES 3: 147.39 High Jan 3
- RES 2: 146.60/80 20-day EMA / High Jan 14
- RES 1: 146.01 High Jan 17
- PRICE: 145.05 @ Close Jan 19
- SUP 1: 145.29/12 Low Nov 1 / Low Jan 10 and the bear trigger
- SUP 2: 144.90 2.618 proj of the Dec 6 - 18 - 14 price swing
- SUP 3: 144.59 2.764 proj of the Dec 6 - 18 - 14 price swing
- SUP 4: 144.00 round number support
BTP futures traded lower Wednesday. A bearish trend remains intact and further weakness is likely near-term. Futures have cleared support at 145.12, Jan 10 low to confirm a resumption of the primary downtrend and maintain a sequence of lower lows and lower highs. Moving average conditions are bearish too. The focus is on 144.08 next, a Fibonacci projection. Key short-term resistance has been defined at 146.80, Jan 14 high.
EQUITIES
EUROSTOXX 50 TECHS: (H2) Probes Key Short-Term Support
- RES 4: 4426.80 1.382 proj of the Nov 30 - Dec 8 - 20 price swing
- RES 3: 4400.00 Round number resistance
- RES 2: 4392.50 High Nov 18 and key resistance
- RES 1: 4324.50/81.50 High Jan 13 / High Jan 5 and the bull trigger
- PRICE: 4262.50 @ 05:44 GMT Jan 20
- SUP 1: 4212.00 Low Jan 19 and key support
- SUP 2: 4161.80 61.8% retracement of the Dec 20 - Jan 5 rally
- SUP 2: 4109.90 76.4% retracement of the Dec 20 - Jan 5 rally
- SUP 4: 4026.00 Low Dec 20
EUROSTOXX 50 futures remain vulnerable and price yesterday probed the key short-term support at 4216.50, Jan 10 low. A clear break of 4216.50 would once again highlight a bearish threat and confirm a resumption of the bear cycle that started Jan 5. This would expose 4161.80, a Fibonacci retracement. On the upside, resistance to watch is at 4324.50, the Nov 18 high.
E-MINI S&P (H2): Bearish Risk Still Present
- RES 4: 4854.19 0.764 proj of the Oct 1 - Nov 22 - Dec 3 price swing
- RES 3: 4808.25 High Jan 4 and the bull trigger
- RES 2: 4739.50/52.67 High Jan 12 / 76.4% of the Jan 4 - 10 sell-off
- RES 1: 4671.75 High Jan 18
- PRICE: 4548.50 @ 06:46 GMT Jan 20
- SUP 1: 4514.50 Low Dec 20 and a key support
- SUP 2: 4485.75 Low Dec 3
- SUP 3: 4464.95 61.8% retracement of the Oct 2021 - Jan rally
- SUP 4: 4420.00 Low Oct 15, 2021
S&P E-minis traded lower yesterday and remains vulnerable. The contract is again below the 50-day EMA and has cleared key S/T support at 4572.75, Jan 10 low. The break of this level highlights a clear bearish threat and exposes support at 4520.25, Dec 20 low (probed) and 4485.75, the Dec 3 low. The latter is an important bear trigger. On the upside, watch resistance at 4739.50, Jan 12 high. A break is needed to reinstate a bullish theme.
COMMODITIES
BRENT TECHS: (H2) Eyeing $90.00
- RES 4: $93.89 - 2.236 proj of the Dec 2 - 9 - 20 price swing
- RES 3: $91.29 - 2.00 proj of the Dec 2 - 9 - 20 price swing
- RES 2: $90.00 - Psychological round number
- RES 1: $89.17 - High Jan 19
- PRICE: $88.35 @ 06:50 GMT Jan 20
- SUP 1: $85.54/83.52 - Low Jan 14 / Low Jan 12
- SUP 2: $82.32/80.50 - 20-day EMA / Low Jan 10
- SUP 3: $79.39 - 50-day EMA
- SUP 4: $77.04 - Low Jan 3 and key support
Brent futures traded higher again Wednesday. Last week’s strong gains resulted in a break of key resistance at $83.69, Oct 10 high. This confirmed a resumption of the broader uptrend. The focus is on the $90.00 handle next, a Fibonacci projection. Moving average conditions remain in a bull mode, highlighting the current positive sentiment. Initial firm support to watch is at $83.52, the Jan 12 low.
WTI TECHS: (H2) Trend Conditions Remain Bullish
- RES 4: $91.58 - 2.382 proj of the Dec 2 - 9 - 20 price swing
- RES 3: $90.00 - Psychological round number
- RES 2: $87.47 - 2.00 proj of the Dec 2 - 9 - 20 price swing
- RES 1: $86.79 - High Jan 19
- PRICE: $85.73 @ 06:59 GMT Jan 20
- SUP 1: $82.93/80.55 - Low Jan 18 / Low Jan 12
- SUP 2: $78.84/77.34 - 20-day EMA / Low Jan 10
- SUP 3: $75.98/74.01 - 50-day EMA / Low Jan 3
- SUP 4: $72.22 - Low Dec 27
WTI futures remain in an uptrend and the contract traded higher again Wednesday. Last week’s rally resulted in a break of key resistance at $80.72, Oct 26 high. This strengthens a bullish case and confirms a resumption of the broader uptrend. Moving average conditions are also in a bull-mode, highlighting the current positive sentiment. The focus is on $87.47, a Fibonacci projection. Firm support is seen at $80.55, the Jan 12 low.
GOLD TECHS: Firmer Within The Bull Channel
- RES 4: $1877.2 - High Nov 16 and key resistance
- RES 3: $1871.0 - High Nov 18
- RES 2: $1849.1 - High Nov 22
- RES 1: $1848.1 - 76.4% retracement of the Nov 16 - Dec 15 downleg
- PRICE: $1839.8 @ 07:18 GMT Jan 20
- SUP 1: $1805.9 - Low Jan 18
- SUP 2: $1789.9/82.8 - Channel base from Aug 9 low / Low Jan 7
- SUP 3: $1753.7 - Low Dec 15 and a key support
- SUP 4: $1746.0 - Low Oct 6
Gold short-term conditions remain bullish and the yellow metal traded sharply higher yesterday. This has resulted in a break of resistance at $1831.9, Jan 3 high and a bull trigger. The break reinforces bullish conditions following the recent recovery from the base of its bull channel drawn from the Aug 9, 2021 low. Attention is on $1848.0 next, a Fibonacci retracement. Firm short-term support has been defined at $1805.9.
SILVER TECHS: Rally Accelerates
- RES 4: $25.406 - High Nov 16
- RES 3: $24.886 - High Nov 22
- RES 2: $23.467 - 76.4% retracement of the Nov 16 - Dec 15 sell-off
- RES 1: $24.261 - Intraday high
- PRICE: $24.155 @ 07:26 GMT Jan 20
- SUP 1: $23.391 - Low Jan 19
- SUP 2: $22.809/21.949 - Low Jan 17 / Low Jan 7
- SUP 3: $21.427/423 - Low Dec 15 / Low Sep 29 and key support
- SUP 4: $20.871 - 50.0% retracement of the Mar ‘20 - Feb ‘21 rally
Silver traded higher again yesterday. This week’s rally has resulted in a breach of key short-term resistance at $23.436, Dec 28 high and has reinforced bullish conditions following the recent bounce from $21.949, Jan 7 low. The move through $23.436 also highlights a bullish price sequence of higher highs and higher lows. Scope is seen for gains towards $23.467 next, 76.4% of the Nov - Dec sell-off. A firm support has been defined at $22.809.
Why MNI
MNI is the leading provider
of intelligence and analysis on the Global Fixed Income, Foreign Exchange and Energy markets. We use an innovative combination of real-time analysis, deep fundamental research and journalism to provide unique and actionable insights for traders and investors. Our "All signal, no noise" approach drives an intelligence service that is succinct and timely, which is highly regarded by our time constrained client base.Our Head Office is in London with offices in Chicago, Washington and Beijing, as well as an on the ground presence in other major financial centres across the world.