
Why MNI
MNI is the leading provider
of intelligence and analysis on the Global Fixed Income, Foreign Exchange and Energy markets. We use an innovative combination of real-time analysis, deep fundamental research and journalism to provide unique and actionable insights for traders and investors. Our "All signal, no noise" approach drives an intelligence service that is succinct and timely, which is highly regarded by our time constrained client base.Our Head Office is in London with offices in Chicago, Washington and Beijing, as well as an on the ground presence in other major financial centres across the world.

Price Signal Summary - Yen Remains Vulnerable
In the equity space, S&P E-minis have resumed their climb after Thursday's wobble, extending gains and trading through 4200.00. The focus is on 4239.26, 1.764 projection of the Feb 1 - Feb 16 - Mar 4 price swing. Key support is unchanged at 4110.50, Apr 21 low.
In FX, EURUSD has cleared the bear channel resistance drawn off the Jan 6 high. This reinforces the current trend and paves the way for strength towards 1.2184 next, Feb 26 high. Monday's high of 1.2117 also represents resistance and a clear break would strengthen bullish conditions. Initial support is at 1.2056, Apr 28 low. GBPUSD is firmer but remains below 1.4009, Apr 20 high. A break is required to signal scope for stronger gains. Support to watch is at 1.3824, Apr 22 low. USDCAD resumed its underlying downtrend yesterday with fresh cycle lows. The focus is on 1.2239, 1.236 projection of Jan 28 - Feb 25 - Feb 26 price swing. The Yen remains vulnerable:
o USDJPY has recently found support at 107.48. Just below trendline support drawn off the Jan 6 low. This week's recovery highlights a developing bullish theme while support at 107.48 remains intact. The focus is on 109.23, 50.0% retracement of the Mar 31 - Apr 23 sell-off.
o See chart: 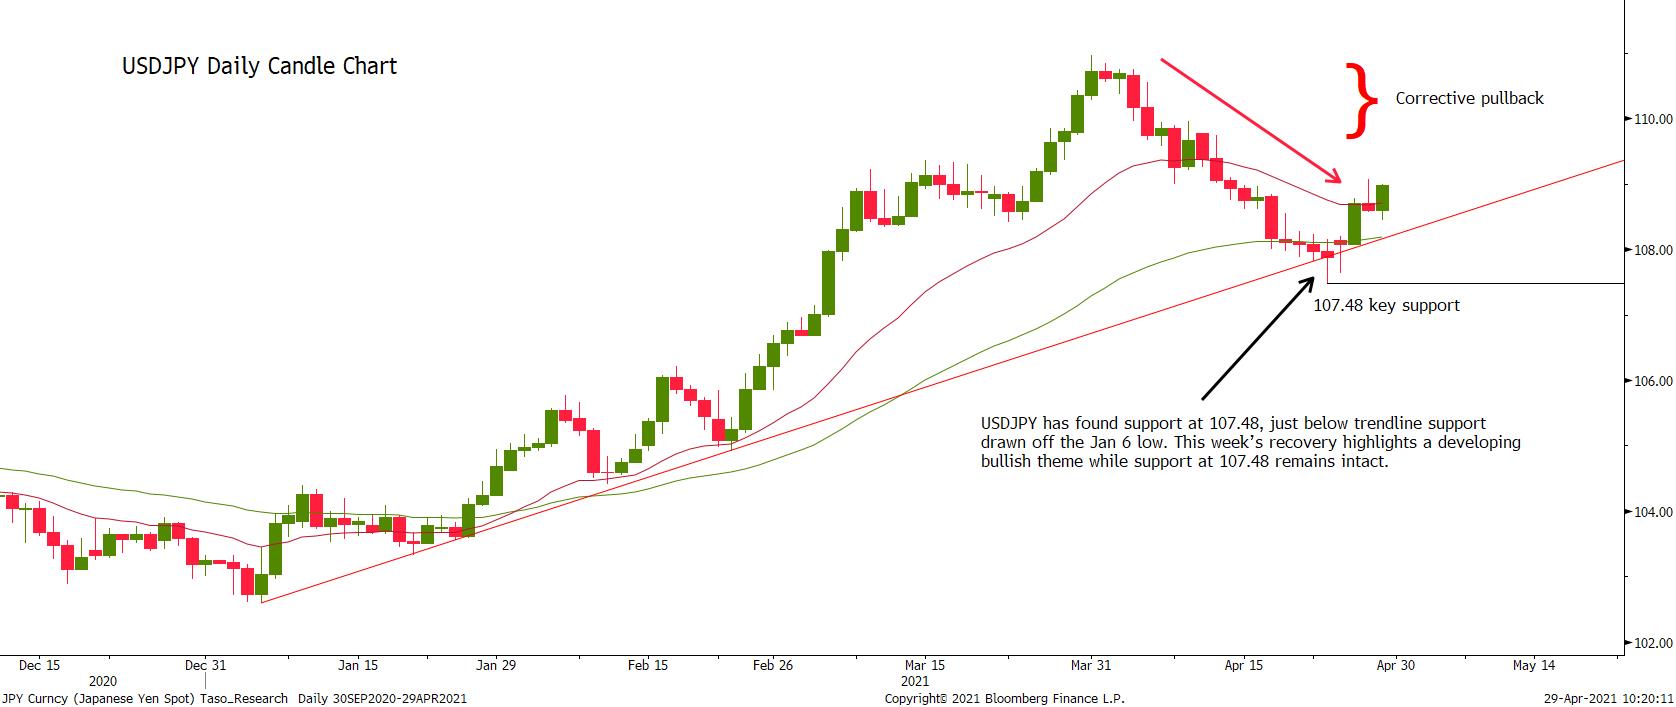
o EURJPY is climbing and has this week confirmed a resumption of the underlying uptrend. The move higher opens 132.36, 2.236 projection of the Jun - Sep - Oct 2020 price swing. The cross remains within its bull channel, drawn off the Oct 30, 2020 low.
o See chart: 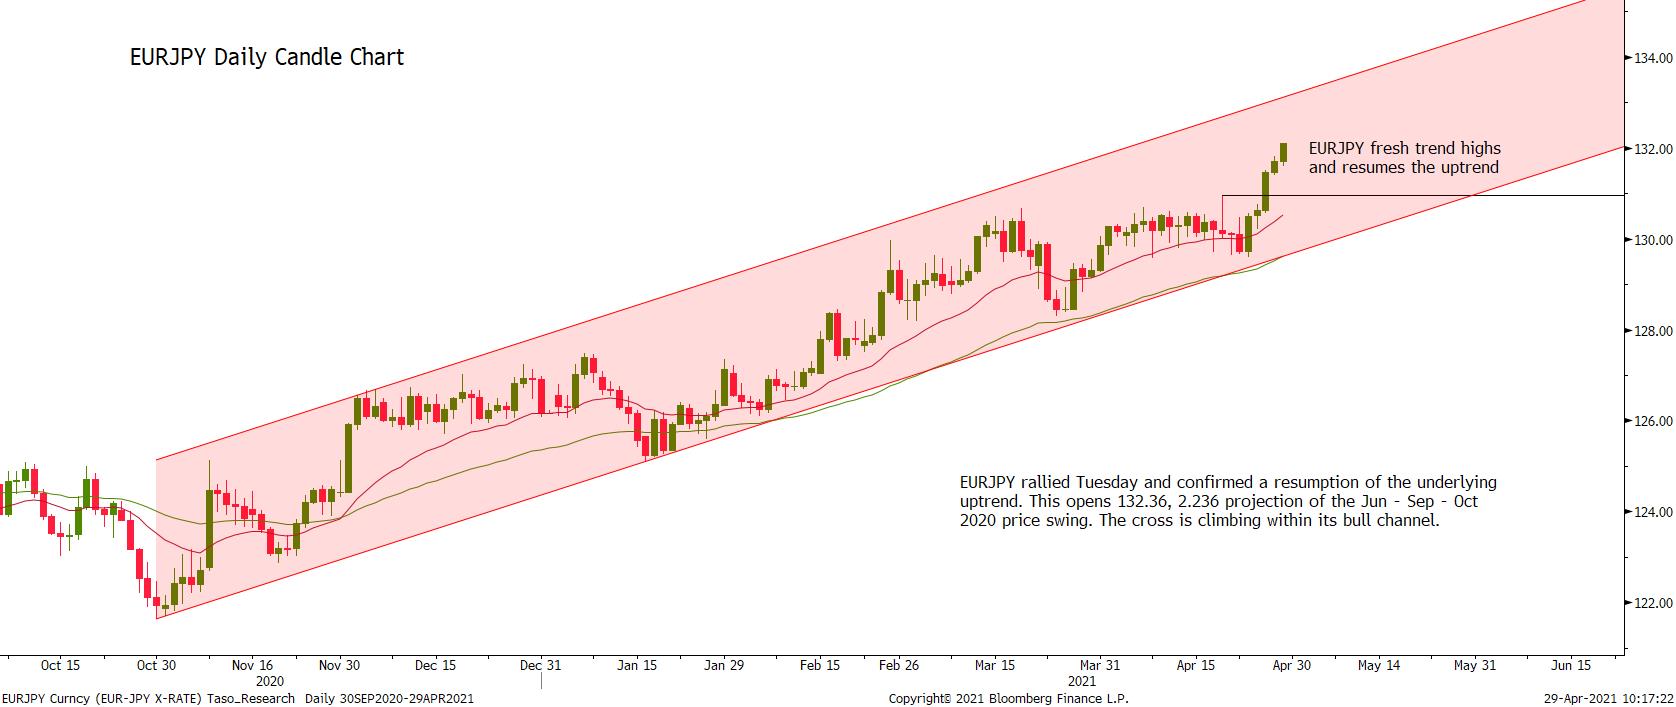
On the commodity front, Gold is consolidating. The outlook remains bullish and the focus is on $1805.7, Feb 25 high. Watch support at $1762.7, Wednesday's low. Brent (M1) is holding onto this week's gains. The focus is on resistance at 68.08, Apr 20 high. remains below last week's high. WTI (M1) has probed resistance at $64.38, Apr 20 high. A clear break would open $64.68, Mar 18 high and beyond.
In the FI space, Bunds (M1) are trading lower and have tested key support at 170.05, 76.4% of the Feb 25 - Mar 25 rally. A break would open 169.24, Feb 25 low. Gilts (M1) have traded lower and cleared initial support. The next level to watch is 127.32, Apr 1 low.
FOREIGN EXCHANGE
EURUSD TECHS: Holding Onto Gains
- RES 4: 1.2285/2304 High Jan 8 / 2.0% 10-dma envelope
- RES 3: 1.2243 High Feb 25 and a key resistance
- RES 2: 1.2184 High Feb 26
- RES 1: 1.2150 High Apr 29
- PRICE: 1.2117@ 05:52 BST Apr 30
- SUP 1: 1.2056 Low Apr 28
- SUP 2: 1.1994/43 Low Apr 22 / Low Apr 19
- SUP 3: 1.1861 Low Apr 7 and 8
- SUP 4: 1.1795 Low Apr 6
EURUSD is trading near this week's highs and maintains a bullish theme. This follows Wednesday's break of the bear channel top drawn off the Jan 6 high. The move higher confirms a resumption of the current uptrend and maintains a recovery towards 1.2184, Feb 26 high and the next key resistance at 1.2243, Feb 25 high. MA studies are again in a bull mode and this reinforces the bullish theme. Initial support lies at 1.2056, Apr 28 low.
GBPUSD TECHS: Remains Below Resistance At 1.4009
- RES 4: 1.4171 2.0% 10-dma envelope
- RES 3: 1.4103 76.4% retracement of the Feb 24 - Apr 12 downleg
- RES 2: 1.4009/17 High Apr 20 / High Mar 4
- RES 1: 1.3977 High Apr 29
- PRICE: 1.3944 @ 06:00 BST Apr 30
- SUP 1: 1.3824 Low Apr 22 and key intraday support
- SUP 2: 1.3717 Low Apr 16
- SUP 3: 1.3670/69 Low Mar 25 / Low Apr 12 and key support
- SUP 4: 1.3567 Low Apr 2
GBPUSD maintains this week's positive tone and traded higher again yesterday. The pair however remains below a recent high of 1.4009. This marks the Apr 20 high and the recent pullback from this resistance still highlights a bearish threat. Cable needs to clear 1.4009 to offset these concerns. A break higher would reinstate a bullish theme and open 1.4103, a Fibonacci retracement. S/T support has been defined at 1.3824, Apr 22 low.
EURGBP TECHS: Eyeing Resistance
- RES 4: 0.8840 High Feb 4
- RES 3: 0.8791/8845 High Feb 12 / 2.0% 10-dma envelope
- RES 2: 0.8731 High Feb 26
- RES 1: 0.8721 High Apr 26
- PRICE: 0.8693 @ 06:12 BST Apr 30
- SUP 1: 0.8658 20-day EMA
- SUP 2: 0.8589 Low Apr 19
- SUP 3: 0.8472 Low Apr 5 and the bear trigger
- SUP 4: 0.8430 Low Feb 27, 2020
EURGBP is in a consolidation mode. The cross on Apr 26 probed former resistance at 0.8719, Apr 16 high. The recovery from 0.8589, Apr 19 low signals scope for an extension higher and a clear breach of 0.8719 would confirm a resumption of the uptrend that started Apr 4. This would open 0.8731, Feb 26 high and 0.8762, a retracement level. Key support to watch is 0.8589. A break would be bearish.
USDJPY TECHS: Bulls Hold On
- RES 4: 110.97 High Mar 31 and the bull trigger
- RES 3: 110.55 High Apr 6
- RES 2: 109.96 High Apr 9
- RES 1: 109.22/23 High Apr 29 / 50% of the Mar 31 - Apr 23 sell-off
- PRICE: 108.87 @ 06:16 BST Apr 30
- SUP 1: 108.08/107.48 Low Apr 27 / Low Apr 23 and the bear trigger
- SUP 2: 106.97 Low Mar 4
- SUP 3: 106.78 50.0% retracement of the Jan - Mar rally
- SUP 4: 106.37 Low Mar 1
The USDJPY outlook remains bullish. The pair recently traded below trendline support drawn off the Jan 6 low. This week's recovery though suggests the trendline has remained intact and a bullish theme appears to be developing. Price has traded above the 20-day EMA and further gains would open 109.96, Apr 9 high. On the downside, 107.48, Apr 23 low marks the key support. A break would instead resume the recent bearish pressure.
EURJPY TECHS: Firm Within The Bull Channel
- RES 4: 133.19/30 Bull channel top / 2.0% 10-dma envelope
- RES 3: 133.13 High Sep 21, 2018 and a key resistance
- RES 2: 132.68 High Sep 27, 2018
- RES 1: 132 36/37 2.236 of Jun-Sep-Oct 2020 price swing/High Apr 29
- PRICE: 131.89 @ 06:24 BST Apr 30
- SUP 1: 130.97 High Apr 20 and recent breakout level
- SUP 2: 130.57 Low Apr 27
- SUP 3: 130.52 20-day EMA
- SUP 4: 129.68 Bull channel base drawn off the Oct 30, 2020 low
EURJPY maintains a bullish focus following this week's gains that confirmed a resumption of the uptrend. The cross has cleared 130.97, Apr 20 high and the focus is on 132.36, a Fibonacci projection. This level was tested Thursday's and a break would signal scope for further gains, as the cross appreciates within its bull channel, drawn off the Oct 30 2020 low. MA studies are in a bull mode, reinforcing current conditions. Support is at 130.57.
AUDUSD TECHS: Resistance Remains Intact
- RES 4: 0.8007 High Feb 25 and the bull trigger
- RES 3: 0.7895 76.4% retracement of the Feb 25 - Apr 1 sell-off
- RES 2: 0.7849 High Mar 18 and a reversal trigger
- RES 1: 0.7816/18 High Apr 20 / 29
- PRICE: 0.7777 @ 06:40 BST Apr 30
- SUP 1: 0.7691 Low Apr 22 and key short-term support
- SUP 2: 0.7635 Low Apr 14
- SUP 3: 0.7586 Low Apr 13
- SUP 4: 0.7532/17 Low Apr 1 and the bear trigger / Low Dec 22
AUDUSD continues to trade within its range and above 0.7691, Apr 22 low. A bullish price structure dominates following the recent break of a trendline resistance drawn off the Feb 25 high and a climb back above the neckline of a recent head and shoulders reversal pattern. Resistance is at 0.7816/18 the 18 Apr 29 highs. A clear break would open 0.7849, the Mar 18 high. Key short-term support is unchanged at 0.7691, a breach would be bearish.
USDCAD TECHS: Bear Leg Extends
- RES 4: 1.2700 High Mar 8
- RES 3: 1.2653 High Apr 21 and the bull trigger
- RES 2: 1.2491/96 High Apr 26 / 20-day EMA
- RES 1: 1.2419 High Apr 27
- PRICE: 1.2279 @ 06:52 BST Apr 30
- SUP 1: 1.2268 Intraday low
- SUP 2: 1.2239 1.236 proj of Jan 28 - Feb 25 - Feb 26 price swing
- SUP 3: 1.2204 2.0% 10-dma envelope
- SUP 4: 1.2178 1.382 proj of the Jan 28 - Feb 25 - Feb 26 price swing
USDCAD maintains a bearish tone following this week's move to fresh cycle lows. The break of 1.2365, Mar 18 low confirms a resumption of the underlying downtrend that has been in place since March 2020. Moving average studies remain in a bear mode reinforcing current trend conditions. The focus is on 1.2239, a Fibonacci projection. On the upside, initial resistance is at 1.2365 and 1.2419. The latter is the Apr 27 high.
FIXED INCOME
BUND TECHS: (M1) Bearish Price Conditions
- RES 4: 172.12 High Apr 8 and key near-term resistance
- RES 3: 171.62 High Apr 14
- RES 2: 171.27 High Apr 22 and key short-term resistance
- RES 1: 170.67 High Apr 28
- PRICE: 169.88 @ 05:09 BST Apr 30
- SUP 1: 169.66 Low Apr 29
- SUP 2: 169.24 Low Feb 24 and major support
- SUP 3: 168.96 0.618 proj of the Jan 27 - Feb 25 - Mar 25 price swing
- SUP 4: 168.09 0.764 proj of the Jan 27 - Feb 25 - Mar 25 price swing
Bund futures traded lower yesterday and in the process cleared support at 170.05, a Fibonacci retracement. The break lower strengthens a bearish case and paves the way for weakness towards the key support handle at 169.24, Feb 25 low. A break of this level would confirm a resumption of the underlying downtrend. On the upside, resistance is seen at 170.67, Wednesday's high. Key resistance has been defined at 171.27, Apr 22 high.
BOBL TECHS: (M1) Extension Lower
- RES 4: 135.350 High Apr 8 and key near-term resistance
- RES 3: 135.180 High Apr 14
- RES 2: 134.050 High Apr 22 and key short-term resistance
- RES 1: 134.880 High Apr 29
- PRICE: 134.670 @ 05:15 BST Apr 30
- SUP 1: 134.590 Low Apr 29
- SUP 2: 134.466 76.4% retracement of the Feb 26 - Mar 25 rally
- SUP 3: 134.140 Low Feb 26 and key support
- SUP 4: 134.000 Round number support
Bobl futures traded lower yesterday. This resulted in a break of support at 134.660, Apr 20 / 28 low and this week's bear trigger. The break lower strengthens a bearish case and paves the way for a move towards 134.466, a Fibonacci retracement. Clearance of this retracement would set the scene for a test of the key support at 134.140, Feb 26 low. A key short-term resistance has been defined at 135.050, Apr 22 high.
SCHATZ TECHS: (M1) Testing Support
- RES 4: 112.165 High Mar 25 and the bull trigger
- RES 3: 112.150 High Apr 8
- RES 2: 112.120 High Apr 22 and key short-term resistance
- RES 1: 112.095 High Apr 28 / 29
- PRICE: 112.070 @ 05:29 BST Apr 30
- SUP 1: 112.060 Low Mar 10, Apr 20 / 28 and 29
- SUP 2: 112.053 50.0% retracement of the Feb 26 - Mar 25 rally
- SUP 3: 112.026 61.8% retracement of the Feb 26 - Mar 25 rally
- SUP 4: 111.993 76.4% retracement of the Feb 26 - Mar 25 rally
Schatz futures remain below resistance at 112.120, Apr 22 high and below the 20-day EMA. Attention is on the key support at 112.060, Mar 10, Apr 20/28 and yesterday's low. A break of this level would strengthen a bearish case and reinstate the current bear leg paving the way for weakness towards 112.053 and potentially 112.026, Fibonacci retracements. On the upside, a break of 112.120 is required to get bulls excited.
GILT TECHS: (M1) Bearish Focus
- RES 4: 130.38 High Feb 17 and 18
- RES 3: 129.75 High Feb 19
- RES 2: 129.27 High Mar 2
- RES 1: 128.34/129.09 20-day EMA / High Apr 23 and reversal trigger
- PRICE: 127.63 @ Close Apr 29
- SUP 1: 127.40 Low Apr 29
- SUP 2: 127.32 Low Apr 1
- SUP 3: 126.79 Low Mar 18 and the bear trigger
- SUP 4: 126.55 Low Apr 17, 2019 (cont)
Gilt futures traded lower again yesterday, extending the move below the former support at 127.81, Apr 14 low. This week's sell-off strengthens a bearish case following the recent pullback from 129.09, Apr 23 high and the area of resistance around the 50-day EMA. An extension lower would open 127.32, Apr 1 low ahead of the key support at 126.79, Mar 18 low. Key resistance is at 129.09.
BTP TECHS: (M1) Probes Key Support
- RES 4: 150.39 High Mar 11 and key short-term resistance
- RES 3: 149.88 High Apr 6
- RES 2: 149.47 High Apr 8
- RES 1: 148.20/65 20-day EMA / High Apr 22
- PRICE: 146.99 @ Close Apr 29
- SUP 1: 146.77 Low Apr 29
- SUP 2: 146.54 0.764 proj of the Feb 12 - 26 - Mar 11 price swing
- SUP 3: 146.16 Low Sep 21, 2020 (cont)
- SUP 4: 145.56 Low Sep 15, 2020 (cont)
BTP futures remain bearish and traded lower again yesterday. The contract has probed key support at 146.84, Feb 26 low and the bear trigger. A clear breach of this level would confirm a resumption of the downtrend that has been in place since Feb 12. This would open 146.54 next, a Fibonacci projection. On the upside, key short-term resistance has been defined at 148.65, Apr 22 high.
EQUITIES
EUROSTOXX 50 TECHS: (M1) Still Trading Below This Months High
- RES 4: 4099.00 1.00 proj of of the Mar - Jul - Oct 2020 price swing
- RES 3: 4023.00 Low Aug 16, 2007
- RES 2: 4000.00 High Apr 16 and the bull trigger
- RES 1: 3993.00 High Apr 29
- PRICE: 3953.00 @ 05:47 BST Apr 30
- SUP 1: 3923.32 20-day EMA
- SUP 2: 3889.00 Low Apr 20
- SUP 3: 3855.00 Low Mar 31
- SUP 4: 3820.19 50-day EMA
EUROSTOXX 50 on Apr 16 found resistance at 4000.00 and selling pressure dominated during the Apr 20 session signalling a short-term bearish threat. The trend is overbought and any pullback would allow this to unwind. The 20-day EMA is at 3923.32. A clear break, together with a move below 3889.00, Apr 20 low would signal scope for a deeper sell-off towards the 50-day EMA at 3814.65. For bulls, a breach of 4000.00 resumes the uptrend.
COMMODITIES
BRENT TECHS: (N1) Focus Is On Resistance
- RES 4: $71.75 - High Jan 8 2020 (cont)
- RES 3: $69.73 - High Mar 8 and the key bull trigger
- RES 2: $68.73 - High Mar 15
- RES 1: $68.44 - High Apr 29
- PRICE: $67 58 06:53 BST Apr 30
- SUP 1: $65.23 - 20-day EMA
- SUP 2: $63.9344 - Low Apr 26 / 50-day EMA
- SUP 3: $61.97 - Low Apr 5
- SUP 4: $60.05 - Low Mar 23
Brent crude futures maintain this week's firmer tone. The contract yesterday traded above resistance at $67.41, Apr 20 high. This paves the way for a climb towards $68.73, Mar 15 high and the key hurdle for bulls at $69.73, Mar 8 high. A break of this latter resistance would confirm a resumption of the broader uptrend. On the downside, key short-term support has been defined at $63.93, Apr 26 low.
WTI TECHS: (M1) Extends This Week's Gains
- RES 4: $67.29 - High Mar 8 and the bull trigger
- RES 3: $66.15 - High Mar 15
- RES 2: $64.68 - High Mar 18
- RES 1: $64.53 - High Apr 28
- PRICE: $64.51 @ 07:00 BST Apr 30
- SUP 1: $62.20 - 20-day EMA
- SUP 2: $60.61/58 - Low Apr 22 / 50-day EMA
- SUP 3: $58.77 - Low Apr 12
- SUP 4: $57.68 - Low Apr 5
WTI futures continue to push higher and yesterday extended this week's recovery. Price has breached resistance at $64.38, Apr 20 high. The break of this level strengthens a short-term bullish case and negates recent bearish signals. Attention is on $66.15, Mar 15 high ahead of the key hurdle for bulls at $67.29, Mar 8 high. On the downside, key short-term support has been defined at $60.61, Apr 22 low. A break would be bearish.
GOLD TECHS: Finds Support At $1756.2
- RES 4: $1818.1 - 50.0% retracement of the Jan 6 - Mar 8 sell-off
- RES 3: $1816.0 - High Feb 23
- RES 2: $1805.7 - High Feb 25
- RES 1: $1797.9 - High Apr 22
- PRICE: $1770.2 @ 07:19 BST Apr 30
- SUP 1: $1756.2 - Low Apr 29
- SUP 2: $1721.4 - Low Apr 5 and key near-term support
- SUP 3: $1705.9 - Low Apr 1
- SUP 4: $1676.9 - Low Mar 8 and the bear trigger
Gold remains above support and underlying conditions are bullish. The yellow metal did trade lower yesterday but found support at the session low $1756.2. This level marks a key near-term support. Attention is on the key resistance at $1797.9, Apr 22 high where a break would confirm a resumption of recent gains. For bears, a break of $1756.2 would instead signal scope for a deeper pullback.
SILVER TECHS: Outlook Remains Bullish
- RES 4: $28.328 - High Feb 23
- RES 3: $27.686 - 61.8% retracement of the Feb 1 - Mar 31 sell-off
- RES 2: $26.941 - 50.0% retracement of the Feb 1 - Mar 31 sell-off
- RES 1: $26.645 - High Apr 21 and the bull trigger
- PRICE: $25.935 @ 07:22 BST Apr 30
- SUP 1: $25.636 - Low Apr 19
- SUP 2: $25.199 - Low Apr 14
- SUP 3: $24.686 - Low Apr 13 and a key support handle
- SUP 4: $23.781 - Low Mar 31
Silver short-term bullish conditions remain in place following recent gains that started Mar 31.. The break higher on Apr 21 resulted in a probe of resistance at $26.636, Mar 18 high and a key near-term hurdle for bulls. A clear break of this level would strengthen a bullish case and open $26.941, a Fibonacci retracement. Key short-term support has been defined at $24.686, Apr 13 low. Initial support is at $25.636.
Why MNI
MNI is the leading provider
of intelligence and analysis on the Global Fixed Income, Foreign Exchange and Energy markets. We use an innovative combination of real-time analysis, deep fundamental research and journalism to provide unique and actionable insights for traders and investors. Our "All signal, no noise" approach drives an intelligence service that is succinct and timely, which is highly regarded by our time constrained client base.Our Head Office is in London with offices in Chicago, Washington and Beijing, as well as an on the ground presence in other major financial centres across the world.