
Why MNI
MNI is the leading provider
of intelligence and analysis on the Global Fixed Income, Foreign Exchange and Energy markets. We use an innovative combination of real-time analysis, deep fundamental research and journalism to provide unique and actionable insights for traders and investors. Our "All signal, no noise" approach drives an intelligence service that is succinct and timely, which is highly regarded by our time constrained client base.Our Head Office is in London with offices in Chicago, Washington and Beijing, as well as an on the ground presence in other major financial centres across the world.

Price Signal Summary – GBP/USD Sell-Off Exposes S/T Bearish Condition
- The trend condition in S&P E-Minis remains bullish and this week’s extension reinforces this theme. The break of 5257.25, Mar 8 high, confirms a resumption of the uptrend and maintains the price sequence of higher highs and higher lows. A bullish trend condition in Eurostoxx 50 futures remains intact and yesterday’s gains reinforce current conditions. The move higher confirms once again a resumption of the uptrend and this has also resulted in a break of the 5000.00 handle.
- A sharp sell-off in GBPUSD yesterday has strengthened a short-term bearish threat and this has exposed support at 1.2600, the Mar 1 low. Price has breached the 50-day EMA. A break of 1.2600 would signal scope for a deeper retracement and potentially expose 1.2519. The USDJPY trend condition remains bullish and this week’s gains reinforce current conditions. Price has cleared key resistance at 150.89, the Feb 13 high, to confirm a resumption of the uptrend. Sights are on 151.91 and 151.95, the Nov 13 high and Oct 1 ‘22 highs respectively. AUDUSD has reversed lower in line with a recovery in the USD. The move lower reinstates a bearish threat and attention is on support at 0.6478, the Mar 5 low. A break of this level would expose the key support and bear trigger at 0.6443.
- The trend condition in Gold is bullish and this week’s move higher reinforces current conditions. The initial rally Thursday delivered another all-time high and confirmed a resumption of the primary uptrend. Moving average studies remain in a bull-mode condition. WTI futures traded higher Tuesday and a bull theme remains intact. The latest pullback is considered corrective. Recent gains resulted in a break of $79.87, Mar 1 high. The move higher confirms a resumption of the uptrend that has been in place since mid-December last year.
- Despite this week’s gains, Bund futures remain closer to their latest lows. A resumption of the recent sell-off would expose key support and the bear trigger at 131.23, the Feb 29 low. Clearance of this level would confirm a continuation of the downtrend. Gilt futures traded higher yesterday, marking an extension of the recovery from 98.05, the Mar 15 low. A continuation higher would expose key short-term resistance at 100.37, the Mar 13 low, where a break would strengthen any developing bullish theme.
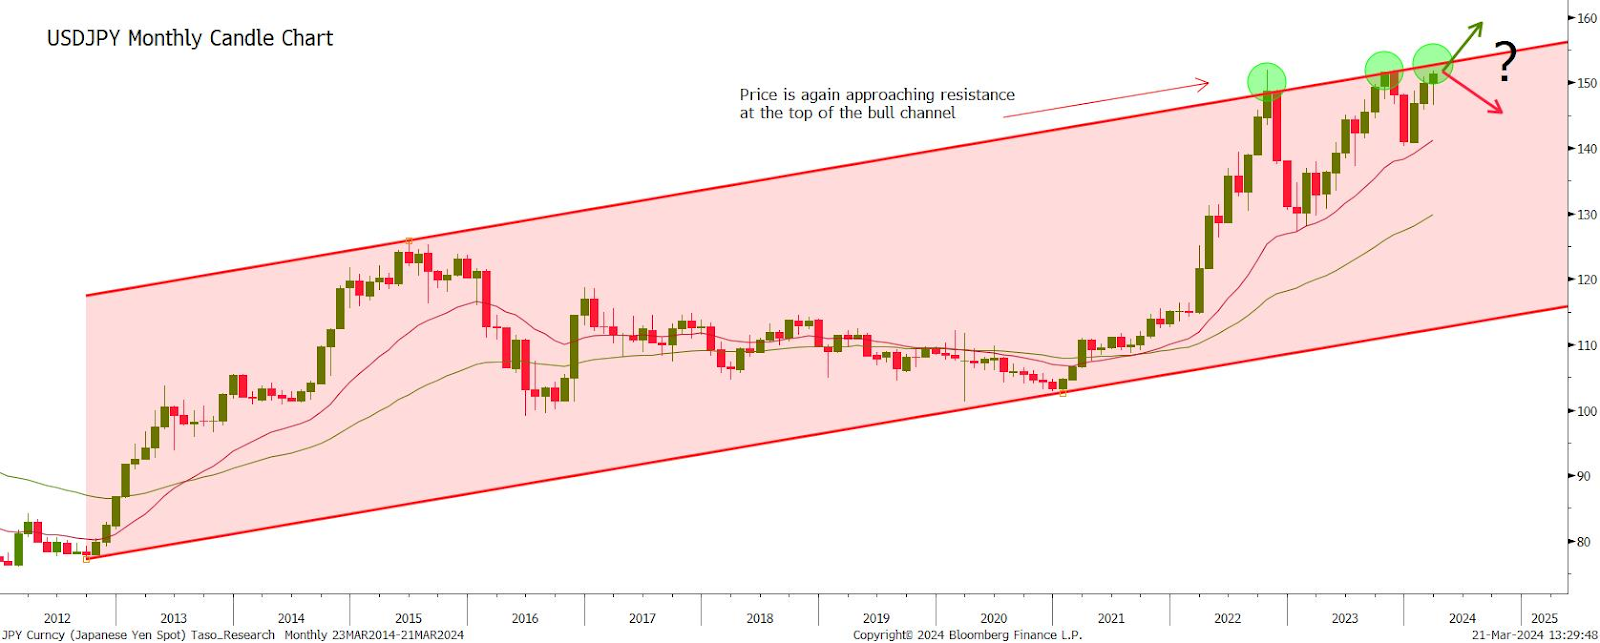
- USDJPY is trading above the 150.00 handle and the pair has arrived at a key long-term area of resistance. There are a number of important technical factors to note at current price levels:
- A multi-year bull channel, drawn from the September 2012 low, clearly illustrates the importance of current resistance at the 152.50 area.
- The channel top was tested and pierced in October ‘22 and in October last year - see chart below.
- Recent gains suggest that we are likely to see a third challenge on resistance at the channel top.
- The number 3, is regarded as an important one in technical analysis. If USDJPY tests the channel top and fails on this third attempt to deliver a clear break, the risk of a deeper pullback or significant reversal would increase.
- It is worth noting that the base of the channel - currently at 115.26 in March - could potentially represent a medium-term objective following a key reversal.
* USDJPY channel:
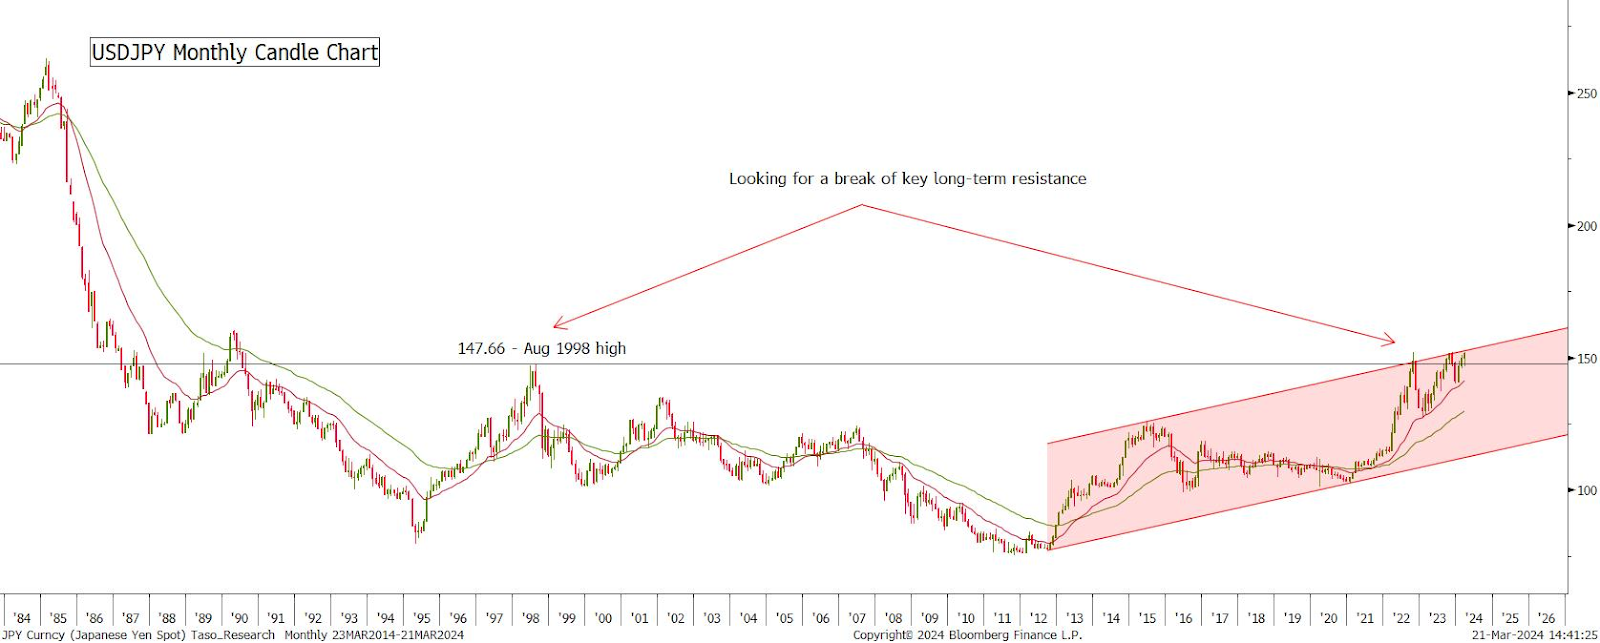
- Looking at a long-term chart, the Aug 1998 high was 147.66. This resistance was breached in 2022 and again last year, however, the USD has not yet confirmed a clear break of this important hurdle for bulls.
- A bullish monthly close in March followed by a strong April would highlight a clear break of the 1998 high. Note that this would also highlight a break out of the multi-year channel. This would strengthen the medium-term uptrend.
USDJPY key resistance:
Key support levels to watch:
- SUPP 1: 149.27 20-day EMA
- SUPP 2: 148.61 50-day EMA
- SUPP 3: 146.49 Low Mar 11. A break of this support would highlight a breach of the 20- and 50-day EMAs and signal an important reversal.
FOREIGN EXCHANGE
EURUSD TECHS: Bearish Threat
- RES 4: 1.1034 76.4% retracement of the Dec 28 - Feb 14 bear leg
- RES 3: 1.0998 High Jan 5
- RES 2: 1.0981 High Mar 8 and the bull trigger
- RES 1: 1.0943 High Mar 21
- PRICE: 1.0839 @ 05:51 GMT Mar 22
- SUP 1: 1.0831 Intraday low
- SUP 2: 1.0796 Low Feb 29
- SUP 3: 1.0762/0695 Low Feb 20 / 14 and the bear trigger
- SUP 4: 1.0656 Low Nov 10
EURUSD has reversed lower from Thursday’s intraday high. The pair has pierced minor support at 1.0835, the Mar 19 low. This reinstates a recent bearish threat and a continuation lower would signal scope for weakness towards 1.0796, the Feb 29 low. A break of this level would strengthen a bearish threat. On the upside, clearance of yesterday’s 1.0943 high is required to expose key resistance at 1.0981, the Mar 8 high.
GBPUSD TECHS: Reversal Lower Highlights A Bearish Threat
- RES 4: 1.2996 High Jul 27 2023
- RES 3: 1.2946 2.00 projection of the Feb 14 - 22 - Mar 1 price swing
- RES 2: 1.2894 High Mar 8 and the bull trigger
- RES 1: 1.2724/2803 20-day EMA / High Mar 21
- PRICE: 1.2638 @ 06:10 GMT Mar 22
- SUP 1: 1.2634 Intraday low
- SUP 2: 1.2600 Low Mar 1
- SUP 3: 1.2536 Low Feb 14
- SUP 4: 1.2519 Low Feb 5 and the bear trigger
A sharp sell-off in GBPUSD yesterday has strengthened a short-term bearish threat and this has exposed support at 1.2600, the Mar 1 low. Price has breached the 50-day EMA. A break of 1.2600 would signal scope for a deeper retracement and potentially expose 1.2519, the Feb 5 low and a key support. Moving average studies continue to highlight an uptrend. A break of Thursday’s 1.2803 high would open 1.2894, the Mar 8 high and bull trigger.
EURGBP TECHS: Pierces Resistance
- RES 4: 0.8678 38.2% retracement of the Feb 3 - Aug 23 bear cycle
- RES 3: 0.8620 High Jan 20
- RES 2: 0.8607 23.6% retracement of the Feb 3 - Aug 23 bear cycle
- RES 1: 0.8583 High Mar 21
- PRICE: 0.8574 @ 06:29 GMT Mar 22
- SUP 1: 0.8530/8504 Low Mar 21 / 08
- SUP 2: 0.8493 Low Aug 23 2023 and a key medium-term support
- SUP 3: 0.8454 76.4% of the Mar 7 - Sep 26 ‘23 bull phase
- SUP 4: 0.8388 Low Aug 17 2023
EURGBP rallied sharply higher yesterday and this resulted in a brief print above resistance at 0.8578, the Feb 20 high. A clear break of this hurdle would highlight a range breakout and a potential reversal. This would open 0.8607, a Fibonacci retracement point. Moving average studies remain in a bear-mode position and continue to highlight a dominant downtrend. A reversal lower would expose the bear trigger at 0.8493, the Aug 23 2023 low.
USDJPY TECHS: Approaching Major Resistance
- RES 4: 153.39 1.382 proj of the Feb 1 - 13 - Mar 8 price swing
- RES 3: 153.00 Round number resistance
- RES 2: 152.66 1.236 proj of the Feb 1 - 13 - Mar 8 price swing
- RES 1: 151.91/95 High Nov 13 / High Oct 1 ‘22 and major resistance
- PRICE: 151.47 @ 06:43 GMT Mar 22
- SUP 1: 149.50/148.73 20- and 50-day EMA values
- SUP 2: 147.44 Low Mar 14
- SUP 3: 146.49 Low Mar 08 / 11 and key support
- SUP 4: 145.90 Low Feb 1
The USDJPY trend condition remains bullish and this week’s gains reinforce current conditions. Price has cleared key resistance at 150.89, the Feb 13 high, to confirm a resumption of the uptrend. Sights are on 151.91 and 151.95, the Nov 13 high and Oct 1 ‘22 highs respectively. A break of this resistance would confirm a resumption of the long-term uptrend and open 152.66, a Fibonacci projection. Initial firm support is 149.50, the 20-day EMA.
EURJPY TECHS: Trend Outlook Remains Bullish
- RES 4: 167.45 1.382 proj of the Jan 2 - 19 - Feb 1 price swing
- RES 3: 166.46 1.236 proj of the Jan 2 - 19 - Feb 1 price swing
- RES 2: 166.00 Round number resistance
- RES 1: 165.35/67 High Mar 20 / 2.0% 10-dma envelope
- PRICE: 163.86 @ 06:59 GMT Mar 22
- SUP 1: 162.60 20-day EMA
- SUP 2: 161.39 Trendline drawn from Dec 7 low
- SUP 3: 160.22 Low Mar 11
- SUP 4: 159.47 Low Feb 8
The EURJPY uptrend remains intact following this week’s move higher and the latest pullback is considered corrective. The cross has traded through 164.30, the Nov 16 ‘23 high and the medium-term bull trigger. This confirms a resumption of the long-term uptrend. The break higher opens 165.67, the top of a MA envelope, and the 166.00 handle further out. Initial firm support lies at 162.60, the 20-day EMA.
AUDUSD TECHS: Bearish Price Action
- RES 4: 0.6729 High Jan 12
- RES 3: 0.6708 61.8% retracement of the Dec 28 - Feb 13 bear cycle
- RES 2: 0.6668 High Mar 8 and the bull trigger
- RES 1: 0.6570/6635 50-day EMA / High Mar 21
- PRICE: 0.6517 @ 08:03 GMT Mar 22
- SUP 1: 0.6504 Low Mar 19
- SUP 2: 0.6478 Low Mar 5
- SUP 3: 0.6443 Low Feb 13 and the bear trigger
- SUP 4: 0.6412 76.4% Fibonacci retracement for Oct - Dec upleg
AUDUSD has reversed lower in line with a recovery in the USD. The move lower reinstates a bearish threat and attention is on support at 0.6478, the Mar 5 low. A break of this level would expose the key support and bear trigger at 0.6443, the Feb 13 low. Moving average studies continue to highlight a short-term downtrend. Initial resistance is at Thursday’s 0.6635 high.
USDCAD TECHS: Resistance Remains Exposed
- RES 4: 1.3729 76.4% retracement of the Nov 1 - Dec 27 bear leg
- RES 3: 1.3661 High Nov 27
- RES 2: 1.3623 61.8% retracement of the Nov 1 - Dec 27 bear leg
- RES 1: 1.3614 High Mar 19 and bull trigger
- PRICE: 1.3568 @ 08:10 GMT Mar 22
- SUP 1: 1.1.3420 Low Mar 8 and the bear trigger
- SUP 2: 1.3359 Low Jan 31 and key S/T support
- SUP 3: 1.3343 Low Jan 12
- SUP 4: 1.3288 Low Jan 5
USDCAD is trading higher but for now, remains below its recent highs. Key short-term resistance has been defined at 1.3614, the Mar 19 high. A break of this level would confirm a resumption of the uptrend that began on Dec 27. This would expose 1.3623, a Fibonacci retracement, and 1.3661, the Nov 27 high. Key support has been defined at 1.3420, the Mar 8 low. A break would be bearish.
FIXED INCOME
BUND TECHS: (M4) Support Remains Exposed
- RES 4: 134.78 50.0% retracement of the Dec 27 - Feb 29 bear cycle
- RES 3: 134.48 High Feb 5
- RES 2: 132.98/134.15 50-day EMA / High Mar 8 and the bull trigger
- RES 1: 132.55 Intraday high
- PRICE: 132.50 @ 05:27 GMT Mar 22
- SUP 1: 131.54 Low Mar 18
- SUP 2: 131.23 Low Feb 29 and the bear trigger
- SUP 3: 131.00 Round number support
- SUP 4: 129.88 Bear channel base drawn from the Dec 27 high
Despite this week’s gains, Bund futures remain closer to their latest lows. A resumption of the recent sell-off would expose key support and the bear trigger at 131.23, the Feb 29 low. Clearance of this level would confirm a continuation of the downtrend that started late December last year. Initial firm resistance to watch is at 132.98, the 50-day EMA. A clear break of this average would be a bullish development.
BOBL TECHS: (M4) Bearish Threat Remains Present
- RES 4: 119.050 High Feb 8
- RES 2: 118.790 High Feb 15 and Mar 8 and the bull trigger
- RES 3: 118.460 High Mar 12
- RES 1: 117.950 High Mar 21
- PRICE: 117.920 @ 05:39 GMT Mar 22
- SUP 1: 117.340 Low Mar 18
- SUP 2: 117.200 Low Feb 29 and the bear trigger
- SUP 3: 117.000 Round number support
- SUP 4: 116.740 High Mar 5 (cont)
Bobl futures are trading above their recent lows. A broader bearish cycle is intact and a resumption of the recent move lower would open the key support and bear trigger at 117.200, the Feb 29 low. Clearance of this level would confirm a resumption of the downtrend that started early December last year. For bulls, a reversal higher would refocus attention on resistance at 118.790, the Feb 15 / Mar 8 high. A break would resume the recent corrective phase.
SCHATZ TECHS: (M4) Gains Considered Corrective
- RES 4: 106.315 High Feb 8
- RES 3: 106.145 High Feb 15
- RES 2: 106.040 Low Feb 15
- RES 1: 105.735/106.010 20-day EMA / High Mar 8
- PRICE: 105.700 @ 05:48 GMT Mar 22
- SUP 1: 105.515 Low Mar 15
- SUP 2: 105.490 Low Feb 29 and the bear trigger
- SUP 3: 105.430 High Feb 20 (cont)
- SUP 4: 105.310 High Feb 26 (cont)
A downtrend in Schatz futures remains intact and the latest pullback from the Mar 8 high, reinforces this theme. Attention is on key short-term support at 105.490, the Feb 29 low. A break of this level would confirm a resumption of the downtrend that started in December last year. For bulls, a reversal higher would open 106.010, the Mar 8 high, where a break is required to resume a bullish corrective phase. Gains are considered corrective.
GILT TECHS: (M4) Key Short-Term Directional Triggers Defined
- RES 4: 101.00 Round number support
- RES 3: 100.73 1.764 projection of the Feb 29 - Mar 1 - 4 price swing
- RES 2: 100.50 1.618 projection of the Feb 29 - Mar 1 - 4 price swing
- RES 1: 99.91/100.37 High Mar 14 / 12 and a key S/T resistance
- PRICE: 99.33 @ Close Mar 21
- SUP 1: 98.77/05 20-day EMA / Low Mar 15
- SUP 2: 97.67 76.4% retracement of the Feb 29 - Mar 12 rally
- SUP 3: 97.42 Low Mar 1
- SUP 4: 96.83 Low Feb 29 and the bear trigger
Gilt futures traded higher yesterday, marking an extension of the recovery from 98.05, the Mar 15 low. A continuation higher would expose key short-term resistance at 100.37, the Mar 13 low, where a break would strengthen any developing bullish theme. Key short-term support has been defined at 98.05, the Mar 15 low. A break would be bearish. For now, 98.05 and 100.37 mark the key short-term directional triggers.
BTP TECHS: (M4) Watching Support At The 20-Day EMA
- RES 4: 121.65 2.618 proj of the Feb 22 - 26 - 29 price swing
- RES 3: 121.19 2.382 proj of the Feb 22 - 26 - 29 price swing
- RES 2: 120.65 High Dec 27 and the bull trigger
- RES 1: 120.28 High Mar 14
- PRICE: 118.90 @ Close Mar 21
- SUP 1: 118.53/33 20-day EMA / Low Mar 15
- SUP 2: 117.80 50-day EMA
- SUP 3: 116.15 Low Feb 22 and the bear trigger
- SUP 4: 116.00 Round number support
BTP futures are consolidating and the contract continues to trade below the recent highs. A short-term bullish theme remains intact following the recovery that started on Feb 22, however, a clear break of support at the 20-day EMA - at 118.53 - would signal scope for a deeper retracement. This would open 117.80, the 50-day EMA and a key short-term support. Key resistance and the bull trigger is unchanged at 120.65, the Dec 27 high.
EQUITIES
EUROSTOXX50 TECHS: (M4) Trend Needle Points North
- RES 4: 5127.70 1.382 proj of the Jan 17 - Feb 12 - 13 price swing
- RES 3: 5100.00 Round number resistance
- RES 2: 5074.70 1.236 proj of the Jan 17 - Feb 12 - 13 price swing
- RES 1: 5022.00 High Mar 21
- PRICE: 5000.00 @ 06:19 GMT Mar 22
- SUP 1: 4896.30 20-day EMA
- SUP 2: 4872.00/4826.00 Low Mar 11 / 5
- SUP 3: 4771.00 Low Feb 22
- SUP 4: 4711.00 Low Feb 19
A bullish trend condition in Eurostoxx 50 futures remains intact and yesterday’s gains reinforce current conditions. The move higher confirms once again a resumption of the uptrend and this has also resulted in a break of the 5000.00 handle. Moving average studies remain in a bull-mode position, highlighting positive market sentiment. Sights are on 5074.7, a Fibonacci projection. Initial firm support is at 4896.30, the 20-day EMA.
E-MINI S&P TECHS: (M4) Northbound
- RES 4: 5428.25 1.00 proj of the Oct 27 - Dec 28 - May 1 price swing
- RES 3: 5400.00 Round number resistance
- RES 2: 5379.92 Bull channel top drawn from the Jan 17 low
- RES 1: 5322.75 High Mar 21
- PRICE: 5301.25 @ 07:22 GMT Mar 22
- SUP 1: 5209.19 Bull channel base drawn from the Jan 17 low
- SUP 2: 5185.88 20-day EMA
- SUP 3: 5073.80 50-day EMA
- SUP 4: 5018.00 Low Feb 21
The trend condition in S&P E-Minis remains bullish and this week’s extension reinforces this theme. The break of 5257.25, Mar 8 high, confirms a resumption of the uptrend and maintains the price sequence of higher highs and higher lows. MA studies are in a bull-mode position reflecting positive market sentiment. Sights are on 5379.92, the top of a bull channel drawn from the Jan 17 low. Initial firm support is at 5196.99, the 20-day EMA.
COMMODITIES
BRENT TECHS: (K4) Corrective Pullback
- RES 4: $90.00 - Psychological round number
- RES 3: $89.26 - High Sep 15 ‘23 and a key resistance
- RES 2: $88.31 - High Oct 20
- RES 1: $87.70- High Mar 20
- PRICE: $85.28 @ 07:06 GMT Mar 22
- SUP 1: $83.97 - 20-day EMA
- SUP 2: $82.18 - 50-day EMA
- SUP 3: $80.19 - Low Feb 26
- SUP 4: $76.41 - Low Feb 5 and key S/T support
A bull cycle in Brent futures remains in play and the latest pullback is considered corrective. Price has recently cleared resistance at $84.34, the Mar 1 high, to confirm a resumption of the uptrend. Moving average studies are in a bull-mode position and this highlights a clear uptrend. Sights are on $88.31, the Oct 20 ‘23 high. On the downside, initial support to watch lies at $83.97, the 20-day EMA.
WTI TECHS: (K4) Pullback Appears To Be A Correction
- RES 4: $90.00 - Psychological round number
- RES 3: $84.87 - High Sep 15 ‘23 and a key resistance
- RES 2: $83.87 - High Oct 20 ‘23
- RES 1: $83.12 - High Mar 19
- PRICE: $80.55 @ 07:19 GMT Mar 22
- SUP 1: $79.27 - 20-day EMA
- SUP 2: $77.47/75.50 - 50-day EMA / Low Feb 26
- SUP 3: $71.52 Low Feb 5
- SUP 4: $70.02 - Low Jan 3
WTI futures traded higher Tuesday and a bull theme remains intact. The latest pullback is considered corrective. Recent gains resulted in a break of $79.87, Mar 1 high. The move higher confirms a resumption of the uptrend that has been in place since mid-December last year. Sights are on $83.87 next, the Oct 20 ‘23 high. A break of this level would open $84.87, the Sep 15 ‘23 high and a key resistance. Support to watch is $79.27, the 20-day EMA.
GOLD TECHS: Trend Signals Remain Bullish
- RES 4: $2282.6 - 1.764 proj of the Oct 6 - 27 - Nov 13 price swing
- RES 3: $2253.6 - 1.618 proj of the Oct 6 - 27 - Nov 13 price swing
- RES 2: $2230.1 - 1.50 proj of the Oct 6 - 27 - Nov 13 price swing
- RES 1: $2220.9 - High Mar 21
- PRICE: $2163.9 @ 07:24 GMT Mar 22
- SUP 1: $2146.2 - Low Mar 18 and key short-term support
- SUP 2: $2132.6 - 20-day EMA
- SUP 3: $2084.5 - 50-day EMA
- SUP 4: $2039.1 - Low Mar 1
The trend condition in Gold is bullish and this week’s move higher reinforces current conditions. The initial rally Thursday delivered another all-time high and confirmed a resumption of the primary uptrend. Moving average studies remain in a bull-mode condition, reflecting positive market sentiment. This signals scope for a climb towards $2230.1, a Fibonacci projection. Key short-term trend support has been defined at $2146.2, the Mar 18 low.
SILVER TECHS: Watching Support
- RES 4: $26.753 - 1.618 proj of the Oct 3 - 20 - Nov 13 price swing
- RES 3: $26.222 - High Apr 18 ‘22
- RES 2: $26.135 - High May 5 ‘23 and a key M/T resistance
- RES 1: $25.774 - High MAr 21
- PRICE: $24.544 @ 08:14 GMT Mar 22
- SUP 1: $24.267 - 20-day EMA
- SUP 2: $23.671 - 50-day EMA
- SUP 3: $22.277 - Low Feb 28
- SUP 4: $21.928 - Low Jan 22 and a key support
A bullish condition in Silver remains intact despite the sharp sell-off in the metal yesterday. This week’s move higher reinforces a bullish theme. Key resistance at $25.761, the Dec 4 high, has been pierced. A clear break of it would strengthen bullish conditions and expose key resistance at $26.135, the May 5 ‘23 high. A move through this level would highlight an important technical break. Initial firm support to watch lies at $24.267, the 20-day EMA.
Why MNI
MNI is the leading provider
of intelligence and analysis on the Global Fixed Income, Foreign Exchange and Energy markets. We use an innovative combination of real-time analysis, deep fundamental research and journalism to provide unique and actionable insights for traders and investors. Our "All signal, no noise" approach drives an intelligence service that is succinct and timely, which is highly regarded by our time constrained client base.Our Head Office is in London with offices in Chicago, Washington and Beijing, as well as an on the ground presence in other major financial centres across the world.