
Why MNI
MNI is the leading provider
of intelligence and analysis on the Global Fixed Income, Foreign Exchange and Energy markets. We use an innovative combination of real-time analysis, deep fundamental research and journalism to provide unique and actionable insights for traders and investors. Our "All signal, no noise" approach drives an intelligence service that is succinct and timely, which is highly regarded by our time constrained client base.Our Head Office is in London with offices in Chicago, Washington and Beijing, as well as an on the ground presence in other major financial centres across the world.
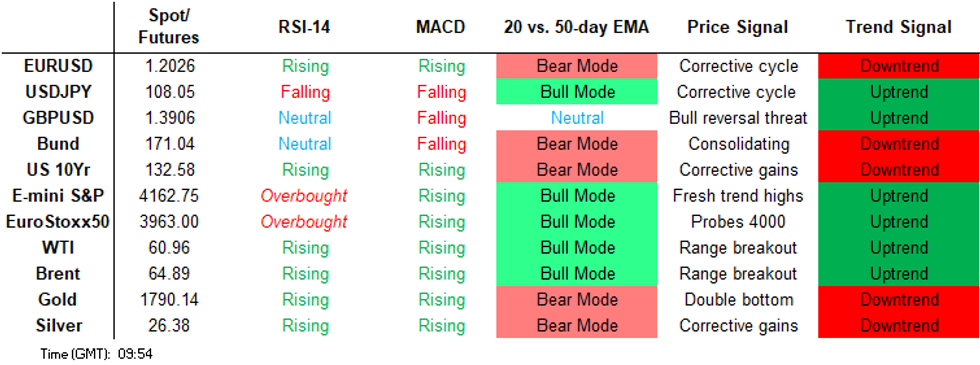
Tech Focus: Price Signal Summary - Monitoring Key USD Resistance Levels
- In the equity space, S&P E-minis traded lower Tuesday but recovered yesterday. Key resistance is at 4183.50, Apr 16 high and key support to watch has been defined at 4110.50, Apr 21 low.
- Key technical features of note in the FX space are:
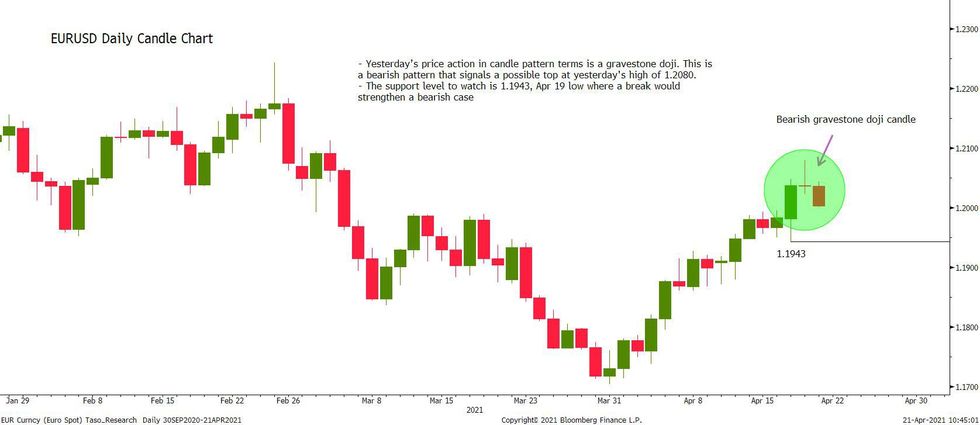
- Tuesday's EURUSD price action in candle pattern terms is a gravestone doji.
- This is a bearish pattern that signals a possible top at 1.2080, Tuesday's high.
- The support level to watch is 1.1943, Apr 19 low where a break would strengthen a bearish case.
- GBPUSD stalled at 1.4009 Tuesday, just above the top of a former bull channel base drawn off the Nov 2, 2020 low - the line intersected at 1.4006.
- Watch support at 1.3810, Apr 19 low.
- USDJPY has cleared some important support levels this week but a key pivot level at 107.70 remains intact, the trendline drawn off the Jan 6 low.
- The ability to remain above this level would be USD positive.
- Elsewhere, a shooting star candle in EURJPY Tuesday also highlights a potential top in this cross. The key support zone to watch is 129.30/22, a trendline drawn off Oct 30 low and the 50-day EMA. USDCAD directional triggers have been defined at 1.2653 and 1.2460, yesterday's high / low prints.
- On the commodity front, Gold maintains a bullish tone. The focus is on $1805.7, Feb 25 high. Brent (M1) stalled at Tuesday's high of $68.08. Key support to watch is $63.22 the 50-day EMA. WTI (M1) found resistance at $64.38 this week, Tuesday's high. The 50-day EMA at $59.54 is seen as a firm near-term support.
- In the FI space, Bunds (M1) resistance to watch is at 171.62, Apr 14 high. Support to watch in Gilts (M1) remains 127.81, Apr 14 low. Key resistance is 129.27, Mar 2 high and the reversal trigger.
FOREIGN EXCHANGE
EURUSD TECHS: Remains Below Recent Highs
- RES 4: 1.2210 2.0% 10-dma envelope
- RES 3: 1.2125 Bear channel top drawn off the Jan 6 high
- RES 2: 1.2116 76.4% retracement of the Feb 25 - Mar 31 sell-off
- RES 1: 1.2080 High Apr 20
- PRICE: 1.2033 @ 06:04 BST Apr 22
- SUP 1: 1.1999/43 Low Apr 21 / Low Apr 19 and key S/T support
- SUP 2: 1.1861 Low Apr 7 and 8
- SUP 3: 1.1795 Low Apr 6
- SUP 4: 1.1738 Low Apr 5
EURUSD maintains a bullish theme although gains have stalled at 1.2080, Tuesday's high. In pattern terms, Tuesday's candle appears to be a gravestone doji and if correct is a bearish signal. A deeper sell-off would expose firm S/T support at 1.1943, Apr 19 low where a break would strengthen a bearish case. For bulls, a climb above Tuesday's high negates the pattern, resumes recent gains and opens the 1.2116-25 resistance zone.
GBPUSD TECHS: Former Bull Channel Base Remains Intact
- RES 4: 1.4182 High Feb 25
- RES 3: 1.4103 76.4% retracement of the Feb 24 - Apr 12 downleg
- RES 2: 1.4095 2.0% 10-dma envelope
- RES 1: 1.4009/17 High Apr 20 / High Mar 4
- PRICE: 1.3928 @ 06:09 BST Apr 22
- SUP 1: 1.3886/10 Low Aspr 21 / Low Apr 19 and key intraday support
- SUP 2: 1.3717 Low Apr 16
- SUP 3: 1.3670/69 Low Mar 25 / Low Apr 12 and key support
- SUP 4: 1.3567 Low Apr 2
GBPUSD rallied Monday and cleared resistance at 1.3919, Apr 6 high. This strengthened the S/T bullish theme and exposed the former bull channel base drawn off the Nov 2, 2020 low. The line however has so far capped recent gains - Tuesday's high was 1.4009. A break of 1.4009 is required to confirm a resumption of recent strength and open 1.4103, a retracement level. Watch support at 1.3810, Apr 19 low, a break would be bearish.
EURGBP TECHS: Bearish Threat Still Present
- RES 4: 0.8840 High Feb 4
- RES 3: 0.8791/8837 High Feb 12 / 2.0% 10-dma envelope
- RES 2: 0.8731 High Feb 26
- RES 1: 0.8673/8719 High Apr 19 / High Apr 16 and key resistance
- PRICE: 0.8639 @ 06:17 BST Apr 22
- SUP 1: 0.8589 Low Apr 19
- SUP 2: 0.8582 Low Apr 7
- SUP 3: 0.8472 Low Apr 5 and the bear trigger
- SUP 4: 0.8430/8397 Low Feb 27, 2020 / 3.0% Lower Bollinger Band
EURGBP remains below the Apr 16 high of 0.8719. The inability to remain above the 0.8700 handle is an early indication that the recent corrective bounce is over. Monday's sell-off in the cross opens 0.8582, Apr 7 low and exposes the Apr 5 low of 0.8472. Medium-term moving average signals are bearish, in line with the broader downtrend that has dominated since Sep 2020. A break of 0.8719 is required to reinstate a bullish theme.
USDJPY TECHS: Attention Is On Trendline Support
- RES 4: 110.97 High Mar 31 and the bull trigger
- RES 3: 110.55 High Apr 6
- RES 2: 109.96 High Apr 9
- RES 1: 108.93 20-day EMA
- PRICE: 107.98 @ 06:22 BST Apr 22
- SUP 1: 107.77 38.2% retracement of the Jan - Mar rally
- SUP 2: 107.70 Trendline support drawn off the Jan 6 low
- SUP 3: 106.97 Low Mar 4
- SUP 4: 106.78 50.0% retracement of the Jan - Mar rally
USDJPY maintains a bearish tone following this week's breach of support at 108.41, Mar 23l. The break and subsequent follow through confirms an extension of the current bearish cycle and note, the 50-day EMA at 108.13 has been breached. This exposes 107.70, trendline support drawn off the Jan 6 low and the next key hurdle for bears. Initial resistance is at 108.93, the 20-day EMA.
EURJPY TECHS: Bearish Candle Pattern
- RES 4: 132.36 1.382 proj of the Jun - Sep - Oct 2020 price swing
- RES 3: 131.58 High Oct 4, 2018
- RES 2: 131.22 1.236 proj of the Jun - Sep - Oct 2020 price swing
- RES 1: 130.97 High Apr 20 and the bull trigger
- PRICE: 129.93 @ 06:30 BST Apr 22
- SUP 1: 129.57 Low Apr 8
- SUP 2: 129.30/22 Trendline drawn off Oct 30 low / 50-day EMA
- SUP 3: 128.29 Low Mar 24
- SUP 4: 127.50 Low Feb 22
EURJPY rallied Tuesday, resulting in a high of 130.97 before fading back. In pattern terms, Tuesday is a shooting star candle and a potential reversal signal. Initial support is at 129.57, Apr 8 low. A clear break lower would expose the 50-day EMA at 129.22 and a trendline support at 129.30, drawn off the Oct 30, 2020 low. Clearance of this zone would signal a reversal and scope for a deeper pullback. The bull trigger is 130.97.
AUDUSD TECHS: Consolidating
- RES 4: 0.8007 High Feb 25 and the bull trigger
- RES 3: 0.7895 76.4% retracement of the Feb 25 - Apr 1 sell-off
- RES 2: 0.7849 High Mar 18 and a reversal trigger
- RES 1: 0.7816 High Apr 20
- PRICE: 0.7743 @ 06:38 BST Apr 22
- SUP 1: 0.7700 Low Apr 21
- SUP 2: 0.7635 Low Apr 14
- SUP 3: 0.7586 Low Apr 13
- SUP 4: 0.7532/17 Low Apr 1 and the bear trigger / Low Dec 22
AUDUSD is consolidating and maintains a firmer tone following the recent break of 0.7677, Apr 7 high. Recent gains also resulted in a break of trendline resistance drawn off the Feb 25 high and note, price is back above the neckline of a recent head and shoulders reversal pattern. Initial firm support is at 0.7700, Apr 21 low. A clear break would concern bulls and instead expose the firmer support at 0.7635, Apr 14 low.
USDCAD TECHS: Directional Triggers Defined
- RES 4: 1.2749 High Feb 26 and key resistance
- RES 3: 1.2700 High Mar 8
- RES 2: 1.2653 High Apr 21 and the bull trigger
- RES 1: 1.2552 20-day EMA
- PRICE: 1.2504 @ 06:48 BST Apr 22
- SUP 1: 1.2460 Low Apr 21
- SUP 2: 1.2415 1.0% 10-dma envelope
- SUP 3: 1.2365 Low Mar 18 and the bear trigger
- SUP 4: 1.2251 Low Jan 31 2018
USDCAD traded in a volatile manner yesterday, briefly probing the recent short-term bull trigger of 1.2647, Mar 30 high before reversing sharply. Directional triggers have been defined at 1.2653 and 1.2460, yesterday's high / low prints. A break of support would signal scope for a deeper pullback and expose the key bear trigger at 1.2365, Mar 18 low. For bulls, clearance of 1.2653 would instead signal a stronger bullish reversal.
FIXED INCOME
BUND TECHS: (M1) Recovering From Recent Lows
- RES 4: 172.34 High Mar 29
- RES 3: 172.12 High Apr 8 and key near-term resistance
- RES 2: 171.62 High Apr 14
- RES 1: 171.25 20-day EMA
- PRICE: 171.19 @ 05:15 BST Apr 22
- SUP 1: 170.05 76.4% retracement of the Feb 25 - Mar 25 rally
- SUP 2: 170.00 Round number support
- SUP 3: 169.24 Low Feb 24 and major support
- SUP 4: 168.96 0.618 proj of the Jan 27 - Feb 25 - Mar 25 price swing
Bund futures are recovering from Tuesday's low. The contract is approaching its 20-day EMA at 171.25. A break of this average would strengthen a short-term bullish theme and signal scope for a stronger recovery. This would open 171.62, Apr 14 high. The recent focus has been on the risk of an extension lower. Price needs to trade through the 171.05 Fibonacci retracement to resume bearish pressure.
BOBL TECHS: (M1) Approaching Its 20-day EMA
- RES 4: 135.440 High Mar 29
- RES 3: 135.350 High Apr 8 and key near-term resistance
- RES 2: 135.180 High Apr 14
- RES 1: 135.051 20-day EMA
- PRICE: 135.030 @ 05:20 BST Apr 22
- SUP 1: 134.870 Low Apr 21
- SUP 2: 134.660 Low Apr 20 and intraday bear trigger
- SUP 3: 134.446 76.4% retracement of the Feb 26 - Mar 25 rally
- SUP 4: 134.140 Low Feb 26 and key support
Bobl futures are firmer and recovering from lows earlier this week. The contract is approaching its 20-day EMA at 135.051. Clearance of this average would strengthen a short-term bullish theme and pave the way for strength towards 135.180, Apr 14 high. A key short-term support has been defined at 134.660, Apr 20 low. A break is required to reinstate the recent bearish focus.
SCHATZ TECHS: (M1) Extends This Week's Gains
- RES 4: 112.174 0.618 proj of the Feb 26 - Mar 2 - Mar 10 price swing
- RES 3: 112.165 High Mar 25 and the bull trigger
- RES 2: 112.150 High Apr 8
- RES 1: 112.125 High Apr 15
- PRICE: 112.110 @ 05:17 BST Apr 22
- SUP 1: 112.060 Low Mar 10 and Apr 20
- SUP 2: 112.053 50.0% retracement of the Feb 26 - Mar 25 rally
- SUP 3: 112.026 61.8% retracement of the Feb 26 - Mar 25 rally
- SUP 4: 111.993 76.4% retracement of the Feb 26 - Mar 25 rally
Schatz futures have extended the recent recovery from Tuesday's low. The 20-day EMA has today been probed and a clear break would strengthen a short-term bullish theme signalling scope for gains towards 112.150, Apr 8 high. Support has been defined at 112.060, Mar 10 and Apr 20 low. A break of this level is required to reinstate the recent bearish focus. This would open 112.053, a Fibonacci retracement.
GILT TECHS: (M1) Focus Is On The Key Resistance Zone
- RES 4: 130.38 High Feb 17 and 18
- RES 3: 129.75 High Feb 19
- RES 2: 129.27 High Mar 2 and the reversal trigger
- RES 1: 128.93/96 High Mar 25 / High Apr 21
- PRICE: 128.67 @ Close Apr 21
- SUP 1: 127.81 Low Apr 14
- SUP 2: 127.32 Low Apr 1
- SUP 3: 126.79 Low Mar 18 and the bear trigger
- SUP 4: 126.55 Low Apr 17, 2019 (cont)
Gilt futures traded higher yesterday but stalled at the session high. The downtrend remains intact and sS/T gains are still considered corrective. However, the contract is trading close to a host of key resistance levels defined by 128.93, Mar 25 high and 129.27, Mar 2 high. The former was probed yesterday but a clear breach of this zone is required to signal a base and a reversal. Support and near-term bear trigger is at 127.81, Apr 14 low.
BTP TECHS: (M1) Bearish Focus
- RES 4: 150.39 High Mar 11 and key short-term resistance
- RES 3: 149.88 High Apr 6
- RES 2: 149.47 High Apr 8
- RES 1: 148.68 20-day EMA
- PRICE: 148.31 @ Close Apr 21
- SUP 1: 147.54 Low Apr 20
- SUP 2: 146.84 Low Feb 26 and the bear trigger
- SUP 3: 146.16 Low Sep 21, 2020 (cont)
- SUP 4: 145.56 Low Sep 15, 2020 (cont)
BTP futures maintain a bearish tone despite this week's gains. The recent break of support at 148.36, Mar 18 low reinforces a bearish theme paving the way for weakness towards 147.56, Mar 5 low. This level was probed Tuesday and a clear break would expose the key support and bear trigger at 146.84, Feb 26 low. MA studies are in a bear mode reinforcing a bearish theme. Initial resistance is seen at 148.68, the 20-day EMA ahead of 149.47, Apr 8 high.
EQUITIES
EUROSTOXX 50 Techs: Corrective Pullback
- RES 4: 4150.66 High Jan 17, 2008
- RES 3: 4110.24 High Jan 18, 2008
- RES 2: 4047.72 2.236 proj of Dec 21 - Jan 8 rally from Jan 28 low
- RES 1: 4040.88 High Apr 19
- PRICE: 3976.41 @ Close Apr 21
- SUP 1: 3935.83 Low Apr 22
- SUP 2: 3910.90 Low Mar 31
- SUP 3: 3841.46 Low Mar 26
- SUP 4: 3836.79 50-day EMA
EUROSTOXX 50 gains have stalled and a sharp sell-off dominated Tuesday's session. The trend condition is overbought and a short-term corrective pullback would allow the overbought reading to unwind. The 20-day EMA has been tested. A clear break would signal scope for a deeper sell-off and expose the 50-day EMA at 3836.79. On the upside, key resistance is at 4040.88, Monday's high. A break resumes the uptrend.
COMMODITIES
BRENT TECHS: (M1) Probes The 20-day EMA
- RES 4: $71.75 - High Jan 8 2020
- RES 3: $70.67 - High Mar 8 and the key bull trigger
- RES 2: $69.50 - High Mar 15
- RES 1: $66.52/68.08 - High Apr 21 / High Apr 20
- PRICE: $65.06 @ 06:52 BST Apr 22
- SUP 1: $63.22 - 50-day EMA
- SUP 2: $62.41 - Low Apr 12
- SUP 3: $61.25 - Low Apr 5
- SUP 4: $60.33 - Low Mar 23 and a key support
Brent crude futures have this week found resistance at $68.08, Apr 20 high. A recent bullish focus is on hold following the pullback from this high. Price has today probed the 20-day EMA, a clear break would signal scope for a deeper pullback towards the 50-day EMA at $63.22. For bulls, clearance of Tuesday's high would reinstate a bullish focus and instead signal scope for a climb towards $69.50, Mar 15 high.
WTI TECHS: (M1) Extends The Recent Pullback
- RES 4: $67.29 - High Mar 8 and the bull trigger
- RES 3: $66.15 - High Mar 15
- RES 2: $65.02 - Former trendline support drawn off Nov 2, 2020 low
- RES 1: $62.56/64.68 - High Apr 21 / High Mar 18
- PRICE: $60.90 @ 07:07 BST Apr 22
- SUP 1: $60.43 - LowApr 14
- SUP 2: $59.54 - 50-day EMA
- SUP 3: $58.77 - Low Apr 12
- SUP 4: $57.68 - Low Apr 5
WTI futures have this week found resistance at $64.38, Apr 20 high. A recent bullish focus is on hold following the move lower. Price has today probed the 20-day EMA, a clear break would suggest scope for a deeper pullback towards the 50-day EMA at $59.94. For bulls, clearance of Tuesday's high would reinstate a bullish focus and instead signal scope for a climb towards $66.15, Mar 15 high.
GOLD TECHS: Bullish Conditions Intact
- RES 4: $1818.1 - 50.0% retracement of the Jan 6 - Mar 8 sell-off
- RES 3: $1816.0 - High Feb 23
- RES 2: $1805.7 - High Feb 25
- RES 1: $1797.9 - Intraday high
- PRICE: $1789.3 @ 07:22 BST Apr 22
- SUP 1: $1760.6 - 50-day EMA
- SUP 2: $1721.4 - Low Apr 5 and key near-term support
- SUP 3: $1705.9 - Low Apr 1
- SUP 4: $1676.9 - Low Mar 8 and the bear trigger
The Gold outlook remains bullish following last week's gains and this week's follow through. The yellow metal recently cleared resistance at $1758.8, Apr 8 high and remains above the 50-day EMA. Furthermore, the break higher last week confirmed a double bottom reversal that had formed since the Mar 8 low. Attention is on $1805.7, Feb 25 high. On the downside, key short-term support has been defined at $1721.4, Apr 5 low. Initial support is at $1760.6.
SILVER TECHS: Needle Points North
- RES 4: $28.328 - High Feb 23
- RES 3: $27.686 - 61.8% retracement of the Feb 1 - Mar 31 sell-off
- RES 2: $26.941 - 50.0% retracement of the Feb 1 - Mar 31 sell-off
- RES 1: $26.645 - High Apr 21
- PRICE: $26.395 @ 09:20 BST Apr 21
- SUP 1: $25.636 - Low Apr 19
- SUP 2: $25.199 - Low Apr 14
- SUP 3: $24.686 - Low Apr 13 and a key support handle
- SUP 4: $23.781 - Low Mar 31
Silver short-term bullish conditions remain intact following last week's gains and yesterday's climb reinforces current conditions. The break higher yesterday resulted in a probe of resistance at $26.636, Mar 18 high and a key near-term resistance. A clear break of this hurdle would strengthen a bullish case and open $26.941, a Fibonacci retracement. Key S/T support has been defined at $24.686, Apr 13 low. Initial support is at $25.636.
Why MNI
MNI is the leading provider
of intelligence and analysis on the Global Fixed Income, Foreign Exchange and Energy markets. We use an innovative combination of real-time analysis, deep fundamental research and journalism to provide unique and actionable insights for traders and investors. Our "All signal, no noise" approach drives an intelligence service that is succinct and timely, which is highly regarded by our time constrained client base.Our Head Office is in London with offices in Chicago, Washington and Beijing, as well as an on the ground presence in other major financial centres across the world.