
Why MNI
MNI is the leading provider
of intelligence and analysis on the Global Fixed Income, Foreign Exchange and Energy markets. We use an innovative combination of real-time analysis, deep fundamental research and journalism to provide unique and actionable insights for traders and investors. Our "All signal, no noise" approach drives an intelligence service that is succinct and timely, which is highly regarded by our time constrained client base.Our Head Office is in London with offices in Chicago, Washington and Beijing, as well as an on the ground presence in other major financial centres across the world.
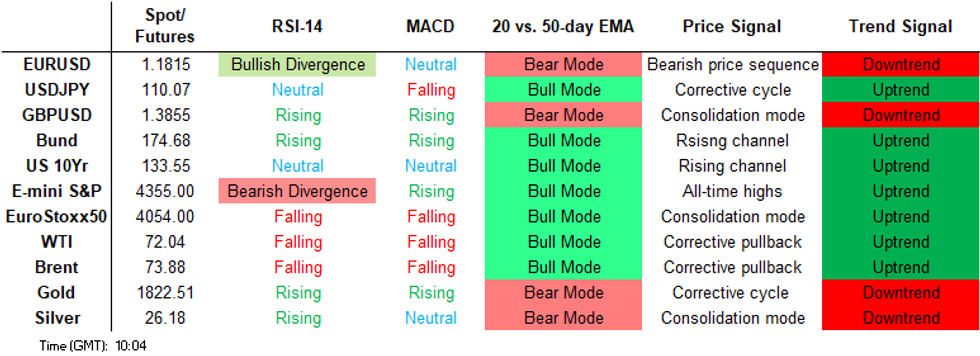
Price Signal Summary - S&P E-Minis Pullback Likely A Correction
- In the equity space, bullish conditions remain intact in the S&P E-minis and the recent pullback is considered a correction. Attention is on 4400.00 next. EUROSTOXX 50 futures remain above last week's low of 3951.50. The contract has failed to challenge initial resistance at 4101.50, Jul 1 high where a break would neutralise recent bearish price signals and signal scope for a stronger recovery.
- In FX, the USD outlook remains bullish. EURUSD resumed its downtrend Tuesday, breaching the recent low of 1.1782, Jul 7 low. The focus is on 1.1704, Mar 31 low. Gains are considered corrective. Resistance is at 1.1881, Jul 9 high. The GBPUSD outlook remains bearish. The focus is on the support and bear trigger at 1.3733, Jul 2 low. Resistance is at 1.3937, the 50-day EMA. USDJPY failed to hold onto Wednesday's high and tackle resistance at 110.82, Jul 7 high. The reversal lower suggests the recent 3-day recovery has been a correction and is over. Support is at 109.53, Jul 8 low and the short-term bear trigger appears exposed.
- On the commodity front, Gold has overcome resistance offered by the 50-day EMA. The break higher strengthens bullish conditions with attention on $1833.7 (tested yesterday) and $1853.3, 50.0% and 61.8% retracement levels of the Jun 1 - 29 decline. Brent (U1) futures attention is on support at $72.11, Jul 8 low. A break would be bearish. WTI (Q1) key support to watch is at 70.76, Jul 8 low.
- Within FI, Bund futures recovered off Wednesday's low. Conditions remain bullish and 174.77, Jul 8 high and the bull trigger has been probed. A clear break would open 174.97 next, Mar 3 high (cont). Gilt futures traded lower yesterday. Broader conditions are bullish and the recent pullback is considered corrective. Attention is on 129.92, Jul 8 high and the bull trigger. Support to watch is 128.54/39, Jul 14 low and the Jun 11 high and recent breakout level.
FOREIGN EXCHANGE
EURUSD TECHS: Directional Signals Point South
- RES 4: 1.2006 High Jun 29 / Jun 17
- RES 3: 1.1968 50-day EMA
- RES 2: 1.1930/1975 High Jun 29 / High Jun 25
- RES 1: 1.1881 High Jul 9
- PRICE: 1.1809 @ 06:04 BST Jul 16
- SUP 1: 1.1772 Low Jul 13 and 14 and the bear trigger
- SUP 2: 1.1738 Low Apr 5
- SUP 3: 1.1704 Low Mar 31 and a key support
- SUP 4: 1.1603 Low Nov 4, 2020
EURUSD was offered Thursday and a bearish tone remains intact. The pair traded lower on Jul 13 to resume its downtrend, breaching 1.1782, Jul 7 low. This week's move lower maintains the current bearish price sequence of lower lows and lower highs and has exposed 1.1704, Mar 31 low. Key short-term resistance has been defined at 1.1975, Jun 25 high. Initial firm resistance is at 1.1881, the July 9 high.
GBPUSD TECHS: Consolidating But Remains Vulnerable
- RES 4: 1.4133 High Jun 16
- RES 3: 1.4074 Low Jun 10
- RES 2: 1.4001 High Jun 23 and key resistance
- RES 1: 1.3933 50-day EMA
- PRICE: 1.3834 @ 06:18 BST Jul 16
- SUP 1: 1.3733 Low Jul 2 and the bear trigger
- SUP 2: 1.3717 Low Apr 16
- SUP 3: 1.3669 Low Apr 12 and a key support
- SUP 4: 1.3567 Low Apr 2
GBPUSD traded lower Thursday, the outlook remains bearish. This follows the recent break of 1.3787, Jun 21 low that confirmed a resumption of the current bearish cycle. Furthermore, moving average studies are still in a bear mode highlighting a bearish condition. Recent weakness signals scope for a test of 1.3717, Apr 16 low. Attention is also on the key short-term support and a bear trigger at 1.3669, Apr 12 low. First resistance is at 1.3937.
EURGBP TECHS: Trend Indicators Remain Bearish
- RES 4: 0.8701/21 High May 7 / High Apr 26 and the bull trigger
- RES 3: 0.8646/72 High Jun 1 / High May 25
- RES 2: 0.8618/29 High Jul 8 and key resistance / High Jun 15
- RES 1: 0.8568 High Jul 15
- PRICE: 0.8538 @ 06:25 BST Jul 16
- SUP 1: 0.8504 Low Jul 14
- SUP 2: 0.8472/70 1.0% Low Apr 5 / 10-dma envelope
- SUP 3: 0.8430 Low Feb 27, 2020
- SUP 4: 0.8356 Low Feb 26, 2020
EURGBP remains above Wednesday's low. The outlook is bearish following the recent breach of support at 0.8531, 76.4% of the Apr 5 - 26 rally and 0.8530, the Jun 23 low of 0.8530. Directional signals still point south and the focus is on key support at 0.8472, Apr 5 low. The cross on Jul 8 probed resistance at 0.8616, Jul 1 high. A clear break is required to neutralise the current bearish theme.
USDJPY TECHS: Remains Vulnerable
- RES 4: 112.23 High Feb 20, 2020 and a key resistance
- RES 3: 111.71 High Mar 24, 2020
- RES 2: 111.66 High Jul 2 and the bull trigger
- RES 1: 110.70/82 High Jul 14/ High Jul 7
- PRICE: 109.98 @ 06:27 BST Jul 16
- SUP 1: 109.53 Low Jul 8 and the bear trigger
- SUP 2: 109.19 Low Jun 7 and a key near-term support
- SUP 3: 108.56 Low May 25
- SUP 4: 108.34 Low May 7
USDJPY remains below Wednesday's high of 110.70 and below resistance at 110.82, Jul 7 high.The reversal lower Wednesday suggests the recent 3-day recovery was a correction and that it is over. If correct, additional near-term weakness would expose 109.53, Jul 8 low and the short-term bear trigger. A break would open 109.19, Jun 7 low. Clearance of 110.70 and 110.82 is required to reinstate a bullish theme.
EURJPY TECHS: Support Appears Vulnerable
- RES 4: 132.70 High Jun 23
- RES 3: 132.43 High Jul 1 and a key resistance
- RES 2: 131.09/56 High Jul 13 / 50-day EMA
- RES 1: 130.43 High Jul 14
- PRICE: 129.90 @ 06:35 BST Jul 16
- SUP 1: 129.61 Low Jul 15
- SUP 2: 129.35 38.2% retracement of the Oct 2020 - May 2021 rally
- SUP 3: 128.83 Low Mar 29
- SUP 4: 128.29 Low Mar 24 and key support
EURJPY traded lower Thursday. The outlook remains bearish and the cross probed support at 129.63, Jul 8 low. A clear break would reinforce a bearish theme and confirm a resumption of the current downtrend. This would open 129.35 next, a Fibonacci retracement. Moving average studies are in bear mode, reinforcing the bearish theme. On the upside, 131.09, Jul 13 high marks initial firm resistance.
AUDUSD TECHS: Focus Is On The Bear Channel
- RES 4: 0.7645 High Jun 17
- RES 3: 0.7598/7617 50-day EMA / High Jun 25 and key resistance
- RES 2: 0.7534/99 High Jul 7 / High Jul 6
- RES 1: 0.7503 High Jul 13
- PRICE: 0.7436 @ 06:39 BST Jul 16
- SUP 1: 0.7410 Low Jul 9
- SUP 2: 0.7362 Bear channel base drawn off the Feb 25 high
- SUP 3: 0.7339 Low Nov 30, 2020
- SUP 4: 0.7304 1.236 proj of Feb 25 - Apr 1 - May 10 price swing
AUDUSD traded lower Thursday, signaling a potential resumption of the downtrend. Price recently found resistance at 0.7599, Jul 6 high and the outlook is bearish with sights on 0.7362, the bear channel base drawn off the Feb 25 high. The recent move lower maintains the price sequence of lower lows and lower highs and moving average studies remain in bear mode. Initial resistance is at 0.7503, the Jul 13 high.
USDCAD TECHS: Fresh Trend High
- RES 4: 1.2737 High Mar 5
- RES 3: 1.2715 2.0% 10-dma envelope
- RES 2: 1.2653 High Apr 21 and a key resistance
- RES 1: 1.2614 High Jul 15
- PRICE: 1.2572 @ 06:42 BST Jul 16
- SUP 1: 1.2428 Low Jul 14
- SUP 2: 1.2303/2253 Low Jul 6 / Low Jun 23 and a key support
- SUP 3: 1.2157 Low Jun 16
- SUP 4: 1.2057 Low Jun 7
USDCAD rallied Thursday and breached resistance at 1.2590, Jul 8 high. The break confirms a resumption of the uptrend that started Jun 1 and paves the way for a climb towards 1.2653 next, Apr 21 high and a key resistance. Moving average studies are in a bull mode reinforcing current trend conditions. Support has been defined at 1.2428, Jul 14 low. A break would signal scope for a deeper corrective pullback.
FIXED INCOME
BUND TECHS: (U1) Probes Resistance
- RES 4: 175.26 High Feb 18 (cont)
- RES 3: 175.08 1.00 proj of the May 19 - Jun 11 - Jun 22 price swing
- RES 2: 174.95/97 Channel top from May 19 low / High Mar 3 (cont)
- RES 1: 174.90 High Jul 15
- PRICE: 174.71 @ 05:13 BST Jul 16
- SUP 1: 173.70 LowJul 13 and 14
- SUP 2: 173.16 High Jun 11 and recent breakout level
- SUP 3: 172.83/75 50-day EMA / Channel base from May 19 low
- SUP 4: 171.49 Low Jul 6
Bund futures traded higher yesterday and the near-term outlook remains bullish. The contract probed initial resistance at 174.77, Jul 8 high. A clear break would strengthen a bullish case, confirm a resumption of the uptrend and highlight a bullish breakout of a rising channel drawn off the May 19 low. Attention is on 174.97, Mar 3 high (cont) and 175.08, a Fibonacci projection. Initial support is at 173.70, the Jul 13 and 14 low.
BOBL TECHS: (U1) Needle Still Points North
- RES 4: 134.912 1.618 proj of the May 20 - 26 - 31 price swing
- RES 3: 134.835 1.50 proj of the May 20 - 26 - 31 price swing
- RES 2: 134.758 1.382 proj of the May 20 - 26 - 31 price swing
- RES 1: 134.710 High Jul 8 and the bull trigger
- PRICE: 134.630 @ 05:32 BST Jul 16
- SUP 1: 134.410 Low Jul 13
- SUP 2: 134.070 Low Jul 6
- SUP 3: 133.860 Low May 28, 31, Jun 22 and key S/T support
- SUP 4: 133.530 Low May 21
Bobl futures maintain a bullish theme and recent gains are positive. The contract on Jul 8 confirmed a clear break of key short-term resistance at 134.510, Jun 11 high and a Fibonacci projection. The break also confirmed a resumption of the recovery from May 20 and sets the scene for an extension higher. This opens 134.758, a Fibonacci projection. On the downside, initial support lies at 134.410, Jul 13 low.
SCHATZ TECHS: (U1) Holding Above Support
- RES 4: 112.290 High Feb 11 (cont)
- RES 3: 112.280 High Feb 12 (cont)
- RES 2: 112.250 High Mar 1 and 2 (cont)
- RES 1: 112.215 High Jul 8 and the bull trigger
- PRICE: 112.185 @ 05:25 BST Jul 16
- SUP 1: 112.150 Low Jul 13
- SUP 2: 112.140 Low Jul 5 and 6
- SUP 3: 112.120 Low Jun 30
- SUP 4: 112.110 Congestion lows Apr 20, Jun 22, 23, 25 and 28
The Schatz futures outlook remains bullish. Resistance at 112.210, Jun 11 high was probed on Jul 8. A clear break of this hurdle would strengthen a bullish case and open 112.250, the Mar 1 and 2 high (cont). A move higher would also establish a bullish price sequence of higher highs and higher lows. On the downside, clearance of 112.110 is required to reinstate a bearish theme. Initial firm support is at 112.150.
GILT TECHS: (U1) Pullback Considered Corrective
- RES 4: 130.62 High Feb 22 (cont)
- RES 3: 130.30 2.00 proj of the May 13 - 26 - Jun 3 price swing
- RES 2: 129.99 High Feb 24 (cont)
- RES 1: 129.49/92 High Jul 15 / High Jul 8 and the bull trigger
- PRICE: 128.66 @ Close Jul 15
- SUP 1: 128.54/39 Low Jul 14 / High Jun 11 and recent breakout level
- SUP 2: 128.03 Jul 6
- SUP 3: 127.25 Low Jun 10
- SUP 4: 126.91 Low Jun 17 and key support
Gilt futures traded lower yesterday and remain below recent highs. Despite the pullback, a bullish outlook remains intact. Recent gains resulted in a breach of key short-term resistance at 128.39, Jun 11 high. The break highlights a resumption of the uptrend from May 13 and maintains a bullish price sequence of higher highs and higher lows. A resumption of gains would open 129.92. Initial firm support is at 128.54/39.
BTP TECHS: (U1) Trading Close To Recent Highs
- RES 4: 154.15 0.764 proj of May 19 - Jun 14 - Jun 25 price swing
- RES 3: 153.82 High Feb 12 (cont)
- RES 2: 153.35 0.618 proj of May 19 - Jun 14 - Jun 25 price swing
- RES 1: 153.18 High Jul 15
- PRICE: 152.78 @ Close Jul 15
- SUP 1: 151.93/54 Low Jul 8 / Low Jul 6
- SUP 2: 151.19 High Jul 1
- SUP 3: 150.56 Low Jun 30
- SUP 4: 149.97 Low Jun 25 and key short-term support
BTPs are trading closer to recent highs following this week's resumption of the uptrend. Gains on Jul 6 and 7 resulted in a breach of key resistance at 152.47, Jun 14 high. The break higher confirms a resumption of the uptrend that started May 19 and paves the way for a stronger short-term recovery. This week's fresh high print reinforces the bullish theme. Attention is on 153.35, a Fibonacci projection. Initial support is at the Jul 8 low of 151.93.
EQUITIES
EUROSTOXX 50 TECHS: (U1) Fails To Challenge Resistance At 4101.50
- RES 4: 4175.00 Nov 26, 2008 low (cont)
- RES 3: 4153.00 High Jun 17 and bull trigger
- RES 2: 4121.00 High Jun 25
- RES 1: 4101.50 High Jul 1
- PRICE: 4046.50 @ 05:58 BST Jul 16
- SUP 1: 3951.50 Low Jul 8
- SUP 2: 3976.00 Low May 21
- SUP 3: 3914.00 Low May 20
- SUP 4: 3871.00 Low May 19
EUROSTOXX 50 futures remain above recent lows following the bounce from the 3951.50 low, Jul 8 low. The contract has failed to challenge initial resistance at 4101.50, Jul 1 high where a break would neutralise recent bearish price signals and signal scope for a stronger recovery towards 4121.00 initially. On the downside, a deeper pullback would expose 3951.50, Jul 8 low and the bear trigger.
E-MINI S&P (U1): Pullback Considered Corrective
- RES 4: 4508.82 1.236 proj of Mar 25 - May 10 - 13 price swing
- RES 3: 4415.48 1.00 proj of Mar 25 - May 10 - 13 price swing
- RES 2: 4400.00 Round number resistance
- RES 1: 4384.50 High Jul 14
- PRICE: 4351.50 @ 06:46 BST Jul 16
- SUP 1: 4279.25 Low Jul 8
- SUP 2: 4231.93/4126.75 50-day EMA / Low Jun 21 and key support
- SUP 3: 4100.00 Round number support
- SUP 4: 4020.20 Low May 13 and key short-term support
The S&P E-minis pullback is considered corrective. The trend condition remains bullish and price has confirmed a fresh all-time high again this week. Moving average studies continue to point north too, reinforcing current conditions. Attention is on 4400.00 next. On the downside, the contract needs to trade below 4279.25, Jul 8 low to signal a potential near-term top. This would suggest scope for a deeper corrective pullback.
COMMODITIES
BRENT TECHS: (U1) Lower But Remains Above Key Support
- RES 4: $78.03 - High Oct 29, 2018 (cont)
- RES 3: $77.86 - 1.382 proj of Mar 23 - May 18 - May 21 price swing
- RES 2: $77.84 - High Jul 6 and the bull trigger
- RES 1: $76.72 - High Jul 14
- PRICE: $73.20 @ 06:50 BST Jul 16
- SUP 1: $73.01 - Intraday low
- SUP 2: $72.11 - Low Jul 8 and key near-term support
- SUP 3: $71.24 - Low Jun 17
- SUP 4: $69.42 - High May 18
Brent futures remain above last week's lows but are trading lower. Recent gains suggested a bullish theme had been re-established and attention is on the key resistance at $77.84, Jul 6 high where a break would negate recent bearish concerns and confirm a resumption of the uptrend. On the downside, the key short-term support to watch has been defined at $72.11, Jul 8 low. A breach of this support would signal a short-term top.
WTI TECHS: (Q1) Approaching Key Support
- RES 4: $78.79 - 1.764 proj of Mar 23 - May 18 - May 21 price swing
- RES 3: $77.35 - 1.618 proj of Mar 23 - May 18 - May 21 price swing
- RES 2: $76.98 - High Jul 6 and the bull trigger
- RES 1: $75.52 - High Jul 13
- PRICE: $71.45 @ 07:01 BST Jul 16
- SUP 1: $70.76 - Low Jul 8 and key support
- SUP 2: $69.85 - 50-day EMA
- SUP 3: $69.54 - Low Jun 17
- SUP 4: $67.59 - Low Jun 2
Brent futures are lower and approaching support at $70.76, Jul 8 low. A break of this support would highlight a stronger bearish theme and signal scope for a deeper pullback, initially towards $69.85, the 50-day EMA. A clear break of the average would strengthen a bearish case. For bulls, initial firm resistance has been defined at $75.52, Jul 13 high. Clearance of this hurdle is required to once again expose the bull trigger at $76.98, Jul 6 high.
GOLD TECHS: Bullish Theme Remains In Place
- RES 4: $1877.5 - 76.4% retracement of the Jun 1 - 29 decline
- RES 3: $1863.3 - High Jun 16
- RES 2: $1853.3 - 61.8% retracement of the Jun 1 - 29 decline
- RES 1: $1834.1 - High Jul 15
- PRICE: $1825.4 @ 07:17 BST Jul 16
- SUP 1: $1791.7 Low Jul 12 and key near-term support
- SUP 2: $1774.4/1750.8 - Low Jul 2 / Low Jun 29
- SUP 3: $1733.5 -76.4% retracement of the Mar 8 - Jun 1 rally
- SUP 4: $1723.8 - Low Apr 13
Gold maintains a firmer tone having finally overcome resistance offered by the 50-day EMA. The break higher strengthens bullish conditions with attention on $1833.7 (tested yesterday) and $1853.3, Fibonacci retracements. On the downside, support has been defined at $1791.7, Jul 12 low where a break is required to signal a short-term top. This would also suggest scope for a retest of $1750.8, Jun 29 low.
SILVER TECHS: Consolidating
- RES 4: $28.556 - High Jun 1
- RES 3: $28.285 - High Jun 11 and a key resistance
- RES 2: $27.831 - High Jun 16
- RES 1: $26.775/27.245 - High Jul 6 / High Jun 17
- PRICE: $26.239 @ 07:23 BST Jul 16
- SUP 1: $25.529 - Low Jun 29 and a bear trigger
- SUP 2: $25.199 - Low Apr 14
- SUP 3: $24.955 - 76.4% retracement of the Mar 31 - May 18 rally
- SUP 4: $24.686 - Low Apr 13
Silver is unchanged and continues to consolidate. The metal recently breached $26.495, Jun 18 high. The break neutralises a recent bearish theme and signals scope for a stronger S/T recovery. If Silver is able to resume its climb, this would open $27.245, Jun 17 high. Thus far, price has failed to hold onto recent gains and attention is on the key support and bear trigger at $25.529, Jun 29 low. Clearance of this level resumes a downtrend.
Why MNI
MNI is the leading provider
of intelligence and analysis on the Global Fixed Income, Foreign Exchange and Energy markets. We use an innovative combination of real-time analysis, deep fundamental research and journalism to provide unique and actionable insights for traders and investors. Our "All signal, no noise" approach drives an intelligence service that is succinct and timely, which is highly regarded by our time constrained client base.Our Head Office is in London with offices in Chicago, Washington and Beijing, as well as an on the ground presence in other major financial centres across the world.