
Why MNI
MNI is the leading provider
of intelligence and analysis on the Global Fixed Income, Foreign Exchange and Energy markets. We use an innovative combination of real-time analysis, deep fundamental research and journalism to provide unique and actionable insights for traders and investors. Our "All signal, no noise" approach drives an intelligence service that is succinct and timely, which is highly regarded by our time constrained client base.Our Head Office is in London with offices in Chicago, Washington and Beijing, as well as an on the ground presence in other major financial centres across the world.
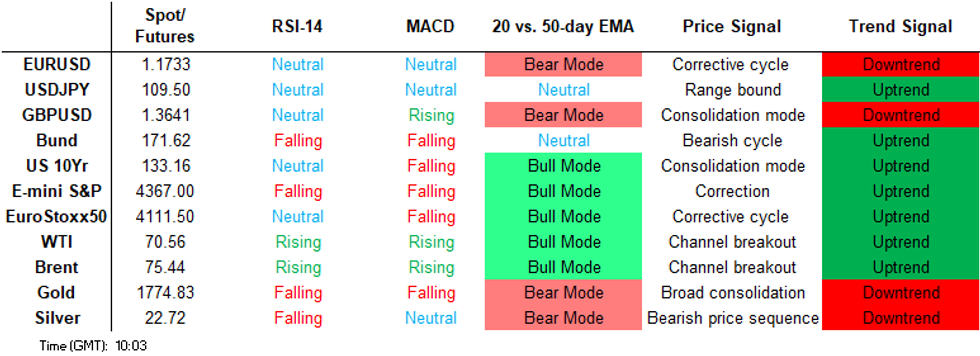
Price Signal Summary - S&P E Minis Remain Below The Key 50-Day EMA
- In the equity space, S&P E-minis have recovered somewhat following Monday's sell-off. The outlook is bearish however following the clear breach of the 50-day EMA and a key short-term support and bear trigger has been established at Monday's low of 4293.75. Price needs to trade above 4418.00, Sep 20 high to suggest the tide may have turned, signalling scope for stronger recovery. Note a break higher would also mean price is once again above the 50-day EMA and this would represent a positive development. EUROSTOXX 50 futures also started the week on a bearish note and cleared former support at 4060.50, Aug 19 low. This signals scope for weakness towards 3962.50, 76.4% retracement of the Jul 19 - Sep 6 rally. The next resistance is at 4127.40, the 20-day EMA. Current gains are considered corrective.
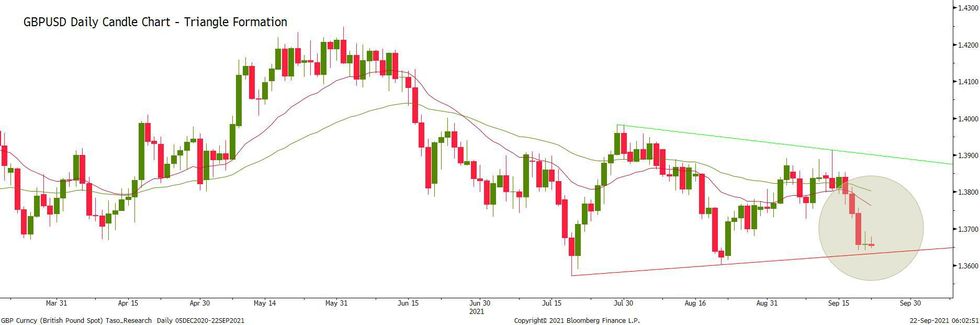
- In FX, EURUSD outlook remains bearish. Monday's weakness resulted in a breach of 1.1722, 76.4% of the Aug 20 - Sep 3 rally. This opens the key support at 1.1664, Aug 20 low and an important bear trigger. GBPUSD traded sharply lower Monday and cleared support at 1.3727, Sep 8 low. The next key support is at 1.3602, Aug 20 low. Note too that there is a triangle base at 1.3631 that also represents an important support. The triangle is drawn from the July 20 low. Recent USD Index (DXY) gains have exposed the key resistance at 93.73, Aug 20 high and the bull trigger. A break would confirm a resumption of the uptrend that started May 25.
- On the commodity front, the Gold near-term outlook remains bearish. The focus is on $1724.5, 76.4% retracement of the Aug 9 - Sep 3 rally. Resistance is at $1786.8, the 20-day EMA. WTI futures maintain a bullish outlook. Yesterday's price pattern is a bullish doji candle, reinforcing the current uptrend. Initial support is seen at $69.39, Sep 21 low. The focus is on $73.58, Jul 6 high and the bull trigger
- In FI, Bund futures remain in a downtrend. Recent weakness signals scope for a move towards 170.52, 3.00 projection of the Aug 5 - 11 - 17 price swing. Initial firm resistance is at 172.12, Sep 14 high. Gilt futures remain in a bearish cycle too. The focus is on 126.83, 2.00 projection of the Aug 20 - 26 - 31 price swing.
FOREIGN EXCHANGE
EURUSD TECHS: Eyeing Key Support
- RES 4: 1.1909 High Jul 30 / Sep 03 and a key resistance
- RES 3: 1.1901 1.0% 10-dma envelope
- RES 2: 1.1846 High Sep 14
- RES 1: 1.1785 20-day EMA
- PRICE: 1.1723 @ 05:55 BST Sep 22
- SUP 1: 1.1693 Low Aug 23
- SUP 2: 1.1664 Low Aug 20 and the bear trigger
- SUP 3: 1.1621 1.00 proj of the Jan 6 - Mar 31 - May 25 price swing
- SUP 4: 1.1603 Low Nov 4, 2020
EURUSD is consolidating but maintains a bearish position following recent weakness. The pair has cleared 1.1770, Sep 13 low and 1.1758, 61.8% of the Aug 20 - Sep 3 rally. This week's extension lower has resulted in a breach of 1.1722, the 76.4% retracement. This opens key support at 1.1664, Aug 20 low and an important bear trigger. A break would strengthen a M/T bearish case. Initial firm resistance has been defined at 1.1846, Sep 14 high.
GBPUSD TECHS: Approaching Key Support
- RES 4: 1.3983/90 High Jul 30 / 61.8% of the Jun 1 - Jul 20 sell-off
- RES 3: 1.3958 High Aug 4
- RES 2: 1.3913 High Sep 14 and the intraday bull trigger
- RES 1: 1.3773 20-day EMA
- PRICE: 1.3651 @ 15:37 BST Sep 21
- SUP 1: 1.3631/02 Triangle base drawn from Jul 20 low / Low Aug 20
- SUP 2: 1.3572 Low Jul 20 and the bear trigger
- SUP 3: 1.3520 Low Jan 18
- SUP 4: 1.3462 50.0% retracement of the Sep '20 - Jun rally
GBPUSD remains vulnerable following recent weakness. The pair Monday traded below an important S/T support at 1.3727, Sep 8 low, signalling scope for an extension lower. This has also resulted in a break of 1.3680, Aug 27 low and opens the important 1.3602/3572 support zone. Note that there is a triangle base at 1.3632 that also represents an important support. The triangle is drawn from the Jul 20 low. Resistance is at 1.3773.
EURGBP TECHS: Key S/T Resistance Exposed
- RES 4: 0.8670 High Jul 20 and key resistance
- RES 3: 0.8659 High Jul 21
- RES 2: 0.8614/18 High Sep 7 / 76.4% of the Jul 20 - Aug 10 sell-off
- RES 1: 0.8603 Intraday high
- PRICE: 0.8604 @ 09:40 BST Sep 22
- SUP 1: 0.8557 20-day EMA
- SUP 2: 0.8502/01 76.4% of the Aug 10 - Sep 7 rally / Low Sep 16
- SUP 3: 0.8484 Low Aug 16
- SUP 4: 0.8467/50 1.0% 10-dma envelope / Low Aug 10
EURGBP rallied sharply higher Monday and the cross is firmer this morning. Key S/T resistance at 0.8614, Sep 7 high remains intact for now, a break though would represent an important short-term bullish development and signal scope for a stronger rally. For bears, a resumption of weakness would refocus attention on 0.8501, Sep 16 low. A break of this support would expose 0.8484, Aug 16 low ahead of 0.8450, Aug 10 low and the bear trigger.
USDJPY TECHS: Range Base Holds Firm
- RES 4: 110.82 High Jul 7
- RES 3: 110.80 High Aug 11 and a key resistance
- RES 2: 110.45/46 High Sep 8 / High Aug 13
- RES 1: 110.16 High Sep 13 / 14
- PRICE: 109.53 @ 06:13 BST Sep 22
- SUP 1: 109.11 Low Aug 16 / Sep 15
- SUP 2: 108.72 Low Aug 04 and the bear trigger
- SUP 3: 108.56 Low May 25
- SUP 4: 108.47 76.4% of the Apr 23 - Jul 2 rally
USDJPY is firmer today and the range base at 109.11 remains intact. The outlook is bearish however support at 109.11, Aug 16 / Sep 15 low needs to give way to reinforce this theme. A break of this level would expose 108.72, Aug 4 low. Clearance of 108.72 would open 108.47, a Fibonacci retracement and below. For bulls, the level to break is unchanged at 110.80, Aug 11 high. Initial firm resistance is at 110.45/46.
EURJPY TECHS: Probes The Bear Trigger
- RES 4: 130.84/131.09 1.0% 10-dma envelope / High Jul 13
- RES 3: 130.75 High Sep 3 and the bull trigger
- RES 2: 130.20 High Sep 14 high
- RES 1: 129.67 High Sep 17
- PRICE: 128.42 @ 06:30 BST Sep 22
- SUP 1: 127.94/93 Low Aug 19 and the bear trigger / Intrada low
- SUP 2: 127.88 50.0% retracement of the Oct '20 - Jan rally
- SUP 3: 127.50 Low Feb 22
- SUP 4: 126.40 61.8% retracement of the Oct '20 - Jun rally
EURJPY remains in a bear mode and has traded just below the key support and bear trigger at 127.94, Aug 19 low. The formation this week of a death cross in the DMA space reinforces a bearish theme, and Monday's low also pierced the 1.0% 10-dma envelope. A clear break of 127.94 would open 127.88, a retracement. Further out, the risk of a move towards the 2021 lows of 125.09 has increased. Initial firm resistance is at 129.67.
AUDUSD TECHS: Needle Points South
- RES 4: 0.7499/7503 50.0% of the May - Aug sell-off / High Jul 13
- RES 3: 0.7478 High Sep 3 and the bull trigger
- RES 2: 0.7410 High Sep 10
- RES 1: 0.73161 20-day EMA
- PRICE: 0.7254@ 06:36 BST Sep 22
- SUP 1: 0.7220 Low Sep 20
- SUP 2: 0.7194 76.4% retracement of the Aug 20 - Sep 3 rally
- SUP 3: 0.7106 Low Aug 20 and the bear trigger
- SUP 4: 0.7053 38.2% retracement of the Mar '20 - Feb uptrend
AUDUSD remains bearish following recent weakness. The 20-day EMA and a number of retracement levels have recently been cleared as the pair extends the pullback from 0.7478, Sep 3 high . The focus is on 0.7194, 76.4% of the Aug 20 - Sep 3 rally. A break of this level would expose the key support at 0.7106. On the upside, initial resistance is seen at 0.7316, the 20-day EMA ahead of 0.7410, the Sep 10 high.
USDCAD TECHS: Bullish Price Structure Intact
- RES 4: 1.2976 1.00 proj of the Jun 23 - Jul 19 - 30 price swing
- RES 3: 1.2957 High Dec 21, 2020
- RES 2: 1.2949 High Aug 20 and the bull trigger
- RES 1: 1.2896 High Sep 20
- PRICE: 1.2789 @ 06:39 BST Sep 22
- SUP 1: 1.2678 20-day EMA
- SUP 2: 1.2583 Low Sep 10
- SUP 3: 1.2494 Low Sep 3 and the bear trigger
- SUP 4: 1.2422 Jul 30 low and a key support
USDCAD maintains a firmer tone and the pair continues to display a stronger bullish short-term condition following the recovery from 1.2494, Sep 3 low. Furthermore, moving average conditions remain in a bull mode reinforcing this theme. Monday's gains resulted in a break of resistance at 1.2762, Sep 8 high. The focus is on the 1.2949 bull trigger, Aug 20 high. Initial support is at 1.2678, the 20-day EMA.
FIXED INCOME
BUND TECHS: (Z1) Downtrend Intact
- RES 4: 172.76 High Sep 2 and 3
- RES 3: 172.48 High Sep 9
- RES 2: 172.12 High Sep 14 and key near-term resistance
- RES 1: 171.96 High Sep 21
- PRICE: 171.55 @ 05:08 BST Sep 22
- SUP 1: 170.81 Low Sep 17
- SUP 2: 170.52 3.00 proj of the Aug 5 - 11 - 17 price swing
- SUP 3: 170.22 3.236 proj of the Aug 5 - 11 - 17 price swing
- SUP 4: 170.00 Round number support
Bund futures remain in a downtrend and recent gains are considered corrective. A bearish theme follows the recent move through 172.00 with moving average studies pointing south. Furthermore, the move lower has maintained the bearish price sequence of lower lows and lower highs. Attention is on 170.52 next, a Fibonacci projection. Initial firm resistance is at 172.12, Sep 14 high. A break would ease the current bearish risk.
BOBL TECHS: (Z1) Gains Still Considered Corrective
- RES 4: 136.030 High Aug 30 , 31
- RES 4: 135.870 High Sep 3
- RES 3: 135.660 High Sep 7 and 9 and key near-term resistance
- RES 2: 135.550 High Sep 14
- PRICE: 135.420 @ 05:04 BST Sep 22
- SUP 1: 135.200 Low Sep 17
- SUP 2: 135.136 2.236 proj of the Aug 20 - 27 - 31 price swing
- SUP 3: 135.077 2.382 proj of the Aug 20 - 27 - 31 price swing
- SUP 4: 135.030 2.50 proj of the Aug 20 - 27 - 31 price swing
Bobl futures outlook remains bearish despite recent gains. Last week's extension lower once again confirmed a continuation of the bearish price sequence of lower lows and lower highs, signalling scope for a further downside. The focus is on 135.136 next, a Fibonacci projection. Initial firm resistance is seen at 135.550, Sep 14 high where a break is required to ease current bearish pressure. Short-term upticks are considered corrective.
SCHATZ TECHS: (Z1) Corrective Recovery
- RES 4: 112.350 High Aug 24
- RES 3: 112.340 High Aug 31
- RES 2: 112.305 High Sep 3 and key near-term resistance
- RES 1: 112.290 High Sep 20
- PRICE: 112.260 @ 05:24 BST Sep 22
- SUP 1: 112.245/215 Low Sep 20 / Low Sep 9 and the bear trigger
- SUP 2: 112.206 2.236 proj of the Aug 20 - 26 - 31 price swing
- SUP 3: 112.200 Round number support
- SUP 4: 112.197 2.382 proj of the Aug 20 - 26 - 31 price swing
Schatz futures started the week on a firmer note however despite recent gains, the outlook is bearish and gains are considered corrective. The recent move lower to 112.215 on Sep 9, confirmed a resumption of the downtrend and marks an extension of the bear cycle that started Aug 5. A resumption of weakness would refocus attention on 112.206, a Fibonacci projection. Resistance is seen at 112.305, Sep 3 high.
GILT TECHS: (Z1) Bearish Price Sequence
- RES 4: 128.77 High Sep 3
- RES 3: 128.42 High Sep 7
- RES 2: 128.18 High Sep 10, 14 and key near-term resistance
- RES 1: 127.69 High Sep 21
- PRICE: 127.49 @ Close Sep 21
- SUP 1: 126.83 2.00 proj of the Aug 20 - 26 - 31 price swing
- SUP 2: 126.70 Low Jun 3 and a key support
- SUP 3: 126.57 2.236 proj of the Aug 20 - 26 - 31 price swing
- SUP 4: 126.41 2.382 proj of the Aug 20 - 26 - 31 price swing
Gilt futures are trading above recent lows. A bearish theme remains intact following last week's round of weakness. A price sequence of lower lows and lower highs highlights the current bearish theme and the focus is on 126.83 next, a Fibonacci projection ahead of 126.70, Jun 3 low (cont) and a key support Key near-term resistance has been defined at 128.18, Sep 10 and 14 high. A break of this level is required to ease the current bearish pressure.
BTP TECHS: (Z1) Bearish Focus
- RES 4: 155.71 High Aug 5 and the bull trigger (cont)
- RES 3: 155.68 High Aug 25
- RES 2: 155.14 High Aug 31
- RES 1: 154.63 High Sep 14 and key near-term resistance
- PRICE: 154.15 @ Close Sep 21
- SUP 1: 153.36 Low Sep 17
- SUP 2: 152.94/84 Low Sep 9 / 50.0% of Jun 25 - Aug 5 rally (cont)
- SUP 3: 152.66 Low Jul 15 (cont)
- SUP 4: 152.16 61.8% retracement of the Jun 25 - Aug 5 rally (cont)
BTP futures remain below recent highs. Trend conditions are bearish and recent gains are considered corrective. A price sequence of lower lows and lower highs that highlights a bearish theme remains intact. The focus is on 152.84 next, a Fibonacci retracement and below. On the upside, a resumption of gains would open resistance at 155.14, Aug 31 high. The bear trigger is unchanged at 152.94, Sep 7 low.
EQUITIES
EUROSTOXX 50 TECHS: (Z1) Bearish Threat Remains Present
- RES 4: 4223.00 High Sep and the bull trigger
- RES 3: 4210.41 2.0% 10-dma envelope
- RES 2: 4184.00 High Sep 17
- RES 1: 4116.00 Intraday high
- PRICE: 4105.50 @ 09:28 BST Sep 22
- SUP 1: 3974.00 Low Sep20
- SUP 2: 3962.50 76.4% retracement of the Jul 19 - Sep 6 rally
- SUP 3: 3941.50 Low Jul 21
- SUP 4: 3882.00 Low Jul 19 and a key support
EUROSTOXX 50 futures started the week on a soft and despite recent gains, a bearish threat remains present. The contract Monday cleared 4060.50, Aug 19 low strengthening a S/T bearish cycle. This follows Friday's move below 4104.50, Sep 9 low that confirmed a bearish price sequence of lower lows and lower highs. Scope is for weakness towards 3962.50 next, a Fibonacci retracement. Initial resistance is seen at 4102.50, Sep 20 high.
E-MINI S&P (Z1): Heavy Below The 50-Day EMA
- RES 4: 4539.50 High Sep 3 and the bull trigger
- RES 1: 4519.75 High Sep 9
- RES 3: 4478.50 High Sep 16
- RES 1: 4407.72/18.00 50-day EMA / High Sep 20
- PRICE: 4348.00 @ 05:46 BST Sep 22
- SUP 1: 4293.75 Low Sep 20 and the bear trigger
- SUP 2: 4243.50 Low Jul 20
- SUP 3: 4214.50 Low Jul 19 and a key support
- SUP 4: 4117.00 Low Jun 21
S&P E-minis remain above 4293.75, Monday's low. The outlook is bearish following the clear breach this week of the 50-day EMA. A key short-term support and bear trigger has been established at 4293.75. Price needs to trade above Monday's high of 4418.00 to suggest the tide may have turned and signal scope for stronger recovery. Note a break of 4418.00 would also see price move back above the 50-day EMA and this would be positive.
COMMODITIES
BRENT TECHS: (X1) Bullish Doji Candle
- RES 4: $80.00 - Psychological round number
- RES 3: $78.13 - 0.764 proj of the Aug 23 - Sep 3 - Sep 9 price swing
- RES 2: $76.74 - 0.618 proj of the Aug 23 - Sep 3 - Sep 9 price swing
- RES 1: $76.13 - High Sep 15 and the bull trigger
- PRICE: $75.28 @ 06:40 BST Sep 22
- SUP 1: $73.00/70.88 - 20-day EMA / Low Sep 9 and bear trigger
- SUP 2: $69.77/$68.13 - Low Aug 26 / Low Aug 24
- SUP 3: $64.20 - Low Aug 23
- SUP 4: $63.54 - Low May 21 and a key support
Brent futures have recovered from recent lows and yesterday's price formation is a doji candle, reinforcing a bullish theme. The contract breached the Jul 6 high of $75.87 last week. This confirmed a resumption of the broader uptrend and strengthened a bullish case, following the recent bear channel breakout. The channel was drawn off the Jul 6 high. The focus is on $76.7, a Fibonacci projection. Key support is at $70.88, Sep 9 low.
WTI TECHS: (X1) Bullish Price Structure
- RES 4: $75.00 - Round number resistance
- RES 3: $74.08 - 0.764 proj of the Aug 23 - Sep 2 - Sep 9 price swing
- RES 2: $73.58 - High Jul 6 and the bull trigger
- RES 1: $72.87 - High Sep 15
- PRICE: $71.55 @ 07:09 BST Sep 22
- SUP 1: $69.39 - Low Sep 21
- SUP 2: $67.35 - Low Sep 9 and key support
- SUP 3: $67.15 - Low Aug 24
- SUP 4: $61.50 - Low Aug 23 and the bear trigger
WTI futures maintain a bullish outlook following last week's gains. Yesterday's price pattern is a bullish doji candle, reinforcing the current utrend. Last week's gains resulted in a break of the bear channel top drawn off the Jul 6 high. The move higher strengthens a bullish theme and signals scope for further S/T gains. The focus is on $73.58 next, Jul 6 high and the bull trigger. Key support is at $67.35, Sep 9 low.
GOLD TECHS: Gains Considered Corrective
- RES 4: $1844.9 - Low Jun 14
- RES 3: $1834.1 - High Jul 15 and the bull trigger
- RES 2: $1808.7 - High Sep 14
- RES 1: $1786.8 - 20-day EMA
- PRICE: $1779.7 @ 07:24 BST Sep 22
- SUP 1: $1742.3 - Low Sep 20
- SUP 2: $1724.5 - 76.4% retracement of the Aug 9 - Sep 3 rally
- SUP 3: $1690.6 - Low Aug 08 and the bear trigger
- SUP 4: $1678.00 Low Mar 31
Gold traded sharply lower on Sep 16. The move resulted in a break of support at $1774.5, Aug 19 low and a test of $1745.4, 61.8% retracement of the Aug 9 - Sep 3 rally. The retracement remains exposed and short-term gains are considered corrective. A resumption of weakness would open the key support at $1690.6 further out, Aug 9 low. Initial firm resistance has been defined at $1808.7, Sep 14 high. A break would ease bearish pressure.
SILVER TECHS: Downtrend Still Intact
- RES 4: $25.206 - High Jun 8
- RES 3: $24.867 - High Sep 3 and the reversal trigger
- RES 2: $24.411 - High Sep 8
- RES 1: $23.515 - 20-Day EMA
- PRICE: $22.857 @ 07:27 BST Sep 22
- SUP 1: $22.039 - Low Sep 20
- SUP 2: $21.899 - Low Nov 30, 2020
- SUP 3: $21.677 - Low Sep 24
- SUP 4: $20.871 - 50.0% retracement of the Mar '20 - Feb '21 rally
Silver remains bearish following last week's sharp losses that resulted in a breach of support at $22.626, Aug 9 low. The metal traded lower again Monday. A bearish theme was also recently reinforced following the failure to clear the 50-day EMA that continues to provide resistance. With $22.626 cleared, the focus is on $21.899 next, Nov 30, 2020 low. Key trend resistance has been defined at $24.867, Sep 3 high.
Why MNI
MNI is the leading provider
of intelligence and analysis on the Global Fixed Income, Foreign Exchange and Energy markets. We use an innovative combination of real-time analysis, deep fundamental research and journalism to provide unique and actionable insights for traders and investors. Our "All signal, no noise" approach drives an intelligence service that is succinct and timely, which is highly regarded by our time constrained client base.Our Head Office is in London with offices in Chicago, Washington and Beijing, as well as an on the ground presence in other major financial centres across the world.