
Why MNI
MNI is the leading provider
of intelligence and analysis on the Global Fixed Income, Foreign Exchange and Energy markets. We use an innovative combination of real-time analysis, deep fundamental research and journalism to provide unique and actionable insights for traders and investors. Our "All signal, no noise" approach drives an intelligence service that is succinct and timely, which is highly regarded by our time constrained client base.Our Head Office is in London with offices in Chicago, Washington and Beijing, as well as an on the ground presence in other major financial centres across the world.
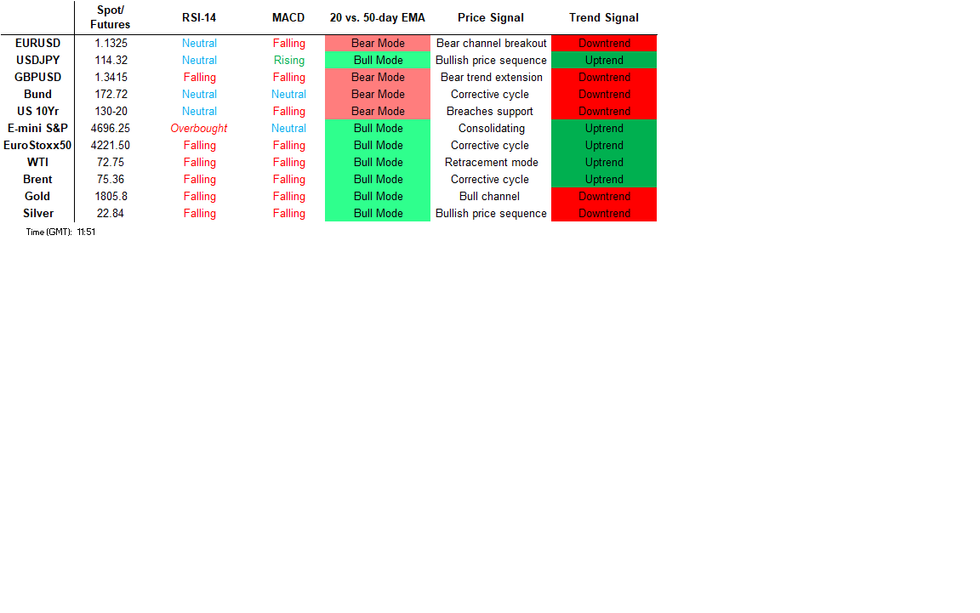
Price Signal Summary - S&P E-Minis Climb Exposes The ATH
- In the equity space, S&P E-minis futures bounced this week from Monday’s low of 4520.25. The contract traded higher again yesterday and is holding onto this week’s gains. Note too that the price is above the 50-day EMA, 4595.14. This is a bullish short-term development and suggests scope for an extension higher. The key resistance and bull trigger is 4743.23, the all-time high from Dec 16. EUROSTOXX 50 futures are trading at this week’s highs and short-term bullish conditions have improved following yesterday’s gains through the 50-day EMA. The continuation opens resistance at 4234.00, the Dec 16 high and a firmer resistance at 4270.00, Dec 8 high.
- In FX, EURUSD is still trading sideways. The pair remains below resistance at 1.1383, Nov 30 high where a break is required to signal potential for a stronger recovery. Support to watch lies at 1.1222, Dec 15 low and 1.1186, Nov 24 low. The latter is a key support and the bear trigger. GBPUSD is firmer this morning. The rally Wednesday has eased recent bearish pressure and today’s break of resistance at 1.3374, the Dec 16 high suggests potential for an extension of current gains. The focus is on the 50-day EMA at 1.3414. The USDJPY traded higher Wednesday and the pair breached resistance at last Weds/Thurs' 114.25/26 highs. A clear break of this hurdle would strengthen bullish conditions and open 114.38, the 61.8% Fibonacci retracement of the Nov 24 - 30 downleg and also signal potential for a stronger rally. The 76.4% level is at 114.81.
- On the commodity front, last week’s channel break in Gold appears to have been a false one and the strong recovery from the Dec 15 low of $1753.7, suggests the yellow metal is reversing its recent downtrend. Watch resistance at $1815.6, the Nov 26 high. A breach would strengthen bullish conditions. Support is at $1773.1, the channel base. WTI futures have recovered from Monday’s low of $66.12 and once again traded higher yesterday. The contract has probed key near-term resistance at $73.13, the Dec 9 high. A clear break of this hurdle would remove the recent bearish threat and instead suggest scope for a stronger recovery towards $74.54 initially, 61.8% of the Oct - Dec sell-off.
- In the FI space, Bund futures have breached support at 173.40, the Dec 8 low. This also means that the price is trading back below the 20-day EMA. The break suggests scope for a deeper short-term pullback and has opened 172.70 next, the Nov 26 low. Gilts yesterday breached support at 125.44, Nov 26 low. This opens 124.94 next, the Nov 25 high and gap low on the daily chart.
FOREIGN EXCHANGE
EURUSD TECHS: Firmer Inside Its Range
- RES 4: 1.1513 Bear channel top from Jun 1 high
- RES 3: 1.1514 Low Nov 5
- RES 2: 1.1404 50-day EMA
- RES 1: 1.1360/83 High Dec 16 / High Nov 30
- PRICE: 1.1340 @ 06:07 GMT Dec 23
- SUP 1: 1.1222 Low Dec 15
- SUP 2: 1.1186/85 Low Nov 24 / Low Jul 1, 2020
- SUP 3: 1.1128 1.764 proj of the Jan 6 - Mar 31 - May 25 price swing
- SUP 4: 1.1040 76.4% retracement of the Mar ‘20 - Jan ‘21 uptrend
EURUSD traded higher Wednesday. Price action remains in a range though and is holding above initial support at 1.1222, the Dec 15 low. Key resistance at 1.1383 is also intact, Nov 30 high. A break of this hurdle is required to signal potential for a stronger recovery towards 1.1404 the 50-day EMA. The trend remains down though and the trigger for a resumption of bearish activity is 1.1186/85 where a break would open 1.1128, a Fibonacci projection.
GBPUSD TECHS: Clears Resistance
- RES 4: 1.3698 High Nov 4
- RES 3: 1.3607 High Nov 9
- RES 2: 1.3514 High Nov 18 and a key resistance
- RES 1: 1.3414 50-day EMA
- PRICE: 1.3404 @ 10:11 GMT Dec 23
- SUP 1: 1.3240/3163 Low Dec 22 / Low Dec 08 and the bear trigger
- SUP 2: 1.3135 Low Dec 11 2020
- SUP 3: 1.3127 1.0% 10-dma envelope
- SUP 4: 1.3084 1.50 proj of the Sep 14 - 29 - Oct 20 price swing
GBPUSD is firmer this morning. The rally Wednesday eased recent bearish pressure and today’s break of resistance at 1.3374, the Dec 16 high suggests potential for an extension of current gains. The focus is on the 50-day EMA at 1.3414. On the downside, a return lower would signal a resumption of the recent bearish threat and attention would once again turn to support at 1.3163, the Dec 8 low and bear trigger.
EURGBP TECHS: Through Initial Support
- RES 4: 0.8658 High Sep 29 and a key resistance
- RES 3: 0.8624 High Oct 1
- RES 2: 0.8600 High Dec 8 and the bull trigger
- RES 1: 0.8503/53 50-day EMA / High Dec 10 / 14 and key resistance
- PRICE: 0.8442 @ 10:23 GMT Dec 23
- SUP 1: 0.8432 76.4% retracement of the Nov 22 - Dec 8 rally
- SUP 2: 0.8411 Low Nov 26
- SUP 3: 0.8381 Low Nov 22 and the bear trigger
- SUP 4: 0.8356 Low Feb 26, 2020
EURGBP is trading lower today, extending the sell-off from Monday’s high. The cross has cleared support at 0.8454, Dec 16 low and this has strengthened the short-term bearish condition. The move lower opens 0.8411, Nov 26 low and the key support at 0.8381, Nov 22 low. Initial firm resistance is unchanged at 0.8553, Dec 10 / 14 high. Clearance of this level is required to reinstate the recent bullish theme.
USDJPY TECHS: Firmer Tone
- RES 4: 116.09 1.764 proj of Apr 23 - Jul 2 - Aug 4 price swing
- RES 3: 115.52 High Nov 24 and the bull trigger
- RES 2: 114.81 76.4% of the Nov 24 - 30 downleg
- RES 1: 114.38 61.8% retracement of the Nov 24 - 30 downleg
- PRICE: 114.20 @ 06:22 GMT Dec 23
- SUP 1: 113.14 Low Dec 17
- SUP 2: 112.53 Low Nov 30 and the bear trigger
- SUP 3: 112.08 High Sep 30 and a recent breakout level
- SUP 4: 111.32 61.8% retracement of the Aug - Nov rally
USDJPY traded higher Wednesday and the pair breached resistance at last Weds/Thurs' 114.25/26 highs. A clear break of this hurdle would strengthen bullish conditions and open 114.38, the 61.8% Fibonacci retracement of the Nov 24 - 30 downleg and also signal potential for a stronger rally. A resumption of weakness would instead expose key support at 112.53, Nov 30 low. Watch initial firm support at 113.14, the Dec 17 low.
EURJPY TECHS: Key Resistance Appears Exposed
- RES 4: 131.59 High Nov 5
- RES 3: 130.43 50.0% retracement of the Oct 20 - Dec 3 downleg.
- RES 2: 129.99 High Nov 19
- RES 1: 129.64 High Dec 16
- PRICE: 129.48 @ 06:29 GMT Dec 23
- SUP 1: 128.65/127.52 20-day EMA / Low Dec 20
- SUP 2: 127.39 Low Dec 3 / 6 and the bear trigger
- SUP 3: 127.28 1.00 proj of the Jun 1 - Sep 22 - Oct 20 price swing
- SUP 4: 127.04/126.65 Low Feb 15 / Low Feb 10
EURJPY found support Monday and has retraced almost all of the recent sell-off between Dec 16 - 20. Attention is on 129.64, the Dec 16 high where a break would strengthen bullish conditions and signal a short-term reversal. This would open 130.43, a Fibonacci retracement. Key support is at 127.39, the Dec 3 / 6 low. A break would resume the downtrend. Initial support is at 128.65, the 20-day EMA.
AUDUSD TECHS: Key Resistance Breached
- RES 4: 0.7341 61.8% retracement of the Oct 28 - Dec 3 downleg
- RES 3: 0.7309 Former channel base drawn from the Aug 20 low
- RES 2: 0.7275 61.8% of the Oct 28 - Dec 3 downleg
- RES 1: 0.7242 Intraday high
- PRICE: 0.7239@ 10:30 GMT Dec 23
- SUP 1: 0.7166 20-day EMA
- SUP 2: 0.7082/7040 Low Dec 20 / Low Dec 7
- SUP 3: 0.6993/91 Low Dec 3 / Low Nov 2 2020 and a key support
- SUP 4: 0.6963 Low Jul 16 2020
AUDUSD has today breached the Dec 16 high of 0.7224. Recently, attention has been on support at 0.7090, the Dec 14 low that was probed Monday. A clear break would strengthen a short-term bearish threat and expose support at 0.7040, Dec 7 low. For bulls, a clear break of 0.7224 would trigger a resumption of bullish activity. The 50-day EMA at 0.7233 has been breached too, the focus is on 0.7275, a Fibonacci retracement.
USDCAD TECHS: Corrective Pullback From Monday’s High
- RES 4: 1.3173 High Nov 13, 2020
- RES 3: 1.3091 High Nov 24, 2020
- RES 2: 1.3024/39 38.2% Mar ‘20-Jun ‘21 downleg / 2.0% 10-dma env
- RES 1: 1.2964 High Dec 20
- PRICE: 1.2838 @ 06:36 GMT Dec 23
- SUP 1: 1.2764 Dec 16 and key S/T support
- SUP 2: 1.2706 Low Dec 13
- SUP 3: 1.2608 Low Dec 8 and key support
- SUP 4: 1.2585 Low Nov 19
USDCAD traded higher Monday, confirming a resumption of its uptrend and did probe key resistance at 1.2949, Aug 20 high. Monday’s price action negates the recent shooting star reversal pattern posted last week and this reinforces the current bull cycle. A clear break of 1.2949 would open 1.3024, a Fibonacci retracement and 1.3091 beyond. To the downside, 1.2764, the Dec 16 low is the support to watch. Dips are currently considered corrective.
FIXED INCOME
BUND TECHS: (H2) Remains Vulnerable
- RES 4: 176.00 Round number resistance
- RES 3: 175.57 1.618 proj of the Nov 11 - 22 - 24 price swing
- RES 2: 175.29 1.50 proj of the Nov 11 - 22 - 24 price swing
- RES 1: 174.44/75.02 High Dec 21 / High Dec 8 and the bull trigger
- PRICE: 173.10 @ 05:22 GMT Dec 23
- SUP 1: 172.97 Intraday low
- SUP 2: 172.70 Low Nov 26
- SUP 3: 171.77 Low Nov 24 and key near-term support
- SUP 4: 170.72 Low Nov 4
Bund futures traded lower again yesterday. The contract has breached support at 173.40, the Dec 8 low. This also means that the price is trading back below the 20-day EMA. The break lower places a recent bullish focus on hold and suggests scope for a deeper short-term pullback. Scope is seen for a move towards 172.70, the Nov 26 low. On the upside, key resistance and the bull trigger is unchanged at 175.02, the Dec 8 high.
BOBL TECHS: (H2) Probes Key Support
- RES 4: 135.126 1.382 pro of the Nov 11 - 22 - 23 price swing
- RES 3: 134.978 1.236 pro of the Nov 11 - 22 - 23 price swing
- RES 2: 134.740 1.00 pro of the Nov 11 - 22 - 23 price swing
- RES 1: 134.400/530 High Dec 13 / High Nov 30 and the bull trigger
- PRICE: 133.780 @ 05:27 GMT Dec 23
- SUP 1: 133.650 Low Dec 22
- SUP 2: 133.610 Low Nov 16
- SUP 3: 133.410 Low Nov 11 and a key support
- SUP 4: 133.200 Low Nov 3
Bobl futures traded lower again yesterday. Futures have probed the Dec 8 low of 133.710. A clear breach of this level would strengthen a bearish case, highlight a short-term reversal and open 133.410, the Nov 11 low. For bulls, key resistance is at 134.530, the Nov 30 high. A break of this hurdle is required to resume bullish activity and pave the way for a climb towards 134.740. A Fibonacci projection.
SCHATZ TECHS: (H2) Remains Below Monday’s High
- RES 4: 112.375 1.382 proj of the Nov 16 - 26 - Dec 1 price swing
- RES 3: 112.350 1.236 proj of the Nov 16 - 26 - Dec 1 price swing
- RES 2: 112.305 High Nov 26 and the bull trigger
- RES 1: 112.265 High Dec 20
- PRICE: 112.145 @ 05:19 GMT Dec 23
- SUP 1: 112.130 Low Dec 22
- SUP 2: 112.055 Low Dec 16 and key support
- SUP 3: 112.031 1.236 proj of the Nov 26 - Dec 1 - Dec 3 price swing
- SUP 4: 112.007 1.382 proj of the Nov 26 - Dec 1 - Dec 3 price swing
Schatz futures edged lower yesterday, extending the pullback from Monday’s high. Price is still trading inside its recent range though. Attention is on resistance at 112.235, the Dec 2 / 3 high that was breached Monday. A clear break would be a bullish development and open the key resistance hurdle at 112.305, Nov 26 high. 112.055 marks the key support, Dec 16 low. A break is required to see bearish pressure return.
GILT TECHS: (H2) Remains Weak
- RES 4: 128.18 High Sep 10 / 14 (cont)
- RES 3: 127.94/128.00 61.8% of Aug - Oct move (cont) / High Aug 31
- RES 2: 127.47/67 High Dec 20 / High Dec 8
- RES 1: 126.76 High Dec 21
- PRICE: 125.65 @ Close Dec 22
- SUP 1: 125.36 Low Dec 22
- SUP 2: 125.44 Low Nov 26 and gap high
- SUP 3: 124.94 High Nov 25 and gap low
- SUP 4: 124.48 Low Nov 25
A steep sell-off in Gilt futures Tuesday resulted in a break of support at 126.34, Dec 16 low and the contract is trading below its 20-day EMA. The break lower places on hold a recent bullish focus and instead signals scope for a deeper pullback. Attention is on support at 125.44, the Nov 26 low and a gap high on the daily chart that was probed yesterday. This opens 124.94 next. Resistance is at 126.76, the Dec 21 high.
BTP TECHS: (H2) Approaching Key Support
- RES 4: 152.71 1.00 proj of the Nov 1 - 22 - 24 price swing
- RES 3: 151.45 0.764 proj of the Nov 1 - 22 - 24 price swing
- RES 2: 151.00 Round number resistance
- RES 1: 149.47/150.66 20-day EMA / High Dec 6 and the bull trigger
- PRICE: 147.81 @ 10:18 GMT Dec 22
- SUP 1: 147.70 Intraday low
- SUP 2: 147.36 Low Nov 24 and key support
- SUP 3: 146.55 76.4% retracement of the Nov 1 - 22 rally
- SUP 4: 145.29 Low Nov 1 and the bear trigger
BTP futures remain heavy following the sell-off this week. The contract has today breached support at 148.25, Dec 1 low. The break strengthen bearish conditions and paves the way for a move towards 147.36, the Nov 24 low and a key support. Key resistance is at 150.66, the Dec 6 high. A clear break of this hurdle is required to reinstate a bullish theme and open the 151.00 handle.
EQUITIES
EUROSTOXX 50 TECHS: (H2) Holding Onto This Week’s Gains
- RES 4: 4305.00 High Nov 23
- RES 3: 4295.10 76.4% retracement of the Nov 18 - 30 sell-off
- RES 2: 4270.00 High Dec 8 and a key resistance
- RES 1: 4234.00 High Dec 16
- PRICE: 4115.50 @ 06:00 GMT Dec 23
- SUP 1: 4108.50/4026.00 Low Dec 21 / Low Dec 20
- SUP 2: 3980.00 Low Nov 30 and the bear trigger
- SUP 2: 3935.00 Low Oct 6
- SUP 4: 3857.50 1.00 proj of the Nov 18 - 30 - Dec 8 price swing
EUROSTOXX 50 futures have recovered from Monday’s sharp sell-off and the 4026.00 low. The contract is trading at this week’s highs and short-term bullish conditions have improved following yesterday’s gains through the 50-day EMA. A continuation would open resistance at 4234.00, the Dec 16 high and a firmer resistance at 4270.00, Dec 8 high. On the downside, the first key short-term support has been defined at 4026.00, the Dec 20 low.
E-MINI S&P (H2): Extends Rebound From Monday’s Low
- RES 4: 4854.19 0.764 proj of the Oct 1 - Nov 22 - Dec 3 price swing
- RES 1: 4800.00 Round number resistance
- RES 2: 4783.78 0.618 proj of the Oct 1 - Nov 22 - Dec 3 price swing
- RES 1: 4668.00/4743.25 High Dec 17 / High Dec 16 and the ATH
- PRICE: 4689.25 @ 06:47 GMT Dec 23
- SUP 1: 4595.14/4520.25 50-day EMA / Low Dec 20
- SUP 2: 4485.75 Low Dec 3 and bear trigger
- SUP 3: 4493.88 61.8% retracement of the Oct 1 - Nov 22 rally
- SUP 4: 4436.97 76.4% retracement of the Oct 1 - Nov 22 rally
S&P E-minis started the week on a softer note but futures have bounced from Monday’s low of 4520.25. The contract traded higher again yesterday and is holding onto this week’s gains. Note too that the price is above the 50-day EMA, 4595.14. This is a bullish short-term development and suggests scope for an extension higher. The key resistance and bull trigger is 4743.23, the all-time high. Key short-term support is at 4520.25, the Dec 20 low.
COMMODITIES
BRENT TECHS: (G2) Remains Below Key Short-Term Resistance
- RES 4: $81.88 - High Nov 24
- RES 3: $80.42 - High Nov 26
- RES 2: $76.17/70 -50-day EMA / High Dec 9
- RES 1: $75.79 Intraday high
- PRICE: $75.37 @ 06:56 GMT Dec 23
- SUP 1: $69.24 - Low Dec 3
- SUP 2: $65.72 - Low Dec 2 and the bear trigger
- SUP 3: $62.95 - Low Aug 23 and a key support
- SUP 4: $62.54 - Low May 21
Brent futures started the week on a bearish note but the contract has recovered from that day’s low of $69.28. A bearish threat remains present though despite recent gains - futures have recently cleared support at $72.50, Dec 15 low and confirmed an extension of the pullback from $76.70, Dec 9 high. A break of $69.28 would open $65.72, the Dec 2 low. Key resistance is at $76.70, the Dec 9 high. A break would alter the picture.
WTI TECHS: (G2) Probes Key Resistance
- RES 4: $78.59 - High Nov 24
- RES 3: $77.59 - High Nov 26
- RES 2: $74.54 - 61.8% retracement of the Oct - Dec sell-off
- RES 1: $73.27 - Intraday high
- PRICE: $72.77 @ 07:05 GMT Dec 23
- SUP 1: $68.56/66.12 - Low Dec 21 / Low Dec 20
- SUP 2: $65.45 - Low Dec 3
- SUP 3: $62.26 - Low Dec 2 and the bear trigger
- SUP 4: $60.52 - Low Aug 20 and a key support
WTI futures have recovered from Monday’s low of $66.12 and once again traded higher yesterday. The contract has probed key near-term resistance at $73.13, the Dec 9 high. A clear break of this hurdle would remove the recent bearish threat and instead suggest scope for a stronger recovery towards $74.54 initially, a Fibonacci retracement. Key short-term support has been defined at Monday’s $66.12 low.
GOLD TECHS: Base Building
- RES 4: $1877.2/1900.5 High Nov 16 / Bull channel top
- RES 3: $1849.1 - High Nov 22
- RES 2: $1830.0 - 61.8% retracement of the Nov 16 - Dec 15 downleg
- RES 1: $1815.6 - High Nov 26 and the near-term bull trigger
- PRICE: $1806.9 @ 07:24 GMT Dec 23
- SUP 1: $1784.9/1773.1 - Low Dec 21 / Channel base from Aug 9 low
- SUP 2: $1753.7 - Low Dec 15 and a key support
- SUP 3: $1746.0 - Oct 6 low
- SUP 4: $1721.7 - Low Sep 29
Gold traded higher last week but has since pulled back from last Friday’s high. A bullish focus remains intact and yesterday’s gains are a positive development. The yellow metal is still showing signs of base building following the recent false bearish break of the channel base from the Aug 9 low. Attention is on $1815.6, the Nov 26 high. Initial firm support to watch is seen at $1773.1, the channel base.
SILVER TECHS: Bullish Extension
- RES 4: $24.323 - High Nov 23
- RES 3: $23.772 - High Nov 24
- RES 2: $23.030/165 - High Dec 1 / 50-day EMA
- RES 1: $22.903 - Intraday high
- PRICE: $22.833 @ 10:37 GMT Dec 23
- SUP 1: $22.182/21.918 - Low Dec 21 / Low Dec 16
- SUP 2: $21.427/423 - Low Dec 15 / Low Sep 29 and key support
- SUP 3: $20.871 - 50.0% retracement of the Mar ‘20 - Feb ‘21 rally
- SUP 4: $20.000 - Psychological round number
Silver maintains a firmer tone having rebounded from last week’s low of $21.427 on Dec 15. In pattern terms, price action on Dec 15 is a bullish hammer formation and subsequent gains have reinforced this reversal signal. Attention is on $23.165, the 50-day EMA. A clear break would strengthen the developing bullish condition and signal scope for an extension higher. Key support lies at $21.427 and $21.423.
Why MNI
MNI is the leading provider
of intelligence and analysis on the Global Fixed Income, Foreign Exchange and Energy markets. We use an innovative combination of real-time analysis, deep fundamental research and journalism to provide unique and actionable insights for traders and investors. Our "All signal, no noise" approach drives an intelligence service that is succinct and timely, which is highly regarded by our time constrained client base.Our Head Office is in London with offices in Chicago, Washington and Beijing, as well as an on the ground presence in other major financial centres across the world.