
Why MNI
MNI is the leading provider
of intelligence and analysis on the Global Fixed Income, Foreign Exchange and Energy markets. We use an innovative combination of real-time analysis, deep fundamental research and journalism to provide unique and actionable insights for traders and investors. Our "All signal, no noise" approach drives an intelligence service that is succinct and timely, which is highly regarded by our time constrained client base.Our Head Office is in London with offices in Chicago, Washington and Beijing, as well as an on the ground presence in other major financial centres across the world.
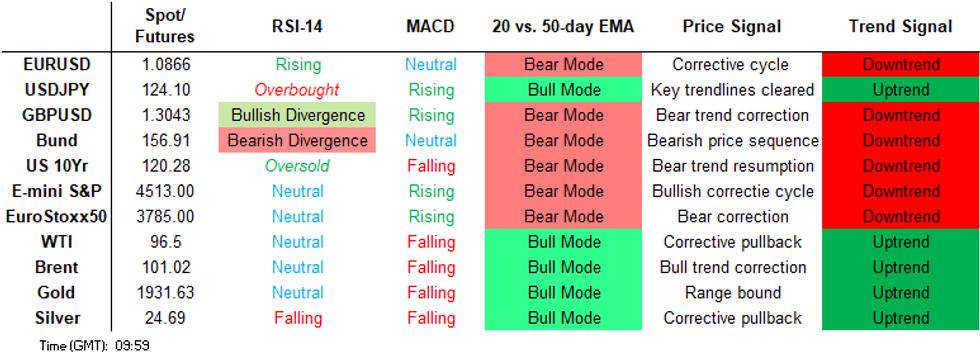
Price Signal Summary - S&P E-Minis Find Support At The 50-Day EMA
- In the equity space, S&P E-Minis traded lower Wednesday/Thursday. The contract arrived at its key support area - the 50-day EMA. This average intersects at 4455.32 and marks a key pivot level. A clear break would strengthen a bearish case and allow for a deeper pullback that would open 4425.96 initially, 38.2% retracement of the Feb 24 - Mar 29 rally. The EMA has thus far provided support. Resistance is at 4588.75, the Apr 5 high. EUROSTOXX 50 futures also traded lower this week. Price has moved below the 20- and 50-day EMAs and probed support at 3735.00, the Mar 18 low. The move lower undermines the recent bull theme and highlights a developing bearish threat. An extension lower would open 3626.50, 50.0% of the Ma r 7 - 29 rally. The contract is attempting a recovery from recent lows. Key short-term resistance has been defined at 3944.00, the Mar 29 high.
- In FX, EURUSD is trading lower. The recent failure at 1.1185, Mar 31 high, and more importantly, a failure above the 50-day EMA highlights a bearish threat. This week’s move lower has reinforced this theme and attention is on 1.0806, the Mar 7 low and a bear trigger. GBPUSD remains vulnerable and the focus is on 1.3000 next, the Mar 15 low and the near-term bear trigger. Key resistance is unchanged at the 50-day EMA - it intersects at 1.3261 today. USDJPY remains above last week’s low of 121.28 (Mar 31) and below its key resistance of 125.09, the Mar 28 trend high. A corrective cycle is still in play despite recent gains. A break of 121.28 would allow for an extension lower and open 120.95, Mar 24 low ahead of 120.00. For bulls, clearance of 125.09 would confirm a resumption of the primary uptrend.
- On the commodity front, Gold remains inside its range. The yellow metal recently found support at $1890.2, on Mar 29, and this level still represents the short-term bear trigger. Initial resistance is at $1966.1, Mar 24 high. In the Oil space, WTI futures traded lower this week, resulting in a breach of the 50-day EMA. The print below this average suggests scope for a continuation lower near-term. The focus is on the next key support at $92.20, Mar 15 low. Initial firm resistance has been defined at $105.59, the Apr 5 high.
- In the FI space, Bund futures traded lower again yesterday. Key near-term resistance is seen at 159.79, the Apr 4 high. The focus is on the bear trigger at 156.05, Mar 29 low where a break would confirm a resumption of the downtrend. Gilts traded to a fresh trend low yesterday of 119.83. This reinforces bearish conditions and scope is for weakness towards 119.36, the Oct 10 2018 low (cont). Resistance is at 122.35, Monday’s high.
FOREIGN EXCHANGE
EURUSD TECHS: Approaching The Bear Trigger
- RES 4: 1.1222 61.8% of Feb 10 - Mar 7 sell-off
- RES 3: 1.1185/1214 High Mar 31 / 3.0% Upper Bollinger Band
- RES 2: 1.1109 50-day EMA
- RES 1: 1.1009 20-day EMA
- PRICE: 1.0865 @ 09:35 BST Apr 8
- SUP 1: 1.0848 Low Mar 8
- SUP 2: 1.0806 Low Mar 7 and the bear trigger
- SUP 3: 1.0767 Low May 7 2020
- SUP 4: 1.0727 Low Apr 24, 2020
EURUSD is trading lower this morning and sights are on the key support at 1.0806, the Mar 7 low and a bear trigger. The recent failure at 1.1185, Mar 31 high, and an inability to remain above the 50-day EMA, highlights a bearish threat. This week’s move lower has reinforced this theme. A break of 1.0806 would confirm a resumption of the downtrend and open 1.0767, the May 7 2020 low. Clearance of 1.1185 is needed to reinstate a bull theme.
GBPUSD TECHS: Key Support Remains Exposed
- RES 4: 1.3439 High Feb 25
- RES 3: 1.3398 61.8% retracement of the Feb 10 - Mar 15 downleg
- RES 2: 1.3261/98 50-day EMA / High Mar 23
- RES 1: 1.3183 High Mar 30
- PRICE: 1.3047 @ 09:34 BST Apr 8
- SUP 1: 1.3026/3000 Intraday low / Low Mar 15 and the bear trigger
- SUP 2: 1.2954 1.764 proj of the Jan 13 - 27 - Feb 10 price swing
- SUP 3: 1.2933 Low Nov 5 2020
- SUP 4: 1.2855 Low Nov 2 2020 and a key support
GBPUSD is also trading at this week’s lows. The short-term outlook remains bearish. This follows the recent pullback from 1.3298, the Mar 23 high, that confirmed a failure above a number of short-term resistance points. The 50-day EMA, at 1.3261 today, represents a key resistance. The focus is on 1.3000, Mar 15 low and a bear trigger. Clearance of the 50-day EMA is required to highlight a short-term reversal.
EURGBP TECHS: Remains Vulnerable
- RES 4: 0.8624 High Oct 1 2021
- RES 3: 0.8600 High Dec 8 2022
- RES 2: 0.8512/59 High Mar 31 / 2.0% 10-dma envelope
- RES 1: 0.8377/8435 50-day EMA / High Apr 4
- PRICE: 0.8310 @ 06:34 BST Apr 8
- SUP 1: 0.8296 Low Mar 23 and a key support
- SUP 2: 0.8276 76.4% retracement of the Mar 7 - 31 rally
- SUP 3: 0.8203 Low Mar 7 and the bear trigger
- SUP 4: 0.8117 High Apr 7 2016
EURGBP is weaker this morning and remains vulnerable. This week’s move lower marks an extension of the reversal from the 0.8512 high on Mar 31. The recent move lower signals scope for a continuation of the bear leg and the cross has traded through both the 20- and 50-day EMAs. The focus is on 0.8296, the Mar 23 low. On the upside, Initial resistance is seen at Monday’s 0.8377 high, the 50-day EMA.
USDJPY TECHS: Key Resistance Remains Intact
- RES 4: 126.26 3.382 proj of the Dec 3 ‘21 - Jan 4 -24 price swing
- RES 3: 125.86 High Jun 5 2015 and a major resistance
- RES 2: 125.28 High Aug 12 2015
- RES 1: 124.23/125.09 Intraday high / High Mar 28 and the bull trigger
- PRICE: 124.00 @ 06:39 BST Apr 8
- SUP 1: 122.38 Low Apr 5
- SUP 2: 121.28 Low Mar 31 and a bear trigger
- SUP 3: 120.00 Round number support
- SUP 4: 119.44 Low Mar 22
USDJPY is holding on to recent gains and the pair remains above 121.28, the Mar 31 low. A corrective cycle is still in play though despite recent gains. 121.28 represents a key short-term support. A break of this level would allow for an extension lower and open 120.95, Mar 24 low ahead of the 120.00 handle. On the upside, clearance of 125.09, the Mar 28 high and bull trigger, would confirm a resumption of the primary uptrend.
EURJPY TECHS: Consolidation Mode
- RES 4: 139.00 High Aug 21 2015 and a key resistance
- RES 3: 138.62 High Aug 25 2015
- RES 2: 137.50/53 High Feb 2 ‘18 and major resistance / High Mar 28
- RES 1: 135.88 High Apr 1
- PRICE: 134.65 @ 06:45 BST Apr 8
- SUP 1: 133.94 Low Mar 28
- SUP 2: 133.45 20-day EMA
- SUP 3: 131.74 50-day EMA
- SUP 4: 130.72 Low Mar 17
EURJPY is consolidating. The recent pullback is still considered corrective and the move lower is allowing an overbought condition to unwind. Support to watch is 133.94, Mar 28 low, a break would open the 20-day EMA at 133.31. The primary trend remains up. The cross traded to a fresh cycle high on Mar 28 following a break of key resistance at 134.13, Jun 1 2021 high, on Mar 24. This strengthened bullish conditions. The bull trigger is 137.50/53.
AUDUSD TECHS: Shooting Star Reversal Still In Play
- RES 4: 0.7776 High Jun 11 2021
- RES 3: 0.7762 76.4% retracement of the Feb ‘21 - Jan ‘22 downleg
- RES 2: 0.7716 High Jun 16 2021
- RES 1: 0.7661/65 High Apr 5 / 2.0% 10-dma envelope
- PRICE: 0.7485 @ 06:48 BST Apr 8
- SUP 1: 0.7450 20-day EMA
- SUP 2: 0.7376 Low Mar 22
- SUP 3: 0.7351 50-day EMA
- SUP 4: 0.7283 Low Mar 17
AUDUSD found resistance this week at 0.7661, Apr 5 high. The continued move lower highlights a short-term bearish threat and suggests potential for a correction. Note that Tuesday’s session is a bearish candle reversal pattern - a shooting star - and Wednesday’s weakness reinforces this pattern. A continuation lower would open 0.7450, the 20-day EMA. This average marks the next key support. Key resistance is at 0.7661.
USDCAD TECHS: Long-Legged Doji Highlights A Reversal
- RES 4: 1.2711 76.4% retracement of the Mar 8 - Apr 5 bear leg
- RES 3: 1.2699 High Mar 17
- RES 2: 1.2631 50-day EMA
- RES 1: 1.2612/21 High Mar 28 / 200 DMA
- PRICE: 1.2582 @ 07:04 BST Apr 8
- SUP 1: 1.2479 Low Apr 6
- SUP 2: 1.2403/2386 Low Apr 5 / 1.0% 10-dma envelope
- SUP 3: 1.2387 Low Nov 10 2021
- SUP 4: 1.2328 Low Oct 29 2021
USDCAD has recovered from its recent lows and maintains a firmer tone. Tuesday’s price action, in Japanese candlestick terms, is a long-legged doji. This is a short-term reversal signal and suggests potential for a continued correction near-term. The move higher Thursday narrows the gap with the 50-day EMA that intersects at 1.2631 - a key resistance. The broader trend remains down, key support and the bear trigger lies at 1.2403, Tuesday’s low.
FIXED INCOME
BUND TECHS: (M2) Trend Needle Still Pointing South
- RES 4: 162.73 High Mar 14
- RES 3: 161.81 High Mar 16
- RES 2: 160.31 High Mar 23
- RES 1: 159.79 High Apr 4 and key short-term resistance
- PRICE: 157.01 @ 04:56 BST Apr 8
- SUP 1: 156.40 Low Apr 7
- SUP 2: 156.05/00 Low Mar 29 / Round number support
- SUP 3: 155.70 Low Dec 7 2015 (cont)
- SUP 4: 155.03 Low Dec 4 2015 (cont)
Bunds are trading closer to this week’s lows and the recent corrective phase appears to be over. The primary trend is down. Moving average studies are in a bear mode and a broader bearish price sequence of lower lows and lower highs, that has unfolded since Aug / Sep 2019, remains intact. A continuation lower would open 156.00 and below. Firm resistance is at 159.79, the Apr 4 high where a break is required to signal a possible base.
BOBL TECHS: (M2) Trend Structure Still Bearish
- RES 4: 130.727 50-day EMA
- RES 3: 130.160 High Mar 23
- RES 2: 129.468 20-day EMA
- RES 1: 129.350 High Apr 4
- PRICE: 128.310 @ 05:03 BST Apr 8
- SUP 1: 127.770/750 Low Mar 29 / Low Jun 5 2015 (cont)
- SUP 2: 127.540 Low Jun 4 2015 (cont)
- SUP 3: 127.520 Low Sep 3 2014 (cont)
- SUP 4: 127.280 Low Sep 18 2014 (cont)
Bobl futures remain above recent lows but are also trading below the Apr 4 high of 129.350. The primary trend is down. Bearish price activity in March confirmed a resumption of the underlying downtrend to maintain the broader bearish price sequence of lower lows and lower highs. The focus is on a move towards 127.750 next, the Jun 5 2015 low (cont). The 20-day EMA at 129.468 marks a firm resistance.
SCHATZ TECHS: (M2) Bears Pause For Breath
- RES 4: 111.355 High Mar 21
- RES 3: 111.170 High Mar 23
- RES 2: 110.947 20-day EMA
- RES 1: 110.855 High Apr 4
- PRICE: 110.645 @ 05:07 BST Apr 8
- SUP 1: 110.465 Low Mar 30 and the bear trigger
- SUP 2: 110.410 Low May 8 2014 (cont)
- SUP 3: 110.400 Round number support
- SUP 4: 110.360 Low Apr 29 2014 (cont)
Schatz futures remain vulnerable and the current consolidation is likely a pause in the downtrend. Recent fresh cycle lows strengthened bearish conditions and confirmed a resumption of the primary downtrend plus, it maintains the broader bearish price sequence of lower lows and lower highs. 111.00 has recently been cleared and this paves the way for a move towards 110.410 next. Firm resistance is seen at 110.947 the 20-day EMA.
GILT TECHS: (M2) Fresh Cycle Low
- RES 4: 124.60 High Mar 8
- RES 3: 123.52 High Mar 9
- RES 2: 122.72 High Mar 18 and a key near-term resistance
- RES 1: 121.34/122.35 20-day EMA / High Apr 4
- PRICE: 120.17 @ Close Apr 7
- SUP 1: 119.83 Low Apr 7
- SUP 2: 119.75 123.6% retracement of the Feb 15 - Mar 1 climb
- SUP 3: 119.36 Low Oct 10 2018 (cont)
- SUP 4: 118.93 Low Apr 26 2016 (cont)
Gilt futures found resistance this week at 122.35, the Apr 4 high. The pullback means price has failed to remain above the 20-day EMA, and that a key resistance at 122.72, the Mar 18 high, also remains intact. The broader trend direction is down and yesterday’s fresh cycle low reinforces this theme. An extension lower would open 119.75 and 119.36. For bulls, clearance of 122.35/72 would suggest scope for a stronger bullish short-term cycle.
BTP TECHS: (M2) Bear Cycle Extension
- RES 4: 142.51 Low Mar 1
- RES 3: 140.71 High Mar 11
- RES 2: 139.23 High Mar 23
- RES 1: 138.68 High Mar 31 and key near-term resistance
- PRICE: 134.84 @ Close Apr 7
- SUP 1: 134.38 Low Apr 7
- SUP 2: 134.00 Round number support
- SUP 3: 132.61 Low Apr 22 2020 (cont)
- SUP 4: 131.50 76.4% retracement of the Mar ‘20 - Aug ‘21 rally (cont)
BTP futures traded lower again Thursday to extend this week’s breach of support at 135.69, the Mar 29 low. The move lower, confirms a resumption of the primary downtrend, and highlights a continuation of the broader bearish price sequence of lower lows and lower highs. The focus is on the 134.00 handle next. Firm resistance is seen at 138.68, the Mar 31 high, where a break is required to signal a short-term reversal.
EQUITIES
EUROSTOXX50 TECHS: (M2) Bearish Threat Remains Present
- RES 4: 4132.00 High Feb 10
- RES 3: 4072.00 High Feb 16
- RES 2: 3944.00/3965.50 High Mar 29 / High Feb 23
- RES 1: 3888.00 High Apr 5
- PRICE: 3747.00 @ 05:44 BST Apr 8
- SUP 1: 3701.40 38.2% retracement of the Ma r 7 - 29 rally
- SUP 2: 3626.50 50.0% retracement of the Ma r 7 - 29 rally
- SUP 3: 3551.60 61.8% retracement of the Ma r 7 - 29 rally
- SUP 4: 3523.00 Low Mar 11
EUROSTOXX 50 futures traded lower this week and in the process, price has moved below the 20- and 50-day EMAs and breached support at 3735.00, the Mar 18 low. The move lower undermines the recent bull theme and highlights a developing bearish threat. An extension lower would open 3626.50, a Fibonacci retracement. On the upside, key short-term resistance has been defined at 3944.00, the Mar 29 high.
E-MINI S&P (M2): 50-Day EMA Providing Support For Now
- RES 4: 4730.50 High Jan 1
- RES 3: 4663.50 High Jan 18
- RES 2: 4633.44 76.4% retracement of the Jan 4 - Feb 24 downleg
- RES 1: 4588.75 High Apr 5
- PRICE: 4493.75 @ 05:23 BST Apr 8
- SUP 1: 4455.32/4444.50 50-day EMA / Low Apr 6/7
- SUP 2: 4425.96 38.2% retracement of the Feb 24 - Mar 29 rally
- SUP 3: 4400.00 Round number support
- SUP 4: 4362.63 50.0% retracement of the Feb 24 - Mar 29 rally
S&P E-Minis are trading closer to this week’s lows. The contract has tested its key support area at the 50-day EMA, which intersects at 4455.32 today. This EMA marks a key pivot level. A clear break would strengthen a bearish case and allow for a deeper pullback that would open 4425.96 initially, a Fibonacci retracement. On the upside, a resumption of gains and an ability to remain above the 50-day EMA would be viewed as a bullish development.
and have breached Monday’s low of 4501.25. The pullback is still considered corrective and key support is unchanged at the 50-day EMA, which intersects at 4452.75. A clear break of this average is needed to signal a top. The initial bull trigger is at 4633.44, 76.4% of the Jan 4 - Feb 24 downleg and just above the Mar 29 high. A break would confirm a resumption of the past month's uptrend.COMMODITIES
BRENT TECHS: (M2) Probes The 50-Day EMA
- RES 4: $128.04 - High Mar 8
- RES 3: $125.40 - 76.4% retracement of the Mar 7 - 16 downleg
- RES 2: $112.28/119.74 - High Mar 30 / High Mar 24 and a bull trigger
- RES 1: $109.90 - High Apr 5
- PRICE: $100.74 @ 08:10 BST Apr 8
- SUP 1: $98.41 Low Apr 7
- SUP 2: $94.61 - Low Mar 16 and a key support
- SUP 3: $90.58 - Low Feb 25
- SUP 4: $84.74 - Low Feb 18
Brent futures remain vulnerable and the contract traded lower Thursday. Price has breached $102.19, Mar 29 low is challenging a key support at the 50-day EMA, that intersects at $100.59 today. A clear break of this EMA would suggest scope for a deeper decline and pave the way for a move towards $94.61, the Mar 16 low. $119.74 remains the key short-term resistance.
WTI TECHS: (K2) Bearish Outlook
- RES 4: $122.73 - High Mar 9
- RES 3: $116.64/118.34 - High Mar 24 / 76.4% of Mar 7 - 15 downleg
- RES 2: $108.75/112.93 -High Mar 30 / High Mar 28
- RES 1: $105.59 - High Apr 5
- PRICE: $96.39 @ 07:03 BST Apr 8
- SUP 1: $93.81 - Low Apr 6
- SUP 2: $92.20 - Low Mar 15 and a bear trigger
- SUP 3: $88.49 - Low Feb 25
- SUP 4: $85.81 - Low Feb 18
WTI futures have traded lower this week and this has resulted in a breach of the 50-day EMA. The move lower also marks an extension of the current bearish cycle and the print below the 50-day EMA suggests scope for a continuation lower near-term. The focus is on the next key support at $92.20, the Mar 15 low and an important bear trigger. Initial firm resistance has been defined at $105.59, Apr 5 high where a break would ease bearish pressure.
GOLD TECHS: Range Bound
- RES 4: $2104.6 - 3.236 proj of the Dec 15 - Jan 25 - 28 price swing
- RES 3: $2075.5 - High Aug 7 2020 and the all-time high
- RES 2: $2009.2/2070.4 - High Mar 10 / High Mar 8
- RES 1: $1966.1 - High Mar 24
- PRICE: $1931.1 @ 07:16 BST Apr 8
- SUP 1: $1890.2 - Low Mar 29 and a bear trigger
- SUP 2: $1878.4 - Low Feb 24
- SUP 3: $1848.8 - 76.4% retracement of the Jan 28 - Mar 8 rally
- SUP 4: $1821.1 - Low Feb 11
No change in Gold and the yellow metal remains range bound, trading above $1890.2, the Mar 29 low. The outlook is bearish following the recent pullback from $2070.4, the Mar 8 high. This has allowed a recent overbought condition to unwind. Key support at the 50-day EMA - today at $1909.8 - and the Mar 15 low of $1895.3 have recently been probed. A clear break lower would signal scope for a deeper pullback. Initial resistance is $1966.1.
SILVER TECHS: Bearish Focus
- RES 4: $27.831 - High Jun 16 2021
- RES 3: $27.245 - High Jun 17 2021
- RES 2: $26.063/943 - High Mar 10 / High Mar 8 and the bull trigger
- RES 1: $25.847 - High Mar 24
- PRICE: $24.622 @ 07:22 BST Apr 8
- SUP 1: $23.974 - Low Mar 29 and the bear trigger
- SUP 2: $23.850 - Low Feb 24
- SUP 3: $23.173 76.4% retracement of the Feb 3 - Mar 8 rally
- SUP 4: $23.082 - Low Feb 15
Silver resistance is unchanged at $25.847, the Mar 24 high. A short-term bearish theme remains intact and potential is seen for a deeper retracement. Price continues to challenge support at the 50-day EMA, at $24.521. This EMA marks an important support and a clear break would signal scope for a deeper pullback. For bulls, a move above $26.00 would alter the picture and refocus attention on $26.943, the Mar 8 high.
Why MNI
MNI is the leading provider
of intelligence and analysis on the Global Fixed Income, Foreign Exchange and Energy markets. We use an innovative combination of real-time analysis, deep fundamental research and journalism to provide unique and actionable insights for traders and investors. Our "All signal, no noise" approach drives an intelligence service that is succinct and timely, which is highly regarded by our time constrained client base.Our Head Office is in London with offices in Chicago, Washington and Beijing, as well as an on the ground presence in other major financial centres across the world.