
Why MNI
MNI is the leading provider
of intelligence and analysis on the Global Fixed Income, Foreign Exchange and Energy markets. We use an innovative combination of real-time analysis, deep fundamental research and journalism to provide unique and actionable insights for traders and investors. Our "All signal, no noise" approach drives an intelligence service that is succinct and timely, which is highly regarded by our time constrained client base.Our Head Office is in London with offices in Chicago, Washington and Beijing, as well as an on the ground presence in other major financial centres across the world.
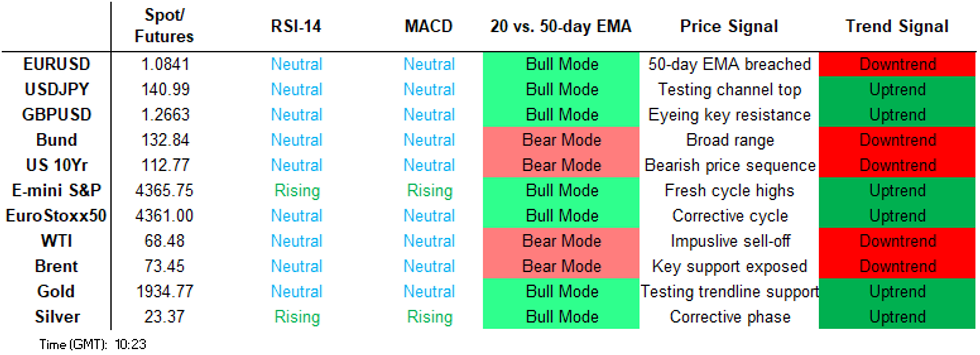
Price Signal Summary - S&P E-Minis Trend Needle Points North
- In the equity space, S&P E-Minis traded higher yesterday. The move confirms a resumption of the uptrend, marking an extension of the bull cycle that started in October 2022. The focus is on 4452.42,1.764 projection of the May 4 - 19 - 24 price swing. Firm support is at 4304.28, the 20-day EMA. Initial support is at 4348.75, the Jun 5 high. EUROSTOXX 50 futures traded higher Wednesday and are trading just off the recent highs. Resistance at 4362.00, the May 29 high has been cleared. This is a bullish development and signals scope for a move towards key resistance at 4409.50, the Nov 18 2021 high on the continuation chart. Clearance of this hurdle would represent an important bullish development. Initial support to watch is at 4285.30, the 50-day EMA.
- In FX, EURUSD traded above resistance at 1.0812 yesterday, the 50-day EMA. A clear break of the average would strengthen bullish conditions and open 1.0865 initially, 50.0% of the Apr 26 - May 31 downleg. Note that the current trend condition remains bearish and the latest bounce still appears to be a correction. A failure to clear the 50-day average would signal a top. Initial firm support is at 1.0733, the Jun 12 low. GBPUSD traded higher Wednesday, extending the current bull cycle to put prices at new multi-month highs. Price has pierced 1.2680, the May 10 high. A clear break of this level would strengthen bullish conditions - 1.2680 is a key medium-term resistance. This would open 1.2759, 61.8% of the Jun - Sep bear leg. Initial firm support is seen at the 20-day EMA, at 1.2499. USDJPY is trading higher today. The trend condition is bullish and attention remains on key resistance at the top of a bull channel drawn from the Jan 16 low, which intersects at 141.40 today. A clear break of this hurdle (today’s high is 141.50), would be bullish and open 141.61 next, the Nov 23 2022 high. Support to watch is at 139.04, the 20-day EMA.
- On the commodity front, the bear cycle in Gold remains intact. The yellow metal is trading below trendline support drawn from the Nov 3 2022 low - the trendline intersects at $1964.6. The break of this line marks a resumption of the downtrend. The focus is on $1903.5, 61.8% of the Feb 28 - May 4 bull cycle. Initial firm resistance is $1985.3, the May 24 high. In the oil space, WTI futures continue to trade below resistance at $75.06, Jun 5 high, and the outlook remains bearish. Support at $67.03, May 31 low, has been pierced, a clear break would open $63.90, May 4 low. Moving average studies are in a bear mode position highlighting a downtrend. A break of $75.06 is required to signal a reversal. Short-term gains are considered corrective.
- In the FI space, Bund futures maintain a softer tone and the contract continues to trade closer to its recent lows. Resistance at 134.95, the Jun 6 high, remains intact. A break of this level is required to expose key short-term resistance at 135.85, the Jun 1 high. Support at 132.97, the Jun 8 low., has been cleared and the break opens 132.12, the May 26 low and a bear trigger. Gilt futures remain bearish and Tuesday’s move lower reinforces current conditions. The contract has pierced support at 94.21, the May 26 low and bear trigger. A clear break of this level would confirm a resumption of the downtrend and open the 94.00 handle initially. Initial firm resistance is at 96.63, the Jun 9 high.
FOREIGN EXCHANGE
EURUSD TECHS: Watching Resistance At The 50-Day EMA
- RES 4: 1.0935 High May 12
- RES 3: 1.0919 61.8% retracement of the Apr 26 - May 31 downleg
- RES 2: 1.0905 High May 16
- RES 1: 1.0865 50.0% retracement of the Apr 26 - May 31 downleg
- PRICE: 1.0813 @ 05:27 BST Jun 15
- SUP 1: 1.0733 Low Jun 12
- SUP 2: 1.0667/35 Low Jun 6 / Low May 31 and the bear trigger
- SUP 3: 1.0608 Low Mar 17
- SUP 4: 1.0551 Low Mar 16
EURUSD traded above resistance at 1.0812 yesterday, the 50-day EMA. A clear break of the average would signal scope for an extension higher and open 1.0865 initially, a Fibonacci retracement. Note that the current trend condition remains bearish and the latest bounce still appears to be a correction. A failure to clear the 50-day average would signal a top. Initial firm support is at 1.0733, the Jun 12 low. Key support lies at 1.0635, May 31 low.
GBPUSD TECHS: Pierces Key Resistance
- RES 4: 1.2877 High Apr 25 2022
- RES 3: 1.2772 High Apr 26 2022
- RES 2: 1.2759 61.8% of the Jun - Sep bear leg
- RES 1: 1.2699 High Jun 14
- PRICE: 1.2640 @ 05:50 BST Jun 15
- SUP 1: 1.2601 Low Jun 14
- SUP 2: 1.2499/43 20- and 50-day EMA values
- SUP 3: 1.2369 Low Jun 5 and a key support
- SUP 4: 1.2308 Low May 25 and the bear trigger
GBPUSD traded higher Wednesday, extending the current bull cycle to put prices at new multi-month highs. Price has breached 1.2592, 76.4% of the May 10 - 25 downleg and pierced 1.2680, the May 10 high. A clear break of this level would strengthen bullish conditions - 1.2680 is a key medium-term resistance. This would open 1.2759, a Fibonacci retracement. Initial firm support is seen at the 20-day EMA, which intersects at 1.2499.
EURGBP TECHS: Downtrend Remains Intact
- RES 4: 0.8768 High May 5
- RES 3: 0.8719 High May 23
- RES 2: 0.8690 50-day EMA
- RES 1: 0.8623 20-day EMA
- PRICE: 0.8554 @ 06:14 BST Jun 15
- SUP 1: 0.8541 Low Jun 9 / 12 low
- SUP 2: 0.8522 Low Aug 30 2022
- SUP 3: 0.8500/8475 1.0% 10-dma env / 3.0% Lower Bollinger Band
- SUP 4: 0.8454 76.4% retracement of the Mar - Sep 2022 bull cycle
The primary trend direction in EURGBP is down and price is trading closer to recent lows. Initial resistance at 0.8623, the 20-day EMA. Moving average studies are in a bear-mode condition, highlighting a downtrend and recent fresh lows have reinforced bearish conditions. Clearance of 0.8541, the Jun 9 and 12 lows, would confirm a resumption of the trend and open 0.8522, the Aug 30 2022 low.
USDJPY TECHS: Approaching Bull Channel Resistance
- RES 4: 142.51 61.8% of the Oct 16 2022 - Jan 16 bear leg
- RES 3: 142.25 High Nov 21 2022
- RES 2: 141.61 High Nov 23 2022
- RES 1: 141.40/50 Bull channel top from Jan 16 low / Intraday high
- PRICE: 141.19 @ 09:44 BST Jun 14
- SUP 1: 139.04/138.45 20-day EMA / Low Jun 1
- SUP 2: 137.43 Low May 19
- SUP 3: 137.24 50-day EMA
- SUP 4: 136.31 Low May 17
USDJPY is trading higher today. The trend condition is bullish and attention remains on key resistance at the top of a bull channel drawn from the Jan 16 low, which intersects at 141.40 today. A clear break of this hurdle would be bullish and open 141.61 next, the Nov 23 2022 high. For bears, a strong reversal lower would instead highlight a potential top. Support to watch is at 139.04, the 20-day EMA.
EURJPY TECHS: Cracks Resistance
- RES 4: 155.00 Round number resistance
- RES 3: 154.62 1.764 proj of the Mar 20 - 21 - Apr 6 price swing
- RES 2: 153.62 1.618 proj of the Mar 20 - 21 - Apr 6 price swing
- RES 1: 153.07 Intraday high
- PRICE: 152.98 @ 09:42 BST Jun 15
- SUP 1: 150.92 Low Jun 14
- SUP 2: 149.84 20-day EMA
- SUP 3: 148.36 50-day EMA
- SUP 4: 147.61 Low May 16
EURJPY is trading sharply higher as this week’s bull run extends. The cross has cleared key resistance at 151.61, the May 2 high and an important bull trigger. This confirms a resumption of the longer-term uptrend. The focus is on 153.00 handle and 153.62, a Fibonacci projection. On the downside, initial firm support is seen at 149.84, the Jun 14 low. A break would signal a short-term top.
AUDUSD TECHS: Clears Key Resistance
- RES 4: 0.6921 High Feb 20
- RES 3: 0.6891 61.8% Feb - Jun Downleg
- RES 2: 0.6865 High Feb 22
- RES 1: 0.6836 High Jun 13
- PRICE: 0.6799 @ 08:06 BST Jun 15
- SUP 1: 0.6727 Low Jun 12
- SUP 2: 0.6670 20-day EMA
- SUP 3: 0.6610 Low Jun 6
- SUP 4: 0.6567/6458 Low May 31 and the bear trigger
The AUDUSD bull cycle from May 31 remains in play and the pair traded to a fresh high Wednesday. Price has now printed a higher low for ten consecutive sessions, a streak not seen since late 2017, where the streak extended to 16 trading days and spanned a ~5% rally. Yesterday’s rally put prices north of 0.6818, the May 10 high and a key resistance. A clear break would open 0.6865 and above. Initial firm support is seen at 0.6670, the 20-day EMA.
USDCAD TECHS: Pierces Key Support
- RES 4: 1.3668 High Apr 28 and a key resistance
- RES 3: 1.3585 High Jun 1
- RES 2: 1.3480 50-day EMA
- RES 1: 1.3432 20-day EMA
- PRICE: 1.3347 @ 08:11 BST Jun 15
- SUP 1: 1.3275 Low Jun 14 & Feb 14
- SUP 2: 1.3264 2.0% Lower Bollinger Band
- SUP 3: 1.3246 1.0% 10-dma envelope
- SUP 4: 1.3112 2.0% 10-dma envelope
USDCAD printed a lower low Wednesday piercing support at the mid-April lows of 1.3302. This reinforces bearish conditions and a continuation lower would open a vol band support undercutting at 1.3246. Clearance here would further strengthen bearish conditions. On the upside, initial firm resistance is at 1.3443, the 20-day EMA. A break of this level is required to ease bearish pressure.
FIXED INCOME
BUND TECHS: (U3) Pieces Key Short-Term Support
- RES 4: 136.50 High May 11
- RES 3: 135.85 High Jun 1 and key short-term resistance
- RES 2: 134.77/95 / High Jun 12 / 6
- RES 1: 134.02 20-day EMA
- PRICE: 132.89 @ 09:33 BST Jun 15
- SUP 1: 132.72 Intraday low
- SUP 2: 132.33 Low May 29
- SUP 3: 132.12 Low May 26 and key support
- SUP 4: 131.89 1.00 projection of the Jun 1 - 8 - 12 price swing
Bund futures maintain a softer tone and the contract continues to trade closer to its recent lows. Resistance at 134.95, the Jun 6 high, remains intact. A break of this level is required to expose key short-term resistance at 135.85, the Jun 1 high. Support at 132.97, the Jun 8 low., has been cleared and the break opens 132.12, the May 26 low and a bear trigger. Clearance of this level would strengthen bearish conditions.
BOBL TECHS: (U3) Bearish Price Action
- RES 4: 117.700 High Jun 1 and key short-term resistance
- RES 3: 117.200 High Jun 6
- RES 2: 116.990/117.010 High Jun 12 / 7
- RES 1: 116.390 High Jun 14
- PRICE: 115.810 @ 09:34 BST Jun 15
- SUP 1: 115.770 Intraday low
- SUP 2: 115.540 1.00 projection of the Jun 1 - 8 - 12 price swing
- SUP 3: 115.198 1.236 projection of the Jun 1 - 8 - 12 price swing
- SUP 4: 114.986 1.382 projection of the Jun 1 - 8 - 12 price swing
Bobl futures maintain a softer tone and this week’s continuation lower reinforces bearish conditions. Price has moved through support at 116.250, the Jun 8 low and has pierced key support at 115.870, the May 26 low. Clearance of this level would strengthen bearish conditions. On the upside, resistance to watch is 116.990, the Jun 12 high. A break would ease bearish pressure.
SCHATZ TECHS: (U3) Southbound
- RES 4: 105.975 High May 17
- RES 3: 105.875 High Jun 1 and key short-term resistance
- RES 2: 105.655/815 High Jun 6 / 4
- RES 1: 105.325/550 High Jun 14 / 12 and key near-term resistance
- PRICE: 105.120 @ 09:35 BST Jun 15
- SUP 1: 105.085 Intraday low
- SUP 2: 105.000 Round number support
- SUP 3: 104.960 Low Mar 13 (cont)
- SUP 4: 104.883 1.236 projection of the Jun 1 - 8 - 12 price swing
Schatz futures traded lower yesterday. This week’s price action has resulted in a break of 105.330, the May 26 low and bear trigger. The move confirms a resumption of the downtrend and maintains the current bearish price sequence of lower lows and lower highs. Sights are on the 105.000 handle next. Note that moving average studies remain in a bear mode condition, highlighting a downtrend. Initial firm resistance is at 105.550, the Jun 12 high.
GILT TECHS: (U3) Key Support Remains Exposed
- RES 4: 97.64 High Jun 1 and the reversal trigger
- RES 3: 96.63/97.06 High Jun 9 / 6
- RES 2: 96.31 High Jun 12
- RES 1: 95.18 High Jun 13
- PRICE: 94.68 @ Close Jun 14
- SUP 1: 94.21/19 May 26 and the bear trigger / Low Jun 13
- SUP 2: 94.00 Round number support
- SUP 3: 93.45 1.618 proj of the Feb 2 - 28 - Mar 20 price swing (cont)
- SUP 4: 92.19 1.764 proj of the Feb 2 - 28 - Mar 20 price swing (cont)
Gilt futures remain bearish and Tuesday’s move lower reinforces current conditions. The contract has pierced support at 94.21, the May 26 low and bear trigger. A clear break of this level would confirm a resumption of the downtrend and open the 94.00 handle initially. Moving average studies are in a bear mode position reflecting current sentiment. Initial firm resistance is at 96.63, the Jun 9 high.
BTP TECHS: (U3) Remains Above Support
- RES 4: 118.41 1.00 projection of May 26 - Jun 2 - Jun 8 price swing
- RES 3: 118.18 High Feb 2 (cont)
- RES 2: 117.33 0.764 projection of May 26 - Jun 2 - Jun 8 price swing
- RES 1: 117.08 High Jun 13
- PRICE: 115.91 @ Close Jun 14
- SUP 1: 114.97 Low Jun 9
- SUP 2: 113.83 Low Jun 8 and key short-term support
- SUP 3: 112.48 Low May 29
- SUP 4: 111.78 Low May 26 and a key support
BTP futures traded to a fresh cycle high earlier this week. The contract has cleared resistance at 116.36, the Jun 2 high and a short-term bull trigger. This cancels a recent bearish threat and instead confirms a resumption of the uptrend and signals scope for a climb towards 117.33, a Fibonacci projection. On the downside, key short-term support has been defined at 113.83, the Jun 8 low. A break would be bearish.
EQUITIES
EUROSTOXX50 TECHS: (M3) Key Resistance Exposed
- RES 4: 4457.50 0.5 proj of the Mar 20 - Apr 21 - May 4 price swing
- RES 3: 4448.00 High Jan 2008 (cont)
- RES 2: 4409.50 High Nov 18 2021 (cont) and a major resistance
- RES 1: 4389.00 High Jun 14
- PRICE: 4372.00 @ 05:46 BST Jun 15
- SUP 1: 4314.80/4285.30 20- and 50-day EMA values
- SUP 2: 4216.00 Low May 31 and the bear trigger
- SUP 3: 4200.00 Round number support
- SUP 4: 4175.00 Low Mar 30
Eurostoxx 50 futures traded higher Wednesday and are trading just off the recent highs. Resistance at 4362.00, the May 29 high has been cleared. This is a bullish development and signals scope for an extension higher towards key resistance at 4409.50, the Nov 18 2021 high on the continuation chart. Clearance of this hurdle would represent an important bullish development. Initial support to watch is at 4285.30, the 50-day EMA.
E-MINI S&P TECHS: (U3) Trend Needle Points North
- RES 4: 4492.25 2.00 projection of the May 4 - 19 - 24 price swing
- RES 3: 4485.18 Channel top from the Oct ‘22 low (cont)
- RES 2: 4452.42 1.764 projection of the May 4 - 19 - 24 price swing
- RES 1: 4439.50 High Jun 14
- PRICE: 4420.25 @ 06:34 BST Jun 15
- SUP 1: 4348.75/4304.28 High Jun 5 / 20-day EMA
- SUP 2: 4232.58 50-day EMA
- SUP 3: 4154.75 Low May 24
- SUP 4: 4098.25 Low May 4 and a key support
S&P E-minis traded higher again Wednesday. The move confirms a resumption of the uptrend and maintains the bullish price sequence of higher highs and higher lows, marking an extension of the bull cycle that started in October 2022. The focus is on a climb towards 4452.42, a Fibonacci projection. Firm support is at 4304.28, the 20-day EMA. Initial support is at 4348.75, the Jun 5 high.
COMMODITIES
BRENT TECHS: (Q3) Bear Threat Remains Present
- RES 4: $84.56 - High Apr 18
- RES 3: $82.47 - High Apr 25
- RES 2: $80.08 - High Apr 28
- RES 1: $75.49/78.73 - High Jun 14 / High Jun 5 and a bull trigger
- PRICE: $73.51 @ 06:58 BST Jun 15
- SUP 1: $71.50 - Low May 31
- SUP 2: $71.20 - Low May 4
- SUP 3: $70.06 - Low Mar 20 and a key support
- SUP 4: $69.28 - Low Dec 20 2021 (cont)
A bear threat in Brent futures remains present and the contract continues to trade below $78.73, the Jun 5 high. Monday’s sell-off reinforces current conditions and scope is seen for a move towards $71.20, the May 4 low, ahead of $70.06, the Mar 20 low. Moving average studies remain in a bear mode position and this highlights a downtrend. On the upside, clearance of $78.73 would alter the picture. Short-term gains are considered corrective.
WTI TECHS: (N3) Trend Needle Points South
- RES 4: $80.93 - High Apr 19
- RES 3: $79.00 - High Apr 24
- RES 2: $76.74 - High Apr 28
- RES 1: $70.85/75.06 - 20-day EMA / High Jun 5 and a key resistance
- PRICE: $68.59 @ 07:01 BST Jun 15
- SUP 1: $66.80 - Low Jun 12
- SUP 2: $63.90 - Low May 4 and key support
- SUP 3: $62.43 - Low Dec 2 2021 (cont)
- SUP 4: $60.00 - Psychological round number
WTI futures continue to trade below resistance at $75.06, Jun 5 high, and the outlook remains bearish The pullback from this level reinforces a bearish theme. Support at $67.03, May 31 low, has been pierced, a clear break would open $63.90, May 4 low. Moving average studies are in a bear mode position highlighting a downtrend. A break of $75.06 is required to signal a reversal. Short-term gains are considered corrective.
GOLD TECHS: Has Breached Trendline Support
- RES 4: $2070.4 - High Mar 8 and a bull trigger
- RES 3: $2063.0 - High May 4
- RES 2: $2022.6 - High May 12
- RES 1: $1985.3 - High May 24 and key short-term resistance
- PRICE: $1932.1 @ 09:55 BST Jun 15
- SUP 1: $1929.0 - Intraday low
- SUP 2: $1903.5 - 61.8% retracement of the Feb 28 - May 4 bull cycle
- SUP 3: $1885.8 - Low Mar 15
- SUP 4: $1865.8 - 76.4% retracement of the Feb 28 - May 4 bull cycle
The bear cycle in Gold remains intact. The yellow metal is trading below trendline support drawn from the Nov 3 2022 low - the trendline intersects at $1964.6. The break of this line reinforces bearish conditions and marks a resumption of the downtrend. The focus is on $1903.5, 61.8% of the Feb 28 - May 4 bull cycle. Initial firm resistance is $1985.3, the May 24 high. Clearance of this resistance would signal a short-term reversal instead.
SILVER TECHS: Resistance At The Double Top Midpoint Remains Intact
- RES 4: $26.771 - High Mar 9 2022
- RES 3: $26.222 - High Apr 18 2022 and a key resistance
- RES 2: $25.477/26.135 - High May 11 / 5 and bull trigger
- RES 1: $24.492/530 - Low Apr 25 and double midpoint / High Jun 12
- PRICE: $23.426 @ 07:59 BST Jun 15
- SUP 1: $22.682 - Low May 26 and bear trigger
- SUP 2: $22.284 - 61.8% retracement of the Mar 10 - May 5 rally
- SUP 3: $22.157 - Low Mar 21
- SUP 4: $21.375 - 76.4% retracement of the Mar 10 - May 5 rally
Silver has pulled back from its recent high of $24.5300 on Jun 12. This means that resistance at $24.492 remains intact - the midpoint of a double top reversal pattern confirmed on May 11. The move lower also signals the end of the recent May 26 - Jun 9 corrective rally. The trend outlook is bearish and the focus is on a move towards key support and the bear trigger at $22.682, the May 26 low.
Why MNI
MNI is the leading provider
of intelligence and analysis on the Global Fixed Income, Foreign Exchange and Energy markets. We use an innovative combination of real-time analysis, deep fundamental research and journalism to provide unique and actionable insights for traders and investors. Our "All signal, no noise" approach drives an intelligence service that is succinct and timely, which is highly regarded by our time constrained client base.Our Head Office is in London with offices in Chicago, Washington and Beijing, as well as an on the ground presence in other major financial centres across the world.