
Why MNI
MNI is the leading provider
of intelligence and analysis on the Global Fixed Income, Foreign Exchange and Energy markets. We use an innovative combination of real-time analysis, deep fundamental research and journalism to provide unique and actionable insights for traders and investors. Our "All signal, no noise" approach drives an intelligence service that is succinct and timely, which is highly regarded by our time constrained client base.Our Head Office is in London with offices in Chicago, Washington and Beijing, as well as an on the ground presence in other major financial centres across the world.
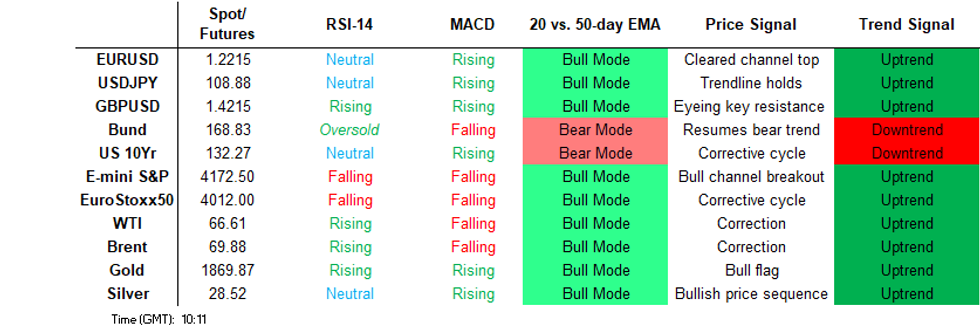
Price Signal Summary - USD Under Pressure And Stocks Remain Firm
- In the equity space, the trend outlook remains bullish. S&P E-minis are holding onto recent gains. A key support has been defined at 4029.25, May 13 low. A break of this level would risk a deeper pullback. While it holds, the trend remains up.
- In the FX space, EURUSD has rallied today and cleared former resistance at 1.2182, May 11 high. With price trading above 1.2200, the focus turns to key resistance at 1.2243, Feb 25 high. GBPUSD is bullish following last week's gains. Attention is on 1.4237, Feb 24 high and this year's high. USDJPY support has been defined at 108.34, May 7 low. A bullish theme remains intact while it holds and attention is on 109.79, May 13 high. A break of support would highlight a trendline break drawn off the Jan 6 low and risk a deeper pullback. USDCAD is back below 1.2062, Sep 2017 low. Attention turns to the psychological 1.2000 handle.
- On the commodity front, Gold remains bullish. The focus is on $1875.7, Jan 29 high. Oil is stronger. The Brent (N1) focus is on the psychological $70.00 level that has been probed today. A clear break would open and $71.75, Jan 8 2020 high (cont). WTI bulls are eyeing the key resistance at $67.29, Mar 8 high. Key near-term support is at $63.09, May 3 low.
- In the FI space, Bunds (M1) remain vulnerable and the risk is for a revisit of the 2020 lows at 167.52. A break of 168.59, May 13 low would trigger a resumption of the downtrend. Near-term risk in Gilts (M1) is still skewed to the downside. The key support and bear trigger is 126.79, Mar 18 low. BTPs (M1) remain in a clear downtrend. The focus is on 144.16, 1.236 projection of the Feb 12 - 26 - Mar 11 price swing.
FOREIGN EXCHANGE
EURUSD TECHS: Resumes Its Upleg
- RES 4: 1.2414 High Apr 17, 2018
- RES 3: 1.2353 High Apr 20, 2018
- RES 2: 1.2285 High Jan 8
- RES 1: 1.2243 High Feb 25 and a key resistance
- PRICE: 1.2211 @ 09:26 BST May 18
- SUP 1: 1.2126 Low May 17
- SUP 2: 1.2052 Low May 13 and key short-term support
- SUP 3: 1.2025 50-day EMA
- SUP 4: 1.1986 Low May 5 and key short-term support
EURUSD outlook remains bullish following the recovery last week from 1.2052, May 13 low. The pair has rallied today and cleared former resistance at 1.2182, May 11 high. With price trading above 1.2200, the focus turns to key resistance at 1.2243, Feb 25 high and a bull trigger. A break would open 1.2285, Jan 8 high. On the downside, key short-term support has been defined at 1.2052, May 13 low.
GBPUSD TECHS: Price Structure Remains Bullish
- RES 4: 1.4315 High Apr 18, 2018
- RES 3: 1.4307 2.0% 10-dma envelope
- RES 2: 1.4237 High Feb 24 and a key resistance
- RES 1: 1.4207 Intraday high
- PRICE: 1.4171 @ 9:34 BST May 18
- SUP 1: 1.4006/3972 Low May 13 / Low May 10
- SUP 2: 1.3890 50-day EMA
- SUP 3: 1.3801 Low May 3 and a key support
- SUP 4: 1.3778 Bull channel base drawn off the May 2020 low
GBPUSD outlook remains bullish and the pair is trading higher. The rate has recently cleared a number of resistance levels, reinforcing a positive theme and sights are set on the key resistance at 1.4237, Feb 24 high. A break of 1.4237 would strengthen a bullish case and confirm a resumption of the broader uptrend that started in March 2020. On the downside, initial firm support is at 1.4006, May 13 low.
EURGBP TECHS: Bearish Risk Remains Present
- RES 4: 0.8791/8797 High Feb 12 / 2.0% 10-dma envelope
- RES 3: 0.8731 High Feb 26
- RES 2: 0.8701/21 High May 7 / High Apr 26 and the bull Trigger
- RES 1: 0.8652 50-day EMA
- PRICE: 0.8584 @ 06:20 BST May 18
- SUP 1: 0.8561 Low May 12
- SUP 2: 0.8472 Low Apr 5 and the bear trigger
- SUP 3: 0.8452 2.0% 10-dma envelope
- SUP 4: 0.8430 Low Feb 27, 2020
EURGBP remains bearish following new weekly lows last week on May 12 of 0.8561. The move lower has seen the cross move out of its recent range and confirm a bearish breakout. This suggests scope for a deeper pullback, potentially towards the key support at 0.8472, Apr 5 low. On the upside, the key resistance and bull trigger is unchanged at 0.8721, Apr 26 high. Initial resistance is at 0.8652, the 50-day EMA.
USDJPY TECHS: Corrective Pullback
- RES 4: 110.97 High Mar 31 and the bull trigger
- RES 3: 110.55 High Apr 6
- RES 2: 109.96 High Apr 9
- RES 1: 109.79 High May 13
- PRICE: 109.19 @ 06:23 BST May 18
- SUP 1: 108.34 Low May 7 and key short-term support
- SUP 2: 107.48 Low Apr 23 and the bear trigger
- SUP 3: 106.97 Low Mar 4
- SUP 4: 106.78 50.0% retracement of the Jan - Mar rally
USDJPY maintains a bullish outlook and the recent pullback is considered corrective. The pair rallied last week from what is now a firm support at 108.34, May 7 low. This maintains the focus on 109.96, Apr 9 high with potential for a climb above 110.00 too. Note that the recovery last week also means trendline support drawn off the Jan 6 low remains intact. A break of 108.34 would threaten the uptrend and also signal a break of the trendline.
EURJPY TECHS: Still Bullish Within Its Channel
- RES 4: 133.93 Bull channel top drawn off the Oct 30, 2020 low
- RES 3: 133.28 1.50 proj of Jun-Sep-Oct 2020 swing
- RES 2: 133.13 High Sep 21, 2018 and a key resistance
- RES 1: 133.04 Intraday high
- PRICE: 133.02 @ 09:36 BST May 18
- SUP 1: 131.69 Low May 12
- SUP 2: 130.99 Low May 5 and a key support
- SUP 3: 130.57 Low Apr 27
- SUP 4: 130.42 Bull channel base drawn off the Oct 30, 2020 low
EURJPY traded higher Monday to a new cycle high of 132.95 and gains have resumed today. This reinforces bullish conditions and signals scope for further gains within the bull channel drawn off the Oct 30 2020 low. The top of the channel intersects at 133.87. Moving average studies are still pointing north, also reinforcing current conditions. Initial firm support lies at 131.69, May 12 low. A firmer trend support is found at 130.99, May 5 low.
AUDUSD TECHS: Retracing Recent Losses
- RES 4: 0.8007 High Feb 25 and the bull trigger
- RES 3: 0.7930 2.0% 10-dma envelope
- RES 2: 0.7891/95 High May 10 / 76.4% of the Feb 25 - Apr 1 sell-off
- RES 1: 0.7846 High May 12
- PRICE: 0.7789 @ 06:33 BST May 18
- SUP 1: 0.7688 Low May 13
- SUP 2: 0.7675 Low May 4 and key support
- SUP 3: 0.7635 Low Apr 14
- SUP 4: 0.7586 Low Apr 13
AUDUSD traded to a low of 0.7688 last week on May 13, denting the recent bullish outlook further. A firm support zone has been defined at 0.7688-75, the latter is the May 4 low. Clearance of this zone would strengthen a bearish case and signal scope for a deeper pullback towards 0.7586, the Apr 13 low. Initial firm resistance is at 0.7846, May 12 high ahead of the key resistance at 0.7891, May 10 high.
USDCAD TECHS: Heading South
- RES 4: 1.2491 High Apr 26
- RES 3: 1.2419 High Apr 27
- RES 2: 1.2351 High May 4 and a key near-term resistance
- RES 1: 1.2203/2288 High May 13 / High May 6
- PRICE: 1.2017 @ 09:37 BST May 18
- SUP 1: 1.2013 Intraday low
- SUP 2: 1.2000 Psychological round number
- SUP 3: 1.1920 Low May 2015
- SUP 4: 1.1910 2.0% 10-dma envelope
USDCAD needle still points south. The recent and current key technical development has been the test of the major support at 1.2062, Sep 2017 low. This represents an important pivot chart point that either represents the base of a broad range or the midpoint of a double top reversal pattern. A clear break lower would reinforce the current downtrend and open 1.2000 and below. Initial firm resistance is at 1.2203, May 13 high.
FIXED INCOME
BUND TECHS: (M1) Downtrend Remains Intact
- RES 4: 171.62 High Apr 14
- RES 3: 171.27 High Apr 22
- RES 2: 170.98 High May 7 and key short-term resistance
- RES 1: 170.01 20-day EMA
- PRICE: 168.78 @ 05:05 BST May 18
- SUP 1: 168.59 Low May 13
- SUP 2: 168.09 0.764 proj of the Jan 27 - Feb 25 - Mar 25 price swing
- SUP 3: 168.06 1.0% 10-dma envelope
- SUP 4: 167.52 Low Mar 19, 2020 (cont)
Bund futures remain in a downtrend and short-term gains are considered corrective. Last week's sell-off resulted in a breach of support at 169.47, May 3 low and 169.24, Feb 24 low, opening further losses below 169.00. A volatility band support lies at 168.06 with a Fibonacci projection just above at 168.09. These levels represent objectives and potential support. A key short-term resistance has been defined at 170.98, Apr 7 high.
BOBL TECHS: (M1) Needle Still Points South
- RES 4: 135.050 High Apr 22
- RES 3: 135.040 High May 6 and key short-term resistance
- RES 2: 134.870 High May 10
- RES 1: 134.719 20-day EMA
- PRICE: 134.360 @ 04:47 BST May 18
- SUP 1: 134.290 Low May 17
- SUP 2: 134.140 Low Feb 26 and key support
- SUP 3: 134.000 Round number support
- SUP 4: 133.340 Low Mar 19, 2020 (cont)
Bobl futures touched a new cycle low of 134.190 yesterday. This reinforces the bearish cycle that started Mar 25. The break lower and resumption of weakness also signals scope for a move towards end-Feb lows next, with support layered between 134.00-134.14. Clearance of this zone would signal scope for weakness toward the 2020 lows. Key resistance is at 135.040, May 6 high. Initial resistance is at 134.719.
SCHATZ TECHS: (M1) Consolidating But Remains Bearish
- RES 4: 112.165 High Mar 25 and the bull trigger
- RES 3: 112.150 High Apr 8
- RES 2: 112.110/120 High May 4, 5, and 6 / High Apr 22
- RES 1: 112.068 20-day EMA
- PRICE: 112.015 @ 05:18 BST May 18
- SUP 1: 112.005 Low May 13
- SUP 2: 112.000 Round number support
- SUP 3: 111.993 76.4% retracement of the Feb 26 - Mar 25 rally
- SUP 4: 111.940 Low Feb 26 ad key support
Schatz futures are consolidating but maintain a bearish tone following last week's sell-off and resumption of the bearish cycle that started Mar 25. Recent weakness has resulted in a break of 112.060, a level that provided support in March and April. The clear break strengthens a bearish case and paves the way for weakness below 112.00 and towards 111.940, Feb 26 low. On the upside, a breach of 112.110 is required to signal a reversal.
GILT TECHS: (M1) Key Support Remains Exposed
- RES 4: 129.75 High Feb 19
- RES 3: 129.09/27 High Apr 23 and the reversal trigger / High Mar 2
- RES 2: 128.80 High May 7 and key short-term resistance
- RES 1: 128.08 High MAy 11
- PRICE: 127.42 @ Close May 17
- SUP 1: 126.86 Low May 13
- SUP 2: 126.79 Low Mar 18 and the bear trigger
- SUP 3: 126.55 Low Apr 17, 2019 (cont)
- SUP 4: 126.53 1.0% 10-dma Envelope
The Gilt futures technical outlook remains bearish. The pullback from 128.80, May 7 high and last week's follow through reinforce bearish conditions. The move lower resulted in a break of support between 127.40 and 127.32, the Apr 29 and Apr 1 lows respectively. This exposes the major support at 126.79, Mar 18 low and the bear trigger. A break of 126.79 would confirm a resumption of the broader downtrend. Initial firm resistance is 128.80.
BTP TECHS: (M1) Bearish Extension
- RES 4: 147.79 High May 4 and key near-term resistance
- RES 3: 147.33 High May 7
- RES 2: 146.84 Low Feb 26 and recent breakout level
- RES 1: 145.96 High May 13
- PRICE: 144 99 @ Close May 17
- SUP 1: 144.66 Low May 17
- SUP 2: 144.16 1.236 proj of the Feb 12 - 26 - Mar 11 price swing
- SUP 3: 144.00 Round number support
- SUP 4: 143.46 2.0% 10-dma envelope
BTP futures remain in a clear downtrend following last week's extension lower. The contract started this week on a soft note trading once again to a fresh 2021 low of 144.66. The recent break of support at 146.84, Feb 26 low confirmed a resumption of the broader bear cycle that started Feb 12. Furthermore, MA studies are in a bear mode reinforcing current conditions. Attention is on 144.16, a Fibonacci projection. Initial firm resistance is 146.84.
EQUITIES
EUROSTOXX 50 TECHS: (M1) Eyeing Key Resistance
- RES 4: 4175.00 Low Nov 26, 2007 (cont)
- RES 3: 4140.00 High Jan 18, 2008 (cont)
- RES 2: 4099.00 1.00 proj of of the Mar - Jul - Oct 2020 price swing
- RES 1: 4036.00 High May 10 and the bull trigger
- PRICE: 4027.00 @ 05:45 BST May 18
- SUP 1: 3953.92 20-day EMA
- SUP 2: 3844.00 Low May 13 and the bear trigger
- SUP 3: 3821.00 High Mar 18 and recent breakout level
- SUP 4: 3727.00 Low Mar 25
EUROSTOXX 50 futures remain bullish. The contract staged a solid recovery last week and has defined a key support at 3844.00, May 13 low. A test of the 50-day EMA last week failed to result in a clear break of the average. The EMA represents a key trend support reference and intersects at 3875.11. Attention is on 4036.00, May 10 high where a break would confirm a resumption of the uptrend. Sub 3844.00 levels are required to signal a top.
E-MINI S&P (M1): Holding Onto Gains
- RES 4: 4280.65 3.0% 10-dma envelope
- RES 3: 4239.26 1.764 proj of the Feb 1 - Feb 16 - Mar 4 price swing
- RES 2: 4238.25 High May 10 and the bull trigger
- RES 1: 4185.50 High May 12
- PRICE: 4171.25 @ 06:43 BST May 18
- SUP 1: 4105.25 Low May 14
- SUP 2: 4029.25 Low May 13 and key short-term support
- SUP 3: 4021.00 Low Apr 5
- SUP 4: 3937.12 100-dma
S&P E-minis are holding onto recent gains and remain above last week's low of 4029.25. This level represents a key S/T support where a break is required to signal scope for a deeper pullback. The strong recovery from last week's low also highlights the importance of the 50-day EMA as a trend support - price traded below the average but failed to confirm a clear break. Attention is on this year's high and the bull trigger of 4238.25.
COMMODITIES
BRENT TECHS: (N1) Probes $70.00
- RES 4: $71.95 - High Sep 16, 2019 (cont)
- RES 3: $71.75 - High Jan 8 2020 (cont)
- RES 2: $71.41 - Bull channel top drawn off the Apr 5 low
- RES 1: $70.24 - Intraday high
- PRICE: $70.03 @ 09:39 BST May 18
- SUP 1: $68.18 - Low May 17
- SUP 2: $66.48 - Low May 13 and key near-term support
- SUP 3: $66.10 - Low May 3
- SUP 4: $65.32 - 50-day EMA
Brent crude remains bullish. Price on May 5, probed key resistance at $69.73, Mar 8 high and today the contract has signalled a clearer breach with $70.00 probed too. A move higher would confirm a resumption of the broader uptrend and extend the bullish price sequence of higher highs and higher lows. This would open $71.75, the Jan 8, 2020 high (cont). On the downside, initial firm trend support has been defined at $66.48, May 13 low.
WTI TECHS: (M1) Trading Higher
- RES 4: $70.00 - Psychological round number
- RES 3: $67.95 - High Oct 29, 2018
- RES 2: $67.29 - High Mar 8 and the bull trigger
- RES 1: $67.01 - Intraday high
- PRICE: $66.75 @ 09:46 BST May 18
- SUP 1: $64.28 - 20-day EMA
- SUP 2: $63.09 - Low May 13 and key near-term support
- SUP 3: $62.31 - 50-day EMA
- SUP 4: $60.61 - Low Apr 22 and key short-term support
WTI maintains a bullish tone and the contract is trading higher. Price action has probed resistance at $66.76, May 5 high. A clear break would pave the way for a test of the key hurdle for bulls at $67.29, Mar 8 high. Clearance of this latter resistance would confirm a resumption of the broader uptrend. On the downside, firm near-term support has been defined at $63.09, May 13 low. A break would be bearish.
GOLD TECHS: Bullish Extension
- RES 4: $1927.7 - High Jan 7
- RES 3: $1917.6 - High Jan 8
- RES 2: $1892.7 - 76.4% retracement of the Jan 6 - Mar 8 sell-off
- RES 1: $1875.7 - High Jan 29
- PRICE: $1870.9 @ 07:01 BST May 18
- SUP 1: $1841.3 - Low May 17
- SUP 2: $1808.9 - Low May 13
- SUP 3: $1785.7 - 50-day EMA
- SUP 4: $1764.3 - Low Apr 30
Gold has traded higher again overnight and importantly, confirmed once again a resumption of the underlying uptrend as the bullish price sequence of higher highs and higher lows extends. Price action has cleared $1851.5, a Fibonacci retracement signalling scope for a climb towards 1875.7 next, the Jan 29 high. On the downside, key short-term support has been defined at $1808.9, May 13 low. A break would be bearish.
SILVER TECHS: Rally Extends
- RES 4: $30.100 - High Feb 1 and key resistance
- RES 3: $30.000 - Round number resistance
- RES 2: $29.053 - High Feb 2
- RES 1: $28.753 - Intraday high
- PRICE: $28.528 @ 07:19 BST May 18
- SUP 1: $27.351 - Low May 17
- SUP 2: $26.721 - Low Mar 13 and key near-term support
- SUP 3: $26.325 - 50-day EMA
- SUP 4: $25.718 - Low Apr 29
Silver remains bullish and continues to climb following the recovery from $26.721, May 13 low. This level represents an important short-term support where a break is required to signal scope for a deeper pullback. While it holds, the outlook remains bullish. The metal has probed $28.609, a Fibonacci retracement paving the way for $29.00 and above. Further out, the Feb 1 high of $30.100 beckons.
Why MNI
MNI is the leading provider
of intelligence and analysis on the Global Fixed Income, Foreign Exchange and Energy markets. We use an innovative combination of real-time analysis, deep fundamental research and journalism to provide unique and actionable insights for traders and investors. Our "All signal, no noise" approach drives an intelligence service that is succinct and timely, which is highly regarded by our time constrained client base.Our Head Office is in London with offices in Chicago, Washington and Beijing, as well as an on the ground presence in other major financial centres across the world.