
Why MNI
MNI is the leading provider
of intelligence and analysis on the Global Fixed Income, Foreign Exchange and Energy markets. We use an innovative combination of real-time analysis, deep fundamental research and journalism to provide unique and actionable insights for traders and investors. Our "All signal, no noise" approach drives an intelligence service that is succinct and timely, which is highly regarded by our time constrained client base.Our Head Office is in London with offices in Chicago, Washington and Beijing, as well as an on the ground presence in other major financial centres across the world.
FOREX: Asia Starts The Week On Cautious Note, GBP Rises On Brexit Talks Optimism
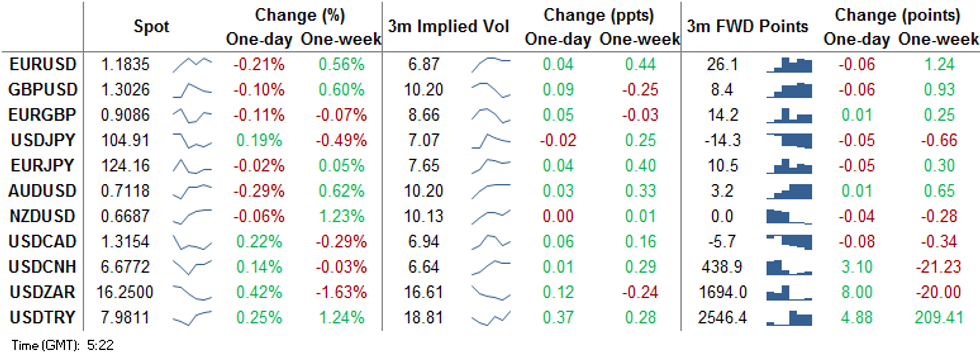
The combination of Covid-19 situation and U.S. fiscal saga resulted in broader risk aversion, providing tailwinds to safe haven currencies and pushing USD to the top of the G10 scoreboard. Continued rapid spread of infections in Europe entailed further restrictions across the continent, while the U.S. reported a record daily surge in new cases. Meanwhile, U.S. House Speaker Pelosi and White House Chief of Staff Meadows exchanged accusations of "moving the goalposts" during their fiscal negotiations. Commodity-tied FX generally struggled to regain poise, albeit NZD managed to recover with liquidity thinned by a market holiday in New Zealand.
- AUD failed to draw much support from the news that Australian Coca-Cola Amatil agreed to a A$9.3bn takeover offer from Coca-Cola European Partners.
- GBP picked up a bid after EU Chief Negotiator Barnier extended his stay in London through Wednesday to continue Brexit talks with the UK. The current phase of negotiations had been scheduled to wrap up on Sunday and resume in Brussels on Thursday.
- USD/CNH crept higher in sync with the greenback's appreciation, ignoring weekend comments from Chinese officials, who underscored willingness to facilitate the process of economic opening-up, while boosting China's capacity to manage associated risks. Elsewhere, CPC leaders convened to discuss the country's next five-year economic plan.
- USD/KRW defied broader risk-off feel and dipped to its worst levels since Mar 2019 ahead of tomorrow's release of South Korea's flash Q3 GDP data. Speculation about a potential hike in Samsung dividends drew some attention locally, with some analysts suggesting that the conglomerate might want to help children of the late chairman Lee Kun-hee pay the inheritance tax, estimated at KRW10.9tn.
- Hong Kong markets are shuttered for a local holiday.
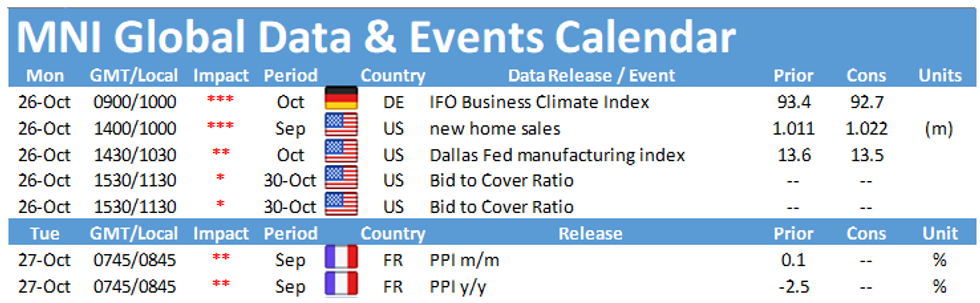
- Focus today falls on German Ifo Survey, U.S. new home sales and comments from ECB's de Cos.
MNI TECHNICALS:
EUR/USD: Bullish Focus
- RES 4: 1.2011 High Sep and key resistance
- RES 3: 1.1917 Sep 10 high / 76.4% of the Sep 1 - 25 sell-off
- RES 2: 1.1904 1.0% 10-dma envelope
- RES 1: 1.1881 High Oct 21 and the intraday bull trigger
- PRICE: 1.1833 @ 05:43 BST Oct 26
- SUP 1: 1.1787/60 Low Oct 23 / Oct 20
- SUP 2: 1.1747 50-day EMA
- SUP 3: 1.1729 Trendline support drawn off the Sep 28 low
- SUP 4: 1.1689 Low Oct 15 and a key support
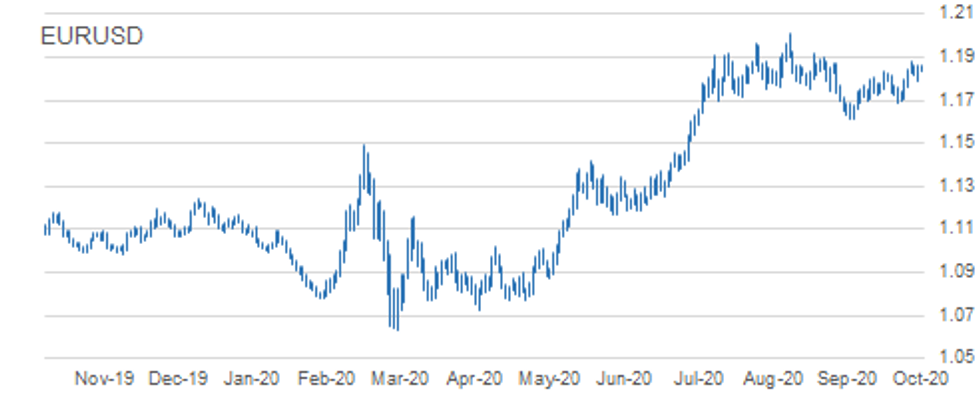
EURUSD recovered off the Friday low however price remains below last week's high of 1.1881. The outlook is positive and pullbacks are considered corrective. The recent breach of the former bull trigger at 1.1831, Oct 9 high reinforced the current bullish price structure and signals scope for 1.1917 next, a retracement level with the major resistance and hurdle for bulls at 1.2011, Sep 1 high. Short-term trendline support is at 1.1729.
GBP/USD: Corrective Pullback
- RES 4: 1.3292 76.4% retracement of the Sep 1 - 23 sell-off
- RES 3: 1.3260 2.0% 10-dma envelope
- RES 2: 1.3245 Former trendline support drawn off the Mar 20 low
- RES 1: 1.3177 High Oct 21
- PRICE: 1.3024 @ 05:57 BST Oct 26
- SUP 1: 1.2979 20-day EMA
- SUP 2: 1.2940 Low Oct 21
- SUP 3: 1.2863 Low Oct 14 and key near-term support
- SUP 4: 1.2806 Low Sep 30
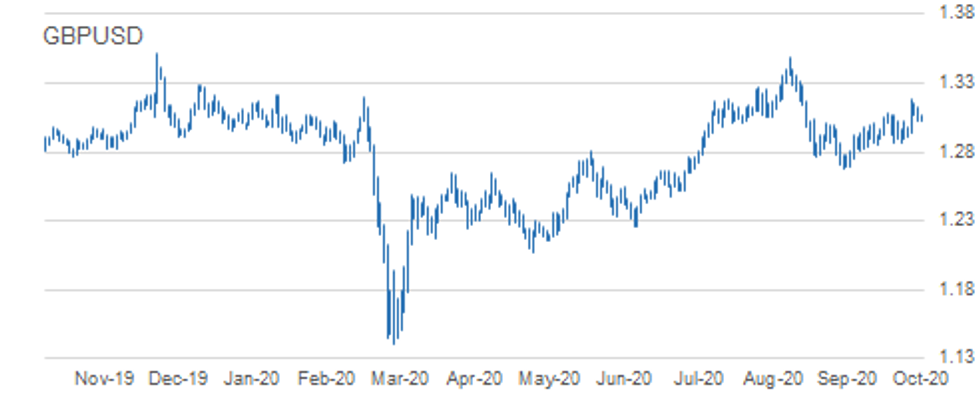
GBPUSD continues to retrace the Oct 21 rally. The move lower is likely a correction though with the S/T bullish structure still intact. The Oct 21 climb reinforced the near-term bullish theme, confirming a resumption of the upleg that started on Sep 23. Attention is on 1.3245, the former trendline support drawn off the Mar 20 low. The trendline was breached on Sep 9. Firm support is at 1.2940, Oct 21 low. The reversal trigger lies at 1.2863, Oct 14 low.
EUR/GBP: Focus Is On Support
- RES 4: 0.9162 High Oct 7
- RES 3: 0.9158 1.0% 10-dma envelope
- RES 2: 0.9149 Oct 20 high
- RES 1: 0.9107 High Oct 23
- PRICE: 0.9084 @ 06:03 BST Oct 26
- SUP 1: 0.9012 Low Oct 21
- SUP 2: 0.9007 Low Oct 14 and the bear trigger
- SUP 3: 0.8967 76.4% retracement of the Sep 3 - 11 rally
- SUP 4: 0.8925 Low Sep 7
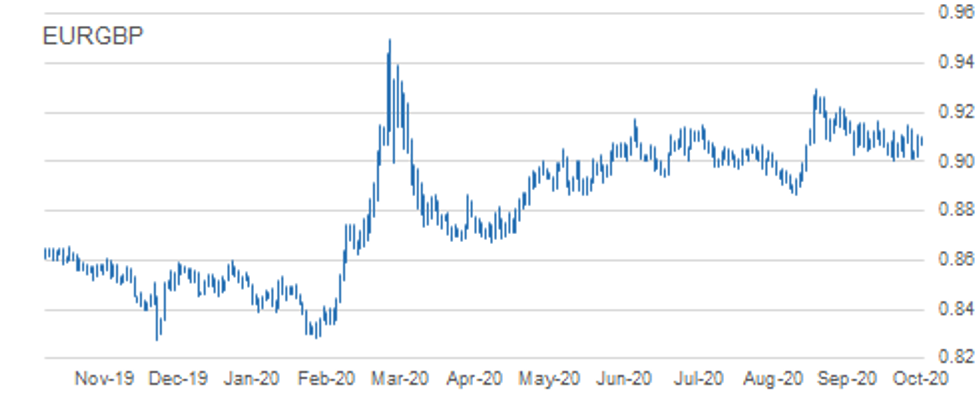
EURGBP ended last week's session with a strong recovery Friday. The outlook though remains bearish following the sharp sell-off on Oct 21. Attention is on support at 0.9007, Oct 14 low and the near-term bear trigger. A break of 0.9007 would confirm a resumption of the downtrend that started Sep 11 andexpose 0.8967, a retracement point. Key resistance has been defined at 0.9149, Oct 20 high. The outlook is bearish below this level.
USD/JPY: Bearish Focus
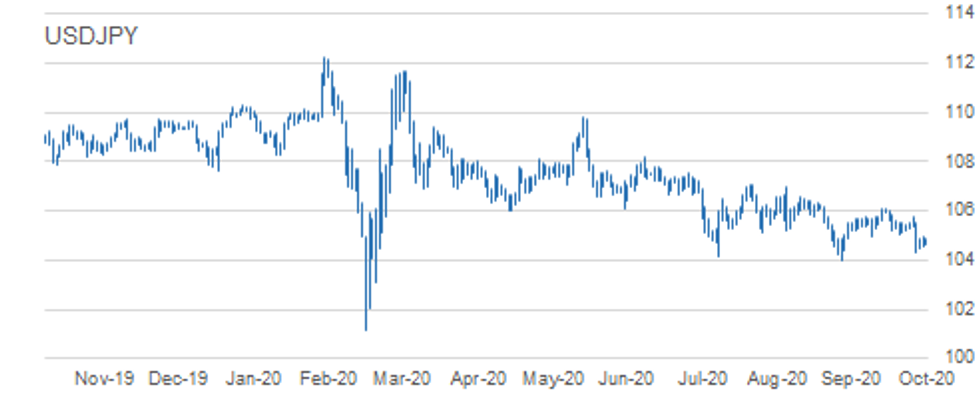
- RES 4: 106.11 High Oct 7 and key resistance
- RES 3: 105.75 High Oct 20
- RES 2: 105.53/63 High Oct 21 / 50-dma
- RES 1: 105.04 Low Oct 4 and a recent breakout level
- PRICE: 104.88 @ 06:11 BST Oct 26
- SUP 1: 104.34 Low Oct 21
- SUP 2: 104.00 Low Sep 21 and the bear trigger
- SUP 3: 103.67 76.4% retracement of the Mar 9 - 24 rally
- SUP 4: 103.09 Low Mar 12
USDJPY is consolidating. The pair maintains a weaker outlook following the Oct 21 sell-off and the resumption of the downleg from 106.11, Oct 7 high. A number of important supports have been cleared signalling scope for a deeper pullback towards the key 104.00 handle, Sep 21 low. A break of 104.00 would suggest scope for further USD depreciation within the bear channel drawn off the Mar 24 high. Initial resistance is at 105.04.
EUR/JPY: Holding Above Support For Now
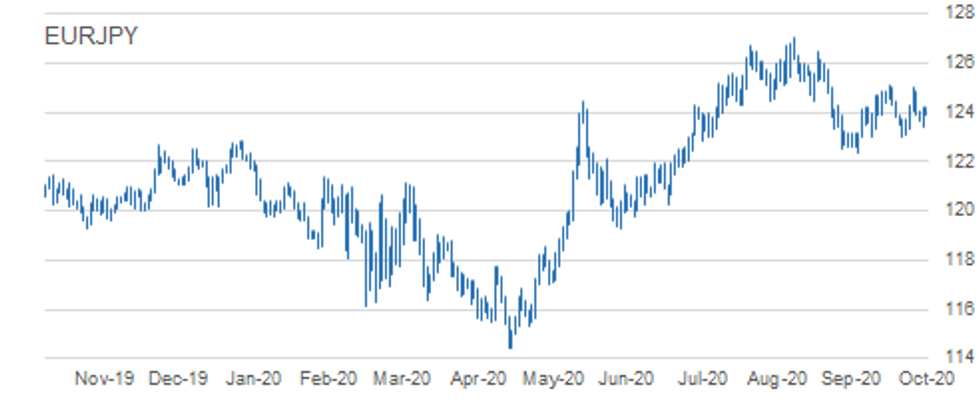
- RES 4: 125.97 76.4% retracement of the Sep 1 - 28 sell-off
- RES 3: 125.28 61.8% of the Sep 1 - 28 sell-off
- RES 2: 125.00/09 High Oct 20 and Oct 9
- RES 1: 124.23 High Oct 23 and intraday high
- PRICE: 124.12 @ 06:17 BST Oct 26
- SUP 1: 123.41 Low Oct 23
- SUP 2: 123.03/02 Low Sep 29 and Oct 2 / Low Oct 15
- SUP 3: 122.38/28 Low Sep 28 / 61.8% of the Jun 22 - Sep 1 rally
- SUP 4: 122.25 38.2% retracement of the May - Sep rally
EURJPY is unchanged and still trading below recent highs. Attention is on support at 123.03/02, low prints between Sep 29 and Oct 15. A break of this level would undermine the recent bullish outlook and instead highlight risk for a deeper sell-off towards 122.38, Sep 28 low and the bear trigger. Moving average studies are in a neutral position. To strengthen a bullish argument, price needs to clear key resistance at 125.09, Oct 9 high.
AUD/USD: Trendline Resistance Remains Intact
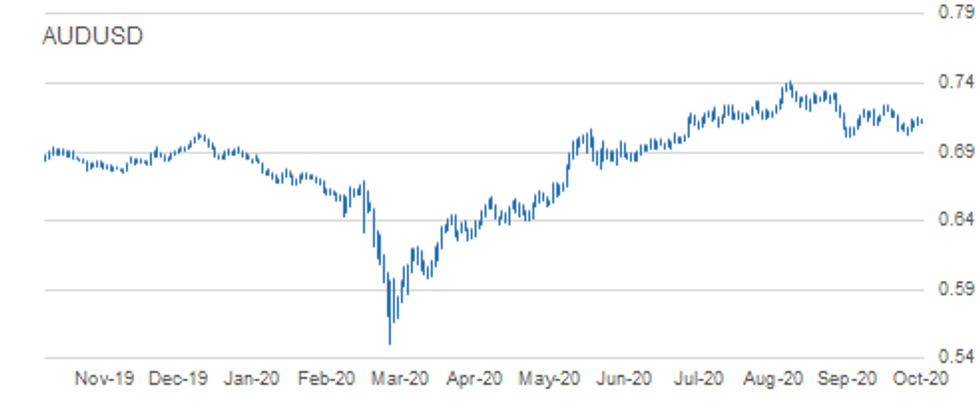
- RES 4: 0.7324 High Sep 21
- RES 3: 0.7243 High Oct 10 and the intraday bull trigger
- RES 2: 0.7169/70 Trendline drawn off the Sep 1 high / High Oct 15
- RES 1: 0.7158 High Oct 23
- PRICE: 0.7116 @ 06:22 BST Oct 26
- SUP 1: 0.7021 Low Oct 20
- SUP 2: 0.7006 Low Sep 25 and the bear trigger
- SUP 3: 0.6965 23.6% retracement of the Mar - Sep rally
- SUP 4: 0.6931 0.764 projection of Sep 1 - 25 sell-off from Oct 9 high
AUDUSD outlook remains bearish despite last week's recovery. The pair continues to trade below trendline resistance drawn off the Sep 1 high. The line intersects at 0.7169 and the recent failure at the trendline highlights a bearish risk. Attention is on the primary support and bear trigger at 0.7006, Sep 25 low. A trendline resistance break is needed to alter the picture that would signal a stronger reversal. This would open 0.7243, Oct 10 high.
USD/CAD: Bearish Risk Still Present
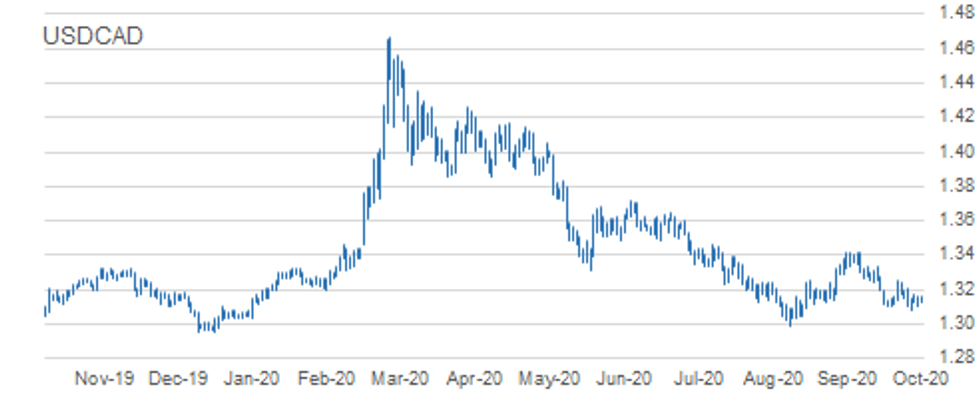
- RES 4: 1.3421 High Sep 30 and primary resistance
- RES 3: 1.3341 High Oct 7
- RES 2: 1.3241/59 50-day EMA / High Oct 15 and the bull trigger
- RES 1: 1. 3190 20-day EMA
- PRICE: 1.3163 @ 06:25 BST Oct 26
- SUP 1: 1.3081 Low Oct 21 and the intraday bear trigger
- SUP 2: 1.3047 Low Sep 7
- SUP 3: 1.3038 Low Sep 2
- SUP 4: 1.2994 Low Sep 1 and the major support
Despite still trading above last week's low, USDCAD bearish conditions remain intact. The pair last week traded below key support at 1.3099, Oct 13 low. The move lower confirms a resumption of the current downtrend that started Sep 30. Moving average studies are bearish too, reinforcing the current climate. Scope exists for a move towards the major support at 1.2994, Sep 1 low. Key resistance has been defined at 1.3259, Oct 15 high.
MNI KEY LEVELS
EUR/USD: MNI Key Levels
- $1.1996/09 May14-2018 high/May03-2018 high
- $1.1938 May15-2018 high
- $1.1922 Upper Bollinger Band (3%)
- $1.1906 Upper 1.0% 10-dma envelope
- $1.1873 Upper Bollinger Band (2%)
- $1.1851/57/61 Cloud top, Jun14-2018 high/100-mma/Intraday high
- $1.1836 100-hma
- $1.1836 ***CURRENT MARKET PRICE 05:27BST MONDAY***
- $1.1832 Intraday low
- $1.1815 Sep24-2018 high
- $1.1799/97/85 55-dma/50-dma/200-hma
- $1.1769/57 21-dma/Sep27-2018 high
- $1.1736 Fibo 38.2% 1.3993-1.0341
- $1.1676/71 Lower Boll Band (2%)/Lower 1.0% 10-dma env
- $1.1651/39 Sep28-2018 high/100-dma
GBP/USD: MNI Key Levels
- $1.3198/13 Upper Boll Band (3%)/Mar28-2019 high
- $1.3185/91/96 May06-2019 high/Apr04-2019 high/Apr03-2019 high
- $1.3144 Fibo 38.2% 1.4377-1.2382
- $1.3127/31/33 Upper 1.0% 10-dma env/May07-2019 high/Apr12-2019 high
- $1.3109/22 50% 1.1841-1.4377/Upper Boll Band (2%)
- $1.3075/80 Intraday high/May08-2019 high
- $1.3041/45/52 May13-2019 high/Cloud top/100-hma
- $1.3027 ***CURRENT MARKET PRICE 05:27BST MONDAY***
- $1.3021/17/12 Intraday low/55-dma/50-dma
- $1.3001/99/91 200-hma/61.8% 1.3381-1.2382/May10-2019 low
- $1.2981/70 Cloud base/May14-2019 high
- $1.2963/52 21-dma/50-mma
- $1.2947 200-wma
- $1.2904 May14-2019 low
- $1.2882 Fibo 50% 1.3381-1.2382
EUR/GBP: MNI Key Levels
- Gbp0.9253 Upper 2.0% 10-dma envelope
- Gbp0.9226 Sep04-2017 high
- Gbp0.9203 Sep08-2017 high
- Gbp0.9162/74 Upper 1.0% 10-dma env/Upper Boll Band (3%)
- Gbp0.9134/43 Sep11-2017 high/Upper Boll Band (2%)
- Gbp0.9108 Jan03-2019 high
- Gbp0.9097/04 Intraday high/Cloud top
- Gbp0.9085 ***CURRENT MARKET PRICE 05:34BST MONDAY***
- Gbp0.9080/79/70 21-dma/Cloud base/Intraday low
- Gbp0.9069/67/65 100-hma/50-dma/200-hma, 55-dma
- Gbp0.9062/51/48 Jan11-2019 high/Jul17-2019 high/100-dma, Jul16-2019 high
- Gbp0.9039 Jul18-2019 high
- Gbp0.9015/10 Lower Boll Band (2%)/Jul10-2019 high
- Gbp0.9005/00 Jul23-2019 high/Jul22-2019 high
- Gbp0.8983/80 Lower Boll Band (3%)/Lower 1.0% 10-dma env
USD/JPY: MNI Key Levels
- Y105.68 55-dma
- Y105.59 50-dma
- Y105.49 Cloud base
- Y105.40 21-dma
- Y105.13 200-hma
- Y105.06 Cloud Kijun Sen
- Y104.92/93/05 100-hma/Intraday high/Cloud Tenkan Sen
- Y104.91 ***CURRENT MARKET PRICE 05:36BST MONDAY***
- Y104.87 Jan03-2019 low
- Y104.66 Intraday low
- Y104.62 Lower Bollinger Band (2%)
- Y104.56 Mar26-2018 low
- Y104.24 Lower Bollinger Band (3%)
- Y104.10 Lower 1.0% 10-dma envelope
- Y104.00 YTD low
EUR/JPY: MNI Key Levels
- Y124.69 55-dma
- Y124.57 50-dma
- Y124.51 Fibo 61.8% 126.81-120.78
- Y124.34 Apr01-2019 low
- Y124.25 May07-2019 high
- Y124.23 Intraday high
- Y124.18/22 100-hma/38.2% 133.13-118.71
- Y124.15 ***CURRENT MARKET PRICE 05:38BST MONDAY***
- Y124.14/04 38.2% 118.71-127.50/21-dma
- Y124.01 Cloud Tenkan Sen
- Y123.90 200-hma
- Y123.89 Intraday low
- Y123.80 Fibo 50% 126.81-120.78
- Y123.74 May21-2019 high, Cloud Kijun Sen
- Y123.72 Fibo 61.8% 115.21-137.50
AUD/USD: MNI Key Levels
- $0.7253/62 Upper 2.0% 10-dma env/50-mma
- $0.7234/44 Upper Boll Band (2%)/200-wma
- $0.7197/06/07 50-dma/Apr17-2019 high/Feb21-2019 high
- $0.7182/94 Upper 1.0% 10-dma env/55-dma
- $0.7153/68 Apr17-2019 low/Cloud base
- $0.7136/40/42 21-dma/Apr16-2019 low/Intraday high
- $0.7116 Apr12-2019 low
- $0.7116 ***CURRENT MARKET PRICE 05:39BST MONDAY***
- $0.7112/10/08 Intraday low/Apr10-2019 low/100-dma
- $0.7101/88 200-hma, 100-hma/Apr08-2019 low
- $0.7073/69 Mar29-2019 low/Apr30-2019 high
- $0.7057/53/48 Jul22-2019 high/Apr02-2019 low/Jul04-2019 high, May07-2019 high
- $0.7045/44/40 Lower Boll Band (2%)/Jul16-2019 high/Lower 1.0% 10-dma env
- $0.6997/85 Lower Boll Band (3%)/Jan03-2019 low
- $0.6971/69/67 Jul12-2019 low/Lower 2.0% 10-dma env/Jun11-2019 high
USD/CAD: MNI Key Levels
- C$1.3320/28 Cloud top/38.2% 1.2783-1.3665
- C$1.3300/09 Jun13-2019 low/38.2% 1.3565-1.3151
- C$1.3286/90 Jun20-2019 high/Upper 1.0% 10-dma env
- C$1.3215/24/26 21-dma/50% 1.2783-1.3665/Jun10-2019 low
- C$1.3198/02 50-dma/55-dma
- C$1.3164/75 Jul23-2019 high/50-mma
- C$1.3162/63 Intraday high/Feb21-2019 low
- C$1.3162 ***CURRENT MARKET PRICE 05:41BST MONDAY***
- C$1.3161/60/53 200-hma/200-wma/Cloud base
- C$1.3151/50/40 Jun20-2019 low/Feb20-2019 low/100-hma
- C$1.3126/20/16 Intraday low/61.8% 1.2783-1.3665/Jul23-2019 low
- C$1.3113/07 Feb25-2019 low/Jun26-2019 low
- C$1.3066/53 38.2% 1.4690-1.2062/38.2% 1.2062-1.3665
- C$1.3044 Lower Bollinger Band (2%)
- C$1.3027/15 Lower 1.0% 10-dma env/Oct25-2018 low
Why MNI
MNI is the leading provider
of intelligence and analysis on the Global Fixed Income, Foreign Exchange and Energy markets. We use an innovative combination of real-time analysis, deep fundamental research and journalism to provide unique and actionable insights for traders and investors. Our "All signal, no noise" approach drives an intelligence service that is succinct and timely, which is highly regarded by our time constrained client base.Our Head Office is in London with offices in Chicago, Washington and Beijing, as well as an on the ground presence in other major financial centres across the world.