
Why MNI
MNI is the leading provider
of intelligence and analysis on the Global Fixed Income, Foreign Exchange and Energy markets. We use an innovative combination of real-time analysis, deep fundamental research and journalism to provide unique and actionable insights for traders and investors. Our "All signal, no noise" approach drives an intelligence service that is succinct and timely, which is highly regarded by our time constrained client base.Our Head Office is in London with offices in Chicago, Washington and Beijing, as well as an on the ground presence in other major financial centres across the world.
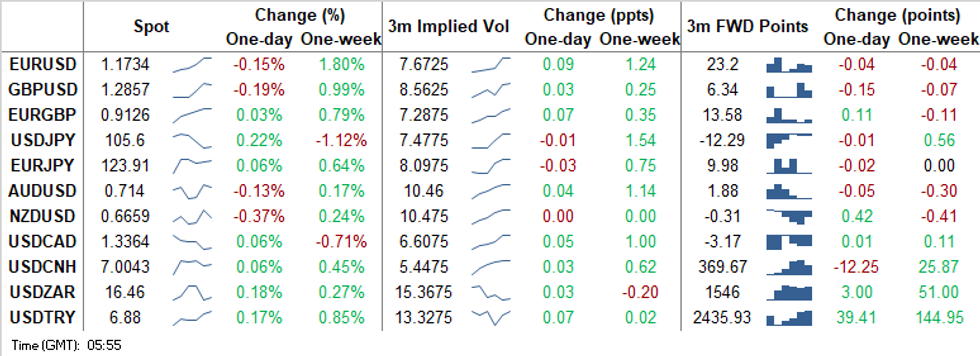
Precious Metals Retreat, USD Recoils
DXY bounced into positive territory and the greenback jumped onto the top
of the G10 pile as gold and silver retreated. Precious metals were
offered amid apparent profit taking after gold futures (Z0)
topped out at 2,000. A sudden recovery in USD set the tone of G10 FX
price action in the Asia afternoon.
- AUD crosses pulled back from highs alongside gold & silver. NZD followed
suit, but its decline was deeper, perhaps as China protested New Zealand's
decision to suspend its extradition treaty with Hong Kong. - The loonie was bid, USD/CAD printed a 7-week low before USD recovery.
- Despite trimming losses, USD/IDR continued to operate below neutral
levels, following the formation of a "death cross" (50-DMA < 200-DMA). - Renewed demand for USD inspired a strong rebound in USD/KRW, capped
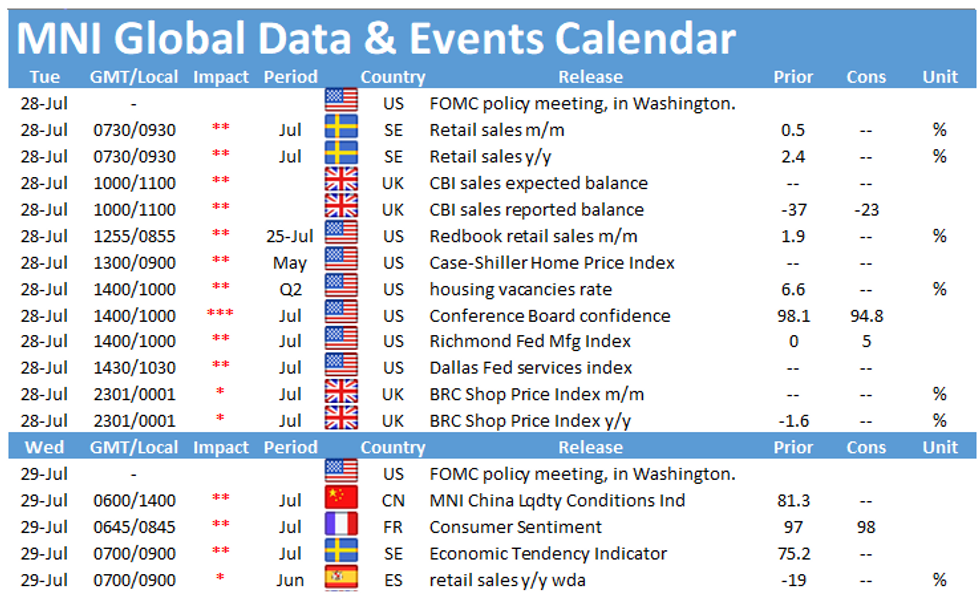
only by yesterday's highs. The won led losses in Asia EM FX space. - Focus moves to U.S. Conf. Board Consumer Confidence, as well as Swedish
retail sales and trade balance.
TECHNICALS
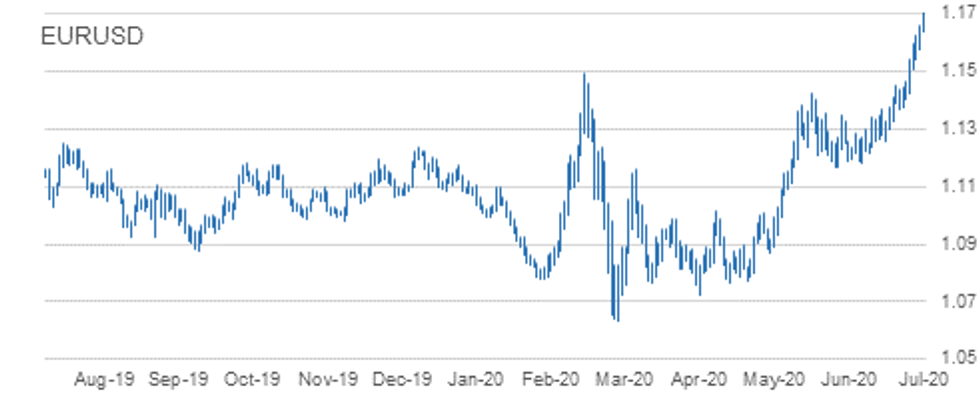
EURUSD: Holds Onto Gains
- RES 4: 1.1863 3.0% 10-dma envelope
- RES 3: 1.1815 High Sep 2018
- RES 2: 1.1800 Round number resistance
- RES 1: 1.1781 Intraday high / 2.00 proj of Mar 23 - 30 - Apr 24 swing
- PRICE: 1.1733 @ 05:49 BST Jul 28
- SUP 1: 1.1639/1581 Low Jul 27 / Low Jul 24
- SUP 2: 1.1507 Low Jul 22
- SUP 3: 1.1472 20-day EMA
- SUP 4: 1.1423 Low Jul 21
The pair enjoyed its best session for months Monday, extending the recent rally through the $1.1700 handle. Bulls remain (firmly) in control for now. A
positive theme follows last week's breach of 1.1495, Mar 9 high with the pair registering fresh 2020 highs. This also confirmed a strong resumption of the broader uptrend in place since Mar 20. The focus is on 1.1815, Sep 2018 high. Initial support is 1.1639, yesterday's low.
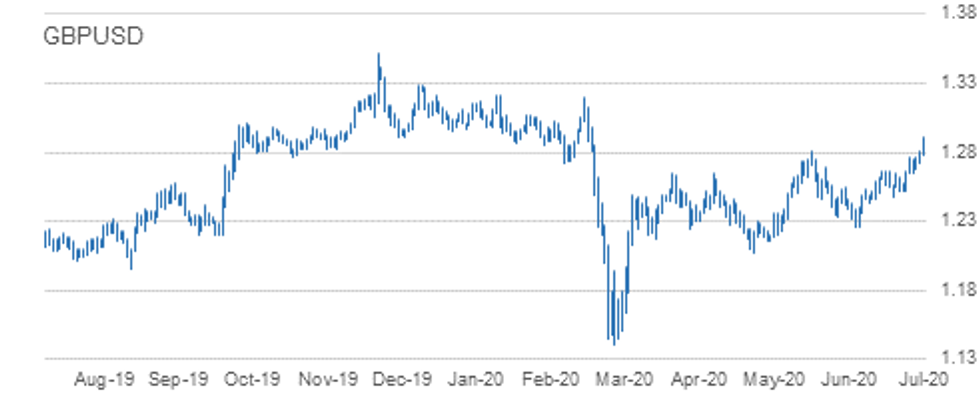
GBPUSD: Needle Points North
- RES 4: 1.3130 High Mar 10
- RES 3: 1.3020 0.764 proj of the Mar 20 - Apr 14 rally from May 18 low
- RES 2: 1.2977 High Mar 11
- RES 1: 1.2904 Intraday high
- PRICE: 1.2859 @ 05:56 BST Jul 28
- SUP 1: 1.2717 Low Jul 24
- SUP 2: 1.2644 Low Jul 22
- SUP 3: 1.2636 20-day EMA
- SUP 4: 1.2549/2480 50-day EMA / Low Jul 14
GBPUSD traded higher yesterday and maintains a bullish tone. The pair Monday cleared resistance at 1.2813 Jun 10 high, confirming a resumption of the broader uptrend that has been in place since the reversal on Mar 20. Attention turns to 1.2977, Mar 11 high and 1.3020, a Fibonacci projection. On the downside, firm near-term support has been defined at 1.2644, Jul 22 low. Initial support is seen at 1.2717.
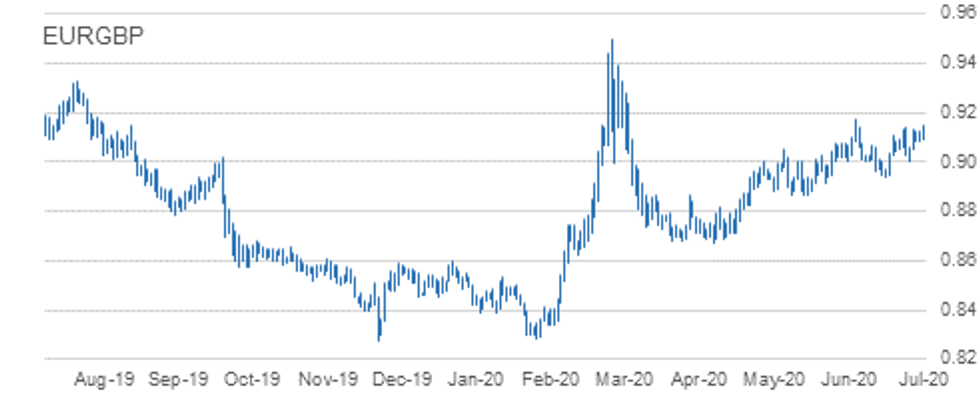
EURGBP: Looking For A Break Higher
- RES 4: 0.9264 2.0% 10-dma envelope
- RES 3: 0.9184 61.8% Fibonacci retracement of the Mar - Apr decline
- RES 2: 0.9176 High Jun 29 and the bull trigger
- RES 1: 0.9148 High Jul 27
- PRICE: 0.9124 @ 06:04 BST Jul 28
- SUP 1: 0.9056 20-Day EMA
- SUP 2: 0.9001 Low Jul 21 and key near-term support
- SUP 3: 0.8996 50-day EMA
- SUP 4: 0.8938 Low Jul 10 and the key near-term support
EURGBP found support Jul 21 and has defined a S/T base at 0.9001. The outlook remains bullish. This follows recent Japanese candle patterns that highlighted a reversal. Activity Jun 13, was a bullish engulfing and followed a doji candle on Jun 10. Together they signalled a reversal off 0.8938, Jun 10 low. The focus is on 0.9145, Jun 30 high and 0.9176, Jun 29 high. A break of 0.9001 would concern bulls.
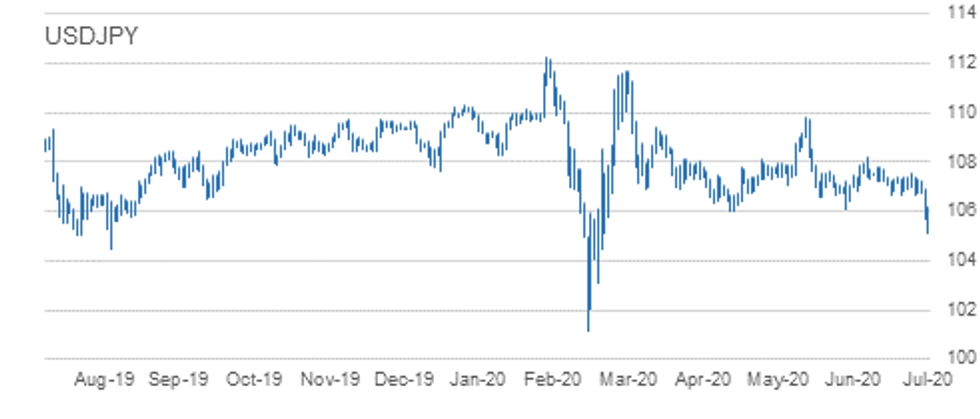
USDJPY: Heavy!
- RES 4: 107.79 High Jul 7 and key resistance
- RES 3: 107.53 High Jul 20
- RES 2: 106.90 High Jul 24
- RES 1: 106.16 High Jul 27
- PRICE: 105.61 @ 06:10 BST Jul 28
- SUP 1: 105.12 Low Jul 27
- SUP 2: 104.672.0% 10-dma envelope
- SUP 3: 104.51 Low Mar 13
- SUP 4: 103.67 76.4% retracement of the Mar 9 - 24 rally
USDJPY was under pressure throughout the Monday session and bearish pressure is likely to still dominate near-term. Friday's bearish session saw the pair breach key supports at 106.07, Jun 23 low and 105.99, May 6 and 7 low. Monday's move lower confirmed a clear break of this support zone. 105.21, a Fibonacci retrace level has been achieved, opening 104.51 next, Mar 13 low. Initial resistance is 106.16.
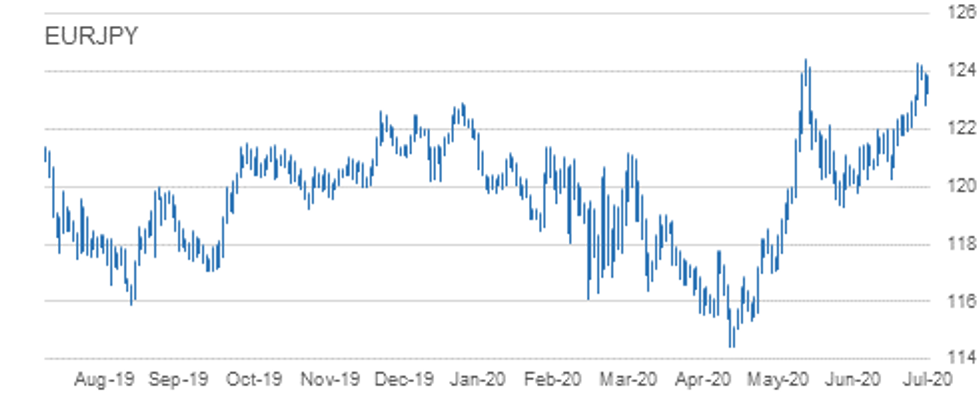
EURJPY: Attention Is On Last Weeks High
- RES 4: 125.49 0.618 projection of the May 6 - Jun 5 from Jun 22 low
- RES 3: 125.47 2.0% 10-dma envelope
- RES 2: 125.23 High May 1, 2019
- RES 1: 124.29/43 High Jul 22 / Jun 5 and key resistance
- PRICE: 123.91 @ 06:15 BST Jul 28
- SUP 1: 122.84 Low Jul 24
- SUP 2: 122.47 Low Jul 21
- SUP 3: 122.35 20-day EMA
- SUP 4: 121.82 Low Jul 15 and 16
EURJPY last week found resistance at 124.29, Jul 22 high just ahead of the primary resistance at 124.43, Jun 5 high. Friday saw key support at 123.06 probed before the cross found strong support at the day low of 122.84. A close below 123.06 would signal a top and highlight the potential for a deeper correction. For now, the current uptrend remains intact. Clearance of 124.43 would trigger an extension higher.
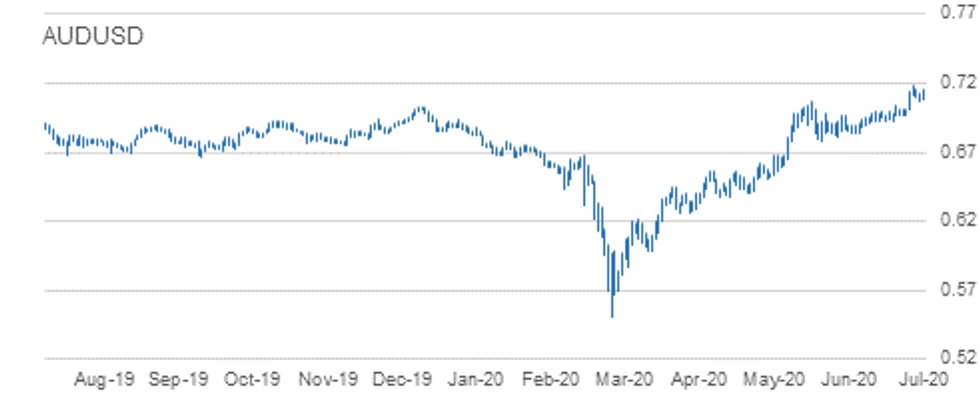
AUDUSD: Bulls In Control
- RES 4: 0.7246 High Feb 6, 2019
- RES 3: 0.7222 1.764 projection of the Mar 19 - 31 rally from Apr 3 low
- RES 2: 0.7206 High Apr 17, 2019
- RES 1: 0.7182/99 High Jul 22 / High Apr 18, 2019
- PRICE: 0.7133 @ 06:29 BST Jul 28
- SUP 1: 0.7063/64 High Jun 10 & former breakout level / Low Jul 24
- SUP 2: 0.7010 Low Jul 21
- SUP 3: 0.6963 Low Jul 16
- SUP 4: 0.6922/21 Low Jul 7 / Low Jul 14
AUDUSD traded higher overnight and remains in an uptrend. Last week the pair cleared former resistance at 0.7063, Jun 10 high. The breach confirmed a resumption of the uptrend that has been in place since Mar 19. Price also traded above the recent objective of 0.7119, a Fibonacci projection and the focus is on 0.7222. On the downside, the key near-term support remains 0.6922/21, Jul 7 and 14 low. Initial support is at 0.7063.
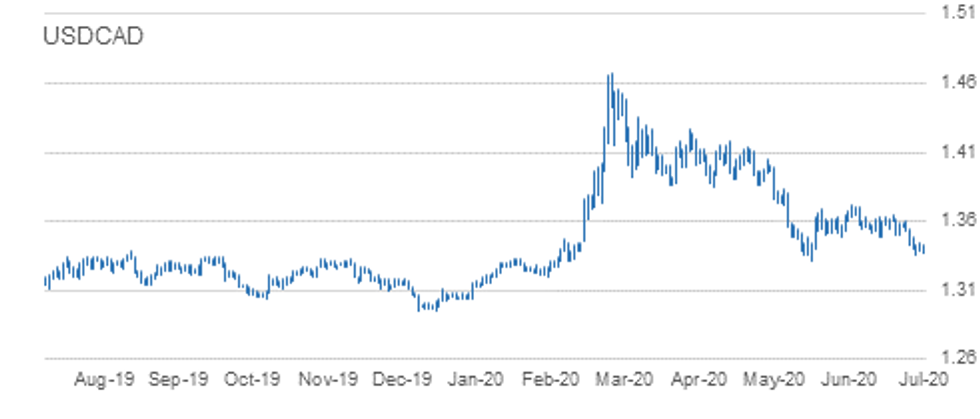
USDCAD: Approaching Key Support
- RES 4: 1.3607/46 50-day EMA / High Jul 14 and key S/T resistance
- RES 3: 1.3600 High Jul 20
- RES 2: 1.3537 High Jul 21
- RES 1: 1.3491 Low Jul 9
- PRICE: 1.3373 @ 06:26 BST Jul 28
- SUP 1: 1.3331 Intraday low
- SUP 2: 1.3316 Low Jun 10 and bear trigger
- SUP 3: 1.3235 Low Feb 24
- SUP 4: 1.3267 Low Feb 25
USDCAD remains vulnerable. Price action last week cleared key support at 1.3486, Jun 23 low. This confirmed the end of the broad sideways move that had dominated since mid-June. The former support at 1.3398 Jun 11 low has also been cleared, reinforcing the bearish threat. The break lower opens 1.3316, Jun 10 low where clearance would expose 1.3202, Feb 21 low. Resistance is at 1.3491, Jul 9 low.
LEVELS:
EUR/USD: MNI KEY LEVELS
*$1.1938 May15-2018 high
*$1.1911 Upper Bollinger Band (3%)
*$1.1897 Upper 3.0% 10-dma envelope
*$1.1884 100-mma
*$1.1851 Jun14-2018 high
*$1.1815 Sep24-2018 high
*$1.1781 YTD Jul27 high, Upper 2.0% 10-dma env
*$1.1774 Intraday high
*$1.1749 Upper Bollinger Band (2%)
*$1.1731 ***CURRENT MARKET PRICE 06:07BST TUESDAY***
*$1.1714 Intraday low
*$1.1703 Down Trendline from Jul18-2008
*$1.1666 Upper 1.0% 10-dma envelope
*$1.1639/38 Jul27 low/100-hma
*$1.1627 Jul23 high*$1.1541/39 Jul23 low/200-hma
*$1.1507 Jul22 low
*$1.1495 Mar09 high*$1.1468 Jul20 high
*$1.1435 Lower 1.0% 10-dma envelope
GBP/USD: MNI KEY LEVELS
*$1.3130 Mar10 high
*$1.3092 Upper 3.0% 10-dma envelope
*$1.3018/19 Feb25 high/Mar09 low
*$1.3003 Upper Bollinger Band (3%)
*$1.2977/81 Mar11 high/Feb21 high
*$1.2965/69/70 Upper 2.0% 10-dma env/Mar05 high/Feb24 high
*$1.2955 50-mma
*$1.2947 Mar06 low
*$1.2904/07 Intraday high/200-wma
*$1.2877 Upper Bollinger Band (2%)
*$1.2859 ***CURRENT MARKET PRICE 06:15BST TUESDAY***
*$1.2846 Intraday low
*$1.2838 Upper 1.0% 10-dma envelope
*$1.2813 Jun10 high
*$1.2778 100-hma
*$1.2746 100-wma
*$1.2702 200-dma
*$1.2696 200-hma
*$1.2673 Jul23 low
*$1.2644 Jul22 low
*$1.2625 Jul16 high
EUR/GBP: MNI KEY LEVELS
*Gbp0.9346 Oct15-2009 high
*Gbp0.9339 Mar20 high
*Gbp0.9326 Mar24 high
*Gbp0.9276 Mar25 high
*Gbp0.9269 Upper 2.0% 10-dma envelope
*Gbp0.9240 Mar26 high
*Gbp0.9207 Upper Bollinger Band (3%)
*Gbp0.9176/78 Jun29 high/Upper 1.0% 10-dma env
*Gbp0.9154 Upper Bollinger Band (2%)
*Gbp0.9134 Intraday high
*Gbp0.9127 ***CURRENT MARKET PRICE 06:22BST TUESDAY***
*Gbp0.9108/07 100-hma/Intraday low
*Gbp0.9088 200-hma
*Gbp0.9082 Jul23 low
*Gbp0.9052/49 Jul22 low/21-dma
*Gbp0.9007 50-dma
*Gbp0.9001/98 Jul21 low/55-dma
*Gbp0.8996 Lower 1.0% 10-dma envelope
*Gbp0.8973 Cloud top
*Gbp0.8946/43 Jul13 low, Jul09 low/Lower Boll Band (2%)
*Gbp0.8938 100-dma, Jul10 low
USD/JPY: MNI KEY LEVELS
*Y106.72 200-hma
*Y106.67 100-mma
*Y106.64 Cloud Kijun Sen
*Y106.33 Cloud Tenkan Sen
*Y106.32 100-hma
*Y106.22 May08 low
*Y106.16 Jul27 high
*Y105.99 May06 low
*Y105.78 Lower Bollinger Band (2%)
*Y105.69 Intraday high
*Y105.62 ***CURRENT MARKET PRICE 06:14BST TUESDAY***
*Y105.58 Lower 1.0% 10-dma envelope
*Y105.22 Intraday low
*Y105.18 Lower Bollinger Band (3%)
*Y105.12 Jul27 low
*Y104.51 Lower 2.0% 10-dma envelope
*Y103.97 200-mma
*Y103.44 Lower 3.0% 10-dma envelope
*Y103.09 Mar12 low
*Y102.02 Mar10 low
*Y101.20 Nov09-2016 low
EUR/JPY: MNI KEY LEVELS
*Y126.11 100-mma
*Y125.72 Upper Bollinger Band (3%)
*Y125.64 Upper 2.0% 10-dma envelope
*Y124.80 200-wma
*Y124.55 Upper Bollinger Band (2%)
*Y124.40 Upper 1.0% 10-dma envelope
*Y124.18 50-mma*Y123.99 Intraday high
*Y123.91 ***CURRENT MARKET PRICE 06:18BST TUESDAY***
*Y123.73/72 100-hma/Intraday low
*Y123.14 200-hma
*Y123.06 Cloud Tenkan Sen
*Y122.50 100-wma
*Y122.17 21-dma
*Y122.05 Cloud Kijun Sen
*Y121.94 Lower 1.0% 10-dma envelope
*Y121.12 50-dma
*Y120.71 Lower 2.0% 10-dma envelope
*Y120.70 55-dma
AUD/USD: MNI KEY LEVELS
*$0.7356 Dec05-2018 high
*$0.7287 Upper 3.0% 10-dma envelope
*$0.7280 50-mma
*$0.7256/61 Upper Boll Band (3%)/200-wma
*$0.7217 Upper 2.0% 10-dma envelope
*$0.7206/07 Apr17-2019 high/Feb21-2019 high
*$0.7182 YTD Jul22 high
*$0.7175/77 Upper Boll Band (2%)/Intraday high
*$0.7162 Jul23 high
*$0.7146 Upper 1.0% 10-dma envelope
*$0.7141 ***CURRENT MARKET PRICE 07:03BST TUESDAY***
*$0.7129/26 Intraday low/100-hma
*$0.7087 Jul27 low
*$0.7074 200-hma
*$0.7063 Jun10 high
*$0.7038 Jul15 high
*$0.7010/08 Jul21 low/21-dma
*$0.7004 Lower 1.0% 10-dma envelope
*$0.6973 Jul20 low
*$0.6963 Jul16 low
*$0.6934 Lower 2.0% 10-dma envelope
USD/CAD: MNI KEY LEVELS
*C$1.3608 Cloud base
*C$1.3597/00 Upper 1.0% 10-dma env/Jul20 high
*C$1.3588 50-dma
*C$1.3537 Jul21 high
*C$1.3519/22 200-dma/21-dma
*C$1.3483 Jul22 high
*C$1.3468 200-hma
*C$1.3435 Jul27 high
*C$1.3401 100-hma
*C$1.3375 Intraday high
*C$1.3372 ***CURRENT MARKET PRICE 06:22BST TUESDAY***
*C$1.3360 100-wma
*C$1.3351 Jul23 low, Lower Boll Band (2%)
*C$1.3331/28 Intraday low/Lower 1.0% 10-dma env
*C$1.3319/16/15 Mar03 low/Jun10 low/Mar02 low
*C$1.3308 Feb24 high
*C$1.3272/67 Feb26 low/Feb25 low, Lower Boll Band (3%)
*C$1.3235 Feb24 low
*C$1.3212 Feb20 low
*C$1.3202 Feb21 low
*C$1.3195/93/91 Jan31 low/Lower 2.0% 10-dma env/Jan30 low
Why MNI
MNI is the leading provider
of intelligence and analysis on the Global Fixed Income, Foreign Exchange and Energy markets. We use an innovative combination of real-time analysis, deep fundamental research and journalism to provide unique and actionable insights for traders and investors. Our "All signal, no noise" approach drives an intelligence service that is succinct and timely, which is highly regarded by our time constrained client base.Our Head Office is in London with offices in Chicago, Washington and Beijing, as well as an on the ground presence in other major financial centres across the world.