
Why MNI
MNI is the leading provider
of intelligence and analysis on the Global Fixed Income, Foreign Exchange and Energy markets. We use an innovative combination of real-time analysis, deep fundamental research and journalism to provide unique and actionable insights for traders and investors. Our "All signal, no noise" approach drives an intelligence service that is succinct and timely, which is highly regarded by our time constrained client base.Our Head Office is in London with offices in Chicago, Washington and Beijing, as well as an on the ground presence in other major financial centres across the world.
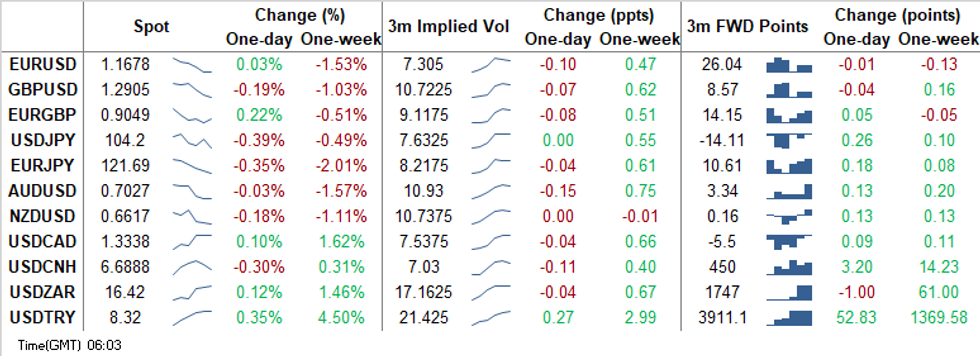
FOREX: USD Loses Ground Into Month-End, CNH Well Bid
The USD went offered in Asia as we approach month-end fixes. A downtick in the three major e-mini contracts did little to aid the USD. Demand for the yuan added pressure to the greenback, with USD/CNH shedding ~300 pips thus far as communique surrounding China's next five-year economic plan received scrutiny. There was little that we wouldn't already know in comments from Chinese leaders, who reiterated desire to turn the country into a global technological hub and promote the role of domestic market in driving economic growth.
- EUR/USD continues to feel the effect of a dovish ECB. However, rate off Thursday low of $1.1650 but recovery efforts remain laboured. Focus set firmly on December's ECB meeting. Despite current underlying pressure on the EUR most reports suggest a strong recovery for the single currency into 2021.
- CHF joined USD in losing steam, but JPY help up fairly well, even as it is the last Gotobi Day of the month today.
- AUD tracked gains in the yuan, topping the G10 pile as a result. Commodity-tied peers CAD & NOK also firmed up, but NZD failed to pick up a bid. AUD/NZD recoiled from a three-month low and advanced towards its 200-DMA, but failed to test the level as of yet.
- KRW garnered some strength owing to a faster than expected recovery in South Korea's industrial production.
- On the radar today we have EZ unemployment & advance GDP, flash French & Italian GDPs & CPIs, Canadian GDP, personal income/spending & MNI Chicago PMI out of the U.S., ECB Survey of Professional Forecasters as well as comments from ECB's de Guindos, Visco, Weidmann & Mersch.
MNI FX TECHNICALS:
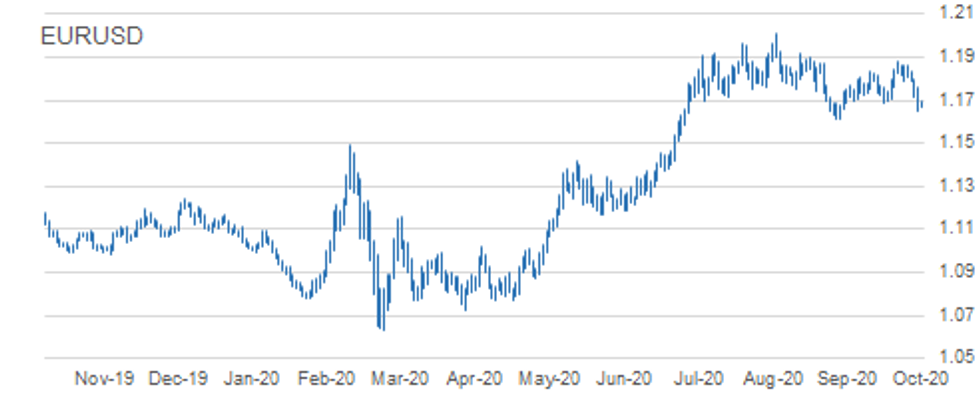
EUR/USD: Bearish Following Trendline Break
- RES 4: 1.1881 High Oct 21 and the bull trigger
- RES 3: 1.1839 High Oct 27
- RES 2: 1.1798 High Oct 28
- RES 1: 1.1759 High Oct 29
- PRICE: 1.1677 @ 05:38 GMT Oct 30
- SUP 1: 1.1650 Low Oct 29
- SUP 2: 1.1612 Low Sep 25 and the bear trigger
- SUP 3: 1.1576 0.764 proj of Sep 1 - 25 sell-off from Oct 21 high
- SUP 4: 1.1541 Low Jul 23
EURUSD came under considerable pressure Thursday and has confirmed a clear breach of its short-term trendline support drawn off the Sep 28 low. The clear break, confirmed by a move below Wednesday's low of 1.1718 as well as key support at 1.1689, Oct 15 low strengthens the bearish case. This opens 1.1612, Sep 25 low and the primary bear trigger. Initial resistance is at 1.1759, Thursday's intraday high.
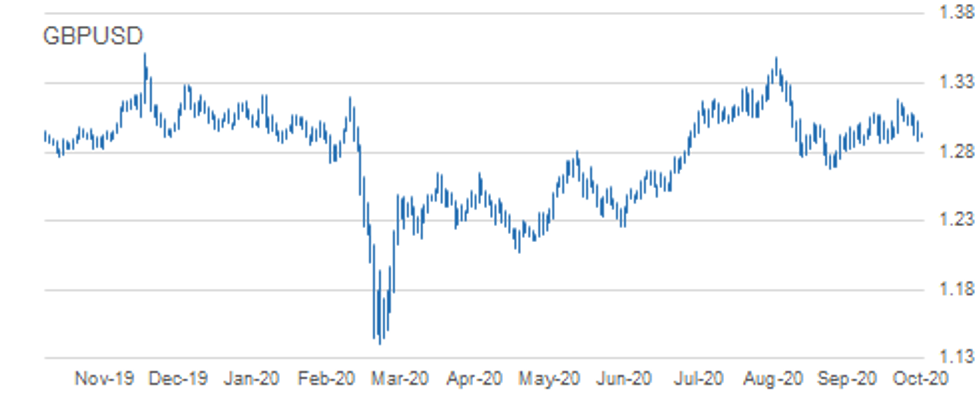
GBP/USD: Support Exposed
- RES 4: 1.3266 2.0% 10-dma envelope
- RES 3: 1.3177 High Oct 21 and the bull trigger
- RES 2: 1.3080 High Oct 27 and key near-term resistance
- RES 1: 1.3026 High Oct 29
- PRICE: 1.2908 @ 05:46 GMT Oct 30
- SUP 1: 1.2881 Low Oct 29
- SUP 2: 1.2863 Low Oct 14 and key near-term support
- SUP 3: 1.2806 Low Sep 30
- SUP 4: 1.2794 76.4% retracement of the Sep 23 - Oct 21 rally
GBPUSD traded lower Wednesday's low on broad-based USD strength. This reaffirms the bearish threat, which continues to dominate following recent weakness. The print below 1.2940 suggests scope for a deeper corrective pullback exposing 1.2863, Oct 14 low and a key support. Price action has defined initial firm resistance at 1.3080, Oct 27 high. A move back above this hurdle would ease bearish pressure and open 1.3177.
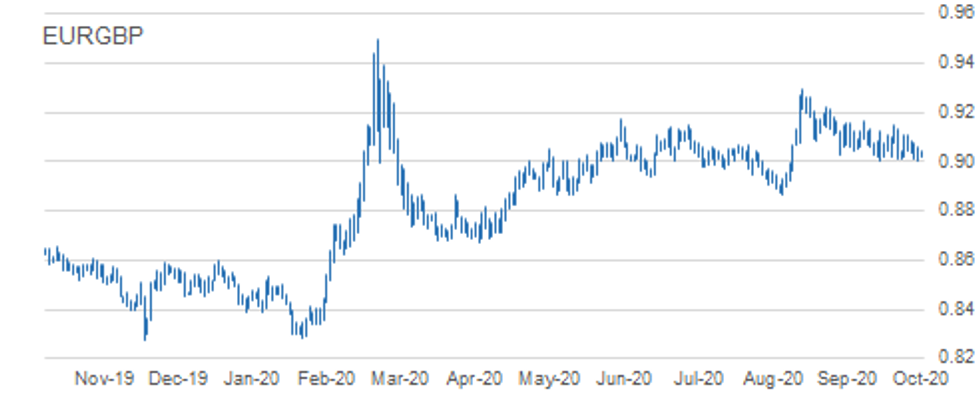
EUR/GBP: Eyeing Key Support
- RES 4: 0.9220 High Sep 22
- RES 3: 0.9154/62 1.0% 10-dma envelope / High Oct 7
- RES 2: 0.9149 Oct 20 high
- RES 1: 0.9107 High Oct 23
- PRICE: 0.9048 @ 05:54 GMT Oct 30
- SUP 1: 0.9007 Low Oct 14 / 29 and bear trigger
- SUP 2: 0.8967 76.4% retracement of the Sep 3 - 11 rally
- SUP 3: 0.8925 Low Sep 7
- SUP 4: 0.8900 Low Sep 4
EURGBP is trading closer to recent lows and remains largely unchanged. The outlook is bearish following the sharp sell-off on Oct 21. Attention is on 0.9007, Oct 14 and 29 low, the near-term bear trigger. A break of 0.9007 would confirm a resumption of the downtrend that started Sep 11 and expose 0.8967, a retracement. Key S/T resistance has been defined at 0.9149, Oct 20 high. Clearance of this level would undermine bearish conditions.
USD/JPY: All Eyes On 104.00
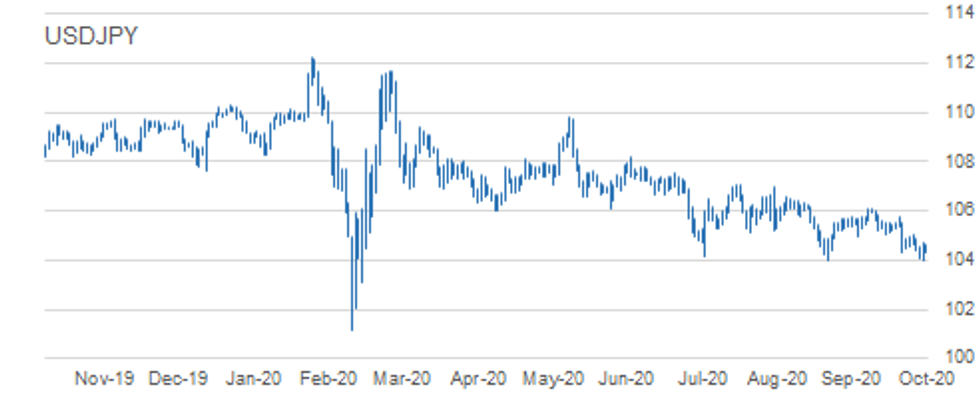
- RES 4: 105.75 High Oct 20
- RES 3: 105.51/53 50-dma / High Oct 21
- RES 2: 105.06 High Oct 26 and key near-term resistance
- RES 1: 104.73 High Oct 29
- PRICE: 104.20 @ 06:02 GMT Oct 30
- SUP 1: 104.00 Low Sep 21 and the bear trigger
- SUP 2: 103.67 76.4% retracement of the Mar 9 - 24 rally
- SUP 3: 103.09 Low Mar 12
- SUP 4: 102.02 Low Mar 10
USDJPY maintains a bearish outlook and has overnight retraced most of yesterday's gains. Attention is on the key 104.00 handle, Sep 21 low. Clearance of this support would suggest scope for a deeper USD sell-off within the bear channel drawn off the Mar 24 high. A break lower would also confirm a resumption of the current downtrend and maintain the bearish price sequence of lower lows and lower highs. Firm resistance is at 105.06.
EUR/JPY: Sharply Lower
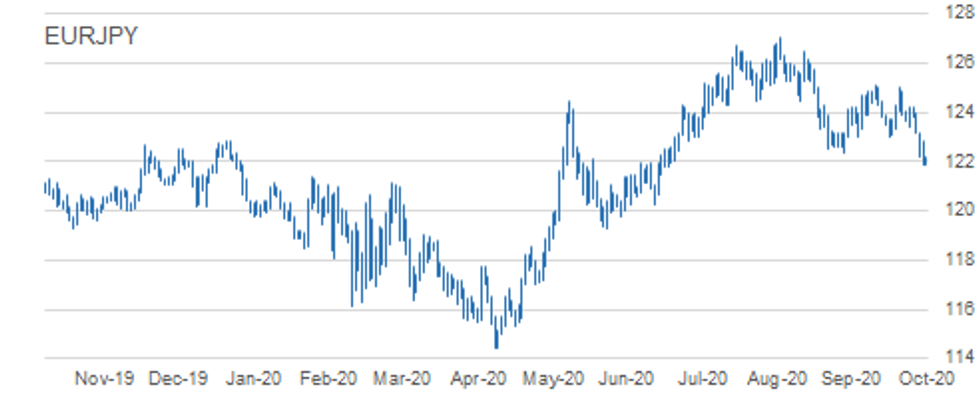
- RES 4: 124.23 High Oct 23 and 26
- RES 3: 123.84 20-day EMA
- RES 2: 123.19 High Oct 28
- RES 1: 122.38 Low Sep 28 and recent breakout level
- PRICE: 121.72 @ 06:14 GMT Oct 30
- SUP 1: 121.50 0.764 proj of Sep 1 - 28 decline from Oct 9 high
- SUP 2: 120.70 Low Jul 13
- SUP 3: 120.39 1.000 proj of Sep 1 - 28 decline from Oct 9 high
- SUP 4: 120.27 Low Oct 10
EURJPY maintains a bearish tone and has traded sharply lower overnight. This week has seen the cross clear support at 123.03/02 and 122.38, Sep 28 low. This move lower confirms a resumption of the downleg that started Sep 1. Scope is seen for weakness towards 121.50 next, a Fibonacci projection. Further out, 120.39 is on the radar, also a Fibonacci projection. Initial resistance is at 122.38.
AUD/USD: September Low Probed
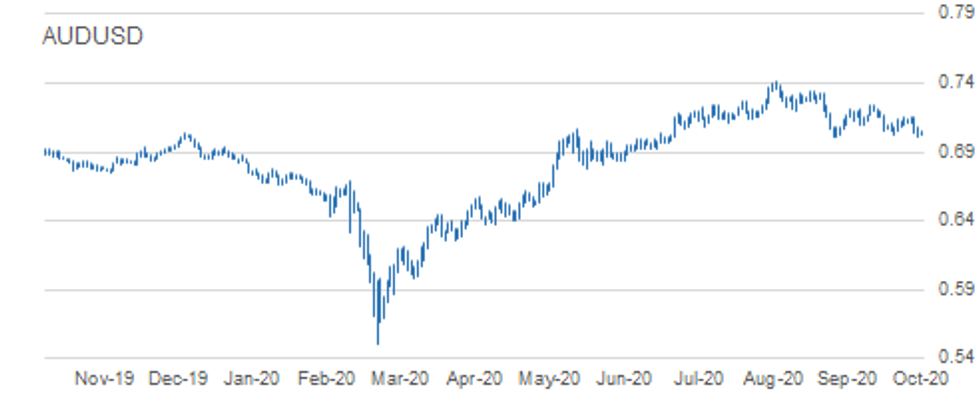
- RES 4: 0.7243 High Oct 10 and a key resistance
- RES 3: 0.7218 High Oct 13
- RES 2: 0.7144/58 Trendline drawn off the Sep 1 high / High Oct 23
- RES 1: 0.7076 High Oct 29
- PRICE: 0.7022 @ 06:23 GMT Oct 30
- SUP 1: 0.7002 Low Oct 29
- SUP 2: 0.6965 23.6% retracement of the Mar - Sep Rally
- SUP 3: 0.6948 2.0% 10-dma envelope
- SUP 4: 0.6921 Low Jul 14
AUDUSD outlook is bearish. The pair has pulled further away from trendline resistance drawn off the Sep 1 high. The trendline resistance rests at 0.7144 and represents a key hurdle for bulls. This line was tested Wednesday and capped gains. While the trendline holds, a bearish theme dominates which was strengthened Thursday following the print below 0.7006, Sep 25 low. This has opened 0.6965 next. A trendline breach reverses the trend.
USD/CAD: Rally Extends
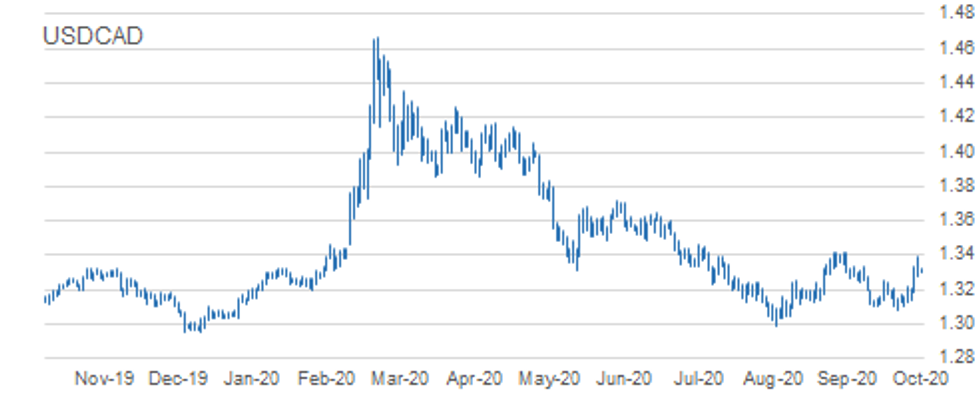
- RES 4: 1.3545 200-dma
- RES 3: 1.3460 2.0% 10-dma envelope
- RES 2: 1.3421 High Sep 30 and primary resistance
- RES 1: 1.3390 High Oct 29
- PRICE: 1.3340 @ 06:29 GMT Oct 30
- SUP 1: 1.3259 High Oct 15 and recent breakout level
- SUP 2: 1.3180 Low Oct 28
- SUP 3: 1.3109/3081 Low Oct 23 / Low Oct 21 and the bear trigger
- SUP 4: 1.3047 Low Sep 7
USDCAD gains extended further Thursday. This cemented the break of key short-term resistance at 1.3259, Oct 15 high as well as the break of 1.3341, Oct 7 high. The move higher signals scope for a climb towards 1.3421 next, Sep 30 and primary resistance. Initial firm support is seen at Wednesday's low of 1.3180. A break of this level is required to undermine the developing bullish tone. First support however lies at 1.3259.
MNI KEY LEVELS
EUR/USD: MNI Key Levels
- $1.1798/00 Oct28 high/200-hma
- $1.1786/91/93 50-dma/Cloud top/55-dma
- $1.1769 21-dma
- $1.1759/60/67 Oct29 high/Oct20 low/100-hma
- $1.1736 Fibo 38.2% 1.3993-1.0341
- $1.1718 Oct28 low
- $1.1691/95 Cloud base/Intraday high
- $1.1679 ***CURRENT MARKET PRICE 05:18BST FRIDAY***
- $1.1668/66 Intraday low/Lower 1.0% 10-dma env
- $1.1663/55/50 Lower Boll Band (2%)/100-dma/Oct29 low
- $1.1612/09 Sep25 low/Lower Boll Band (3%)
- $1.1581 Jul24 low
- $1.1548/41 Lower 2.0% 10-dma env/Jul23 low
- $1.1507 Jul22 low
- $1.1430/23 Lower 3.0% 10-dma env/Jul21 low
GBP: MNI Key Levels
- $1.3024/26 200-hma/Oct29 high
- $1.3011 55-dma*$1.2997/99 50-dma, Cloud top/100-hma
- $1.2980 21-dma
- $1.2960 Cloud base
- $1.2950 200-wma
- $1.2939/48 Intraday high/50-mma
- $1.2906 ***CURRENT MARKET PRICE 05:26BST FRIDAY***
- $1.2905 Intraday low
- $1.2881/75 Oct29 low/Lower 1.0% 10-dma env, 100-dma
- $1.2865/63 Oct16 low/Oct14 low
- $1.2846/40/38 Oct07 low/Lower Boll Band (2%)/Oct02 low
- $1.2820 Oct01 low
- $1.2806 Sep30 low
- $1.2781 Sep24 high
EUR/GBP: MNI Key Levels
- Gbp0.9149/52/57 Oct20 high/Upper 1.0% 10-dma env/Sep30 high
- Gbp0.9127/30/37 Cloud top/Upper Boll Band (2%)/Oct21 high
- Gbp0.9106/07 Oct26 high/Oct23 high
- Gbp0.9079/85 Cloud base/Oct27 high
- Gbp0.9067/69/76 21-dma/50-dma/Oct28 high
- Gbp0.9059/61/65 Oct29 high/200-hma/55-dma
- Gbp0.9049/52/58 Intraday high/100-hma, 100-dma/10-dma
- Gbp0.9049 ***CURRENT MARKET PRICE 05:30BST FRIDAY***
- Gbp0.9023 Intraday low
- Gbp0.9007/06 Oct29 low, Oct14 low/Lower Boll Band (2%)
- Gbp0.8975/70 Lower Boll Band (3%)/Lower 1.0% 10-dma env
- Gbp0.8967 Sep08 low
- Gbp0.8925 Sep07 low
- Gbp0.8905/00 200-dma/Sep04 low
- Gbp0.8880/66 Lower 2.0% 10-dma env/Sep03 low
USD/JPY: MNI Key Levels
- Y105.17 21-dma
- Y105.07 Cloud Kijun Sen
- Y105.06 Oct26 high
- Y104.89 Cloud Tenkan Sen, Oct27 high
- Y104.74 200-hma
- Y104.73 Oct29 high
- Y104.54/63 100-hma/Intraday high
- Y104.19 ***CURRENT MARKET PRICE 05:41BST FRIDAY***
- Y104.17/05 Intraday low/Lower Boll Band (2%)
- Y104.03 Oct29 low
- Y104.00 YTD low
- Y103.93 200-mma
- Y103.70 Lower 1.0% 10-dma envelope
- Y103.50 Lower Bollinger Band (3%)
- Y103.09 Mar12 low
EUR/JPY: MNI Key Levels
- Y123.19 Oct28 high
- Y123.01 100-hma
- Y122.88 Oct29 high
- Y122.19 Lower 1.0% 10-dma envelope
- Y122.16 Intraday high
- Y122.03 Lower Bollinger Band (2%)
- Y121.77 100-wma
- Y121.65 ***CURRENT MARKET PRICE 05:48BST FRIDAY***
- Y121.62 Intraday low
- Y121.47 Jul14 low
- Y121.16 200-dma
- Y121.15/14 Lower Bollinger Band (3%)/76.4% 119.31-127.08
- Y120.96 Lower 2.0% 10-dma envelope
- Y120.70 Jul13 low
- Y120.27 Jul10 low
AUD/USD: MNI Key Levels
- $0.7186/87/89 50-dma/55-dma/Cloud base
- $0.7170 Oct15 high
- $0.7156/57/58 Upper 1.0% 10-dma env/Oct28 high/Oct23 high
- $0.7114/21 100-dma/21-dma
- $0.7094 200-hma
- $0.7076/91 Oct29 high/100-hma
- $0.7056 Intraday high
- $0.7026 ***CURRENT MARKET PRICE 05:57BST FRIDAY***
- $0.7022/14 Intraday low/Lower 1.0% 10-dma env
- $0.7002 Oct29 low, Lower Boll Band (2%)
- $0.6973/63 Jul20 low/Jul16 low
- $0.6944/43 Lower Boll Band (3%)/Lower 2.0% 10-dma env
- $0.6921 Jul14 low
- $0.6893 100-wma
- $0.6877/72 Jul01 low/Lower 3.0% 10-dma env
USD/CAD: MNI Key Levels
- C$1.3537/45 Jul21 high/200-dma
- C$1.3474/83 Upper 2.0% 10-dma env/Jul22 high
- C$1.3451/60 Aug03 high/Jul30 high
- C$1.3419/21/27 Sep29 high/Aug04 high, Sep30 high/Upper Boll Band (3%)
- C$1.3377/90 100-wma/Oct29 high
- C$1.3342/52 Upper 1.0% 10-dma env/Upper Boll Band (2%)
- C$1.3331/37 100-dma/Intraday high
- C$1.3329 ***CURRENT MARKET PRICE 06:01BST FRIDAY***
- C$1.3307/95 Cloud top/Intraday low
- C$1.3278 Oct29 low
- C$1.3246/40 100-hma/Cloud base
- C$1.3208/07/06 21-dma/50-dma/55-dma
- C$1.3193/83/80 200-hma/50-mma/Oct28 low
- C$1.3161 200-wma
- C$1.3142 Oct27 low
OPTIONS: Expiries for Oct30 NY cut 1000ET (Source DTCC)
- EUR/USD: $1.1700(E830mln), $1.1750-54(E1.5bln), $1.1800(E2.2bln), $1.1850(E1.7bln), $1.1870-75(E573mln), $1.1925(E571mln), $1.1950(E1.7bln-EUR calls), $1.2000(E1.3bln)
- USD/JPY: Y103.00($915mln), Y104.00($1.4bln), Y104.50($2.6bln), Y104.80-85($1.9bln), Y104.95-105.00($1.2bln), Y106.00-05($2.2bln), Y106.50($760mln)
- GBP/USD: $1.3100-10(Gbp543mln)
- EUR/JPY: Y123.50-55(E562mln), Y124.50(E497mln)
- USD/NOK: Nok9.80($500mln), Nok10.00($1.54bln)
- EUR/NOK: Nok10.75-76(E638mln), Nok10.77(E790mln), Nok10.80(E585mln), Nok10.90(E525mln)
- AUD/USD: $0.7180-85(A$783mln), $0.7200(A$632mln)
- AUD/JPY: Y76.75(A$602mln), Y77.45(A$1.2bln)
- AUD/NZD: N$1.0695-00(A$752mln), N$1.0750(A$1.2bln)
- USD/CAD: C$1.3025($1.1bln), C$1.3150($1.3bln), C$1.3225-30($626mln)
- USD/CNY: Cny6.63($883mln), Cny6.65($640mln), Cny6.67($500mln), Cny6.70($532mln), Cny6.72($860mln), Cny6.74($500mln)
Larger Option Pipeline
- EUR/USD: Nov03 $1.1900-05(E1.4bln); Nov06 $1.1600(E1.0bln)
- USD/JPY: Nov03 Y105.45-49($1.3bln); Nov04 Y105.00($1.1bln); Nov05 Y106.06-09($1.6bln)
- EUR/JPY: Nov05 Y124.50(E1.1bln)
- GBP/USD: Nov02 $1.3100(Gbp1.2bln), $1.3150(Gbp911mln)
- EUR/GBP: Nov02 Gbp0.8900(E2.1bln-EUR puts), Gbp0.9000(E1.4bln)
- AUD/USD: Nov02 $0.7140-45(A$1.9bln)
- USD/CNY: Nov03 Cny6.5334($1.2bln); Nov05 Cny6.75($1.0bln), Cny6.80($1.9bln), Cny6.85($1.3bln);
Nov06 Cny6.70($1.2bln)
Why MNI
MNI is the leading provider
of intelligence and analysis on the Global Fixed Income, Foreign Exchange and Energy markets. We use an innovative combination of real-time analysis, deep fundamental research and journalism to provide unique and actionable insights for traders and investors. Our "All signal, no noise" approach drives an intelligence service that is succinct and timely, which is highly regarded by our time constrained client base.Our Head Office is in London with offices in Chicago, Washington and Beijing, as well as an on the ground presence in other major financial centres across the world.