
- The BoJ was unchanged as expected, with the central bank noting high uncertainties facing the outlook, but stating the wage/price cycle is strengthening. In Tokyo afternoon trading, JGB futures are weaker and near session lows, -18 compared to the settlement levels. Yen is softer but within recent ranges.
- The USD is a touch higher against the other majors, with US cash Tsy bonds slightly cheaper. Regional equities are mixed. Indonesian markets are firmer after yesterday's sharp sell-off.
- Later the Fed’s decision is announced and includes updated projections and Chair Powell’s press conference. No change in rates is widely expected (see MNI Fed Preview). The ECB’s de Guindos and Elderson speak later and February euro area CPI data print.

MARKETS
In today's Asia-Pac session, TYM5 is 110-22+, -0-03 from closing levels.
- Yesterday, TYM5 traded 110-14 low/110-29 high, still inside initial technical levels according to MNI’s technicals team: resistance above at 111-25 (Mar 11 high), support below at 110-12.5/110-00 (Low Mar 6 & 13 / High Feb 7).
- Cash US tsys are flat to 1bp cheaper, with a steepening bias, in today’s Asia-Pac session.
- The focus remains on Wednesday's FOMC policy announcement. The majority of analysts expects the FOMC to leave its Dot Plot funds rate medians unchanged in March compared with the December meeting. That would imply the Fed is still pencilling in 50bp of cuts in 2025 (to 3.9%) and 2026 (to 3.4%), with a further 25bp cut in 2027 (to 3.1%).
- Yesterday, projected rate cuts through mid-2025 closed steady to softer vs. yesterday morning’s levels (*) as follows: Mar'25 steady at -2bp, May'25 at -5.4bp ( -6bp), Jun'25 at -18.2bp (-19.7bp), Jul'25 at -26.7bp (-28.7bp).
JGBS: No Change Decision By BoJ As Expected, Holiday Tomorrow
In Tokyo afternoon trading, JGB futures are weaker and near session lows, -18 compared to the settlement levels, after the BoJ Policy Decision announcement.
- The BoJ left rates unchanged at 0.50%, as widely expected by sell-side economists and financial market pricing. The decision was unanimous, with a 9-0 vote.
- The BoJ left the door clearly ajar for further policy adjustments. It stated that price trends are likely to move in line with its 2% goal in the second half. In particular, the central bank noted that the virtuous cycle of wages and prices was intensifying. This in turn should keep output above potential.
- Still, it noted high uncertainties in terms of the outlook for economic activity and prices.
- Cash US tsys are ~1bp cheaper in today’s Asia-Pac session ahead of today’s FOMC policy decision. The majority of analysts expect the FOMC to leave its Dot Plot funds rate medians unchanged in March compared with the December meeting.
- Cash JGBs are flat to 2bps cheaper across benchmarks. The benchmark 10-year yield is 1.0bp higher at 1.517% versus the cycle high of 1.58%.
- Swap rates are 1-2bps higher. Swap spreads are wider.
- Tomorrow, the local calendar will be closed for the Vernal Equinox Day holiday.
JAPAN DATA: Export Growth Improves Ahead Of Tariffs, Trade Position In Surplus
Japan Feb trade figures saw a firmer export backdrop, albeit not as strong as market forecasts. We rose 11.4%y/y (forecast was 12.6%, the prior 7.3%). Imports were slightly below expectations as well, printing -0.7%y/y (+0.8% forecast, while the prior was +16.2%). The trade surplus was slightly below expectations, we printed ¥584.5bn, versus ¥688.3bn expected, but still a step up from the prior -¥2736.6bn outcome. The seasonally adjusted trade surplus was ¥182.3bn, which was also below forecasts but improved on the Jan print.
- The firmer export backdrop is welcomed, but much uncertainty rests with the outlook as we progress through Q2. Steel and aluminium tariffs have already been implemented by the US, while the US Administration is also planning to go ahead with reciprocal tariffs from the start of April.
- By country/region, exports rose 10.5%y/y to the US, +14.1%y/y to China, but fell 7.7%y/y to the EU. In volume terms, exports were still down y/y in aggregate but positive to Asia and China.
- The trade surplus was the highest since 2021 in both unadjusted and seasonally adjusted terms. The trend has been volatile in recent months on the trade position, but the improving trend looks to be in place.
- The chart below plots the trade balance (seasonally adjusted) against Citi's terms of trade proxy for Japan. Sustained trade surpluses will be a yen positive, all else equal.
Fig 1: Japan Trade Balance & Citi Japan ToT Proxy

Source: MNI - Market News/Bloomberg
JAPAN DATA: Core Machine Orders Below Forecast, Off Late 2024 Highs
Japan Jan core machine orders were below forecasts. In m/m terms we fell -3.5%, versus a -0.1% forecast and prior was -0.8% for Dec. In y/y terms, we were still up 4.4%, but sub the 6.6% market consensus. This was little changed from the Dec read of 4.3%.
- The chart below plots the core machine orders (the white line), against Japan CAPEX (ex software). Capex came off the boil in Q4 of last year. The early Jan trend for core machine orders doesn't suggest Q1 has seen a dramatic turnaround.
- For manufacturing and non-manufacturing orders y/y outcomes are still positive but sub late 2024 highs.
- The next focus point from a capex standpoint is likely to be the Tankan survey, which for Q1 will print on April 1.
Fig 1: Japan Core Machine Orders (white Line) & Japan Capex (Orange Line) Y/Y

Source: MNI - Market News/Bloomberg
AUSSIE BONDS: Subdued Session Ahead Of FOMC Decision & Jobs Data
ACGBs (YM -1.0 & XM -1.5) are slightly weaker, with dealings muted ahead of the FOMC decision (tomorrow morning local time) and the February Employment Report.
- Cash US tsys are ~1bp cheaper in today’s Asia-Pac session.
- Cash ACGBs are 1-2bps cheaper with the AU-US 10-year yield differential at +12bps.
- Swap rates are flat to 1bp higher.
- The bills strip is -1 to -2.
- RBA-dated OIS pricing is flat to 4bps firmer across meetings today, with Dec-25 leading. A 25bp rate cut in April is given a 4% probability, with a cumulative 62bps of easing priced by year-end (based on an effective cash rate of 4.09%).
- Tomorrow, the local calendar will see February jobs data. It will be scrutinised closely, especially as the RBA said that the tight labour market was the strongest argument to leave policy on hold in February.
- It is also a key reason why “the Board remains cautious on prospects for further policy easing”, as the labour market “tightened a little further in late 2024” and could be signalling the economy is stronger than assumed. The RBA is also focused on the underemployment & youth unemployment rates and changes in hours worked.
AUSTRALIA DATA: Gradual Growth Recovery, Trade Uncertainty A Risk
The Westpac leading index for February rose 0.07% m/m after 0.1% bringing the 6-month annualised rate to 0.8% from 0.6%, the highest in almost two years. The 6-month rate leads detrended growth by 3 to 9 months, thus it is signalling that at this point growth should gradually improve over the year consistent with RBA expectations.
- Westpac is forecasting GDP growth to rise slowly over 2025 to 2.2% y/y in Q4 after 1.3% in Q4 2024. It also expects the RBA to be on hold in April but a further moderation in inflation (Q1 CPI out on 30 April) will allow it to cut again on May 20.
- February’s 6-month increase was driven by the strong improvement in Westpac consumer confidence and the unemployment expectations component. The yield spread made the largest positive contribution. All components were positive except the ASX and aggregate hours worked, which were slightly negative.
- Westpac notes that just over a third of the improvement in the 6-month rate since August was due to AUD commodity prices and much of that was due to the depreciation in the Aussie dollar.
- The sell-off in the ASX, largely due to uncertainty around US trade policy, weighed on the index in February and is likely to do the same in March. Westpac believes that with more tariffs likely, reciprocal measures are due April 2, they are “likely to become a more significant dampener on the growth pulse in Australia”.
Australia Westpac leading index vs GDP % 
- Source: MNI - Market News/Refinitiv
AUSTRALIA: Unemployment Rate Could Fall Driven By Post-Holiday Job Starters
- February jobs data are released on Thursday and will be again be scrutinised, especially as the RBA said that the tight labour market was the strongest argument to leave policy on hold in February. It is also a key reason why “the Board remains cautious on prospects for further policy easing”, as the labour market “tightened a little further in late 2024” and could be signalling the economy is stronger than assumed. The RBA is also focussed on the underemployment & youth unemployment rates and change in hours worked.
- Employment has consistently printed stronger than expected with January up 44k and 2024 seeing 72k more jobs than 2023 despite restrictive monetary policy.
- Bloomberg consensus is forecasting a 30k rise in employment in February with projections ranging from +15k to +60k with most estimates between +25k and +40k. CBA and Westpac expectations are in line with consensus, while ANZ and NAB are higher at 35k and 45k respectively.
- The 3-month average employment to January was 44.4k and 6-month 41.5k, thus a consensus print would be below the recent trend.
- The unemployment rate is forecast to be stable at 4.1%. Forecasts are between 4.0% and 4.2% with more forecasts for it to fall than to rise at 10 vs 3. January showed an elevated number of people without a job but having one to start in February, which could weigh on February’s unemployment rate. CBA is in line with consensus, whereas ANZ, NAB and Westpac expect it to fall 0.1pp to 4.0%.
- The participation rate is projected to be steady at the record 67.3% (forecast range 67.2-67.4%).
Australia Westpac leading index vs GDP %
BONDS: NZGBS: Closed On A Strong Note Ahead Of FOMC Policy Decision
NZGBs closed on a strong note, with benchmark yields 3-4bps lower.
- Outside of the previously outlined current account deficit and consumer confidence data, there hasn't been much by way of domestic drivers to flag.
- The NZGB 10-year has outperformed its $-bloc counterparts, with the NZ-US and NZ-AU yield differentials 4-5bps wider.
- Cash US tsys are ~1bp cheaper in today’s Asia-Pac session ahead of the FOMC policy decision tomorrow morning local time.
- Swap rates closed 3-5bps lower, with the 2s10s curve steeper.
- RBNZ dated OIS pricing closed flat to 4bps softer, with February 2026 leading. 24bps of easing is priced for April, with a cumulative 64 bps by November 2025.
- Tomorrow, the local calendar will see Q4 GDP alongside the NZ Treasury’s planned sale of NZ$250mn of the 4.50% May-30 bond, NZ$200mn of the 4.25% May-36 bond and NZ$50mn of the 5.0% May-54 bond.
- The RBNZ will start the repurchase program of the Sep-25 inflation-indexed bond on March 21. The operation has no implications for monetary policy stance.
NEW ZEALAND: Global Factors & Persistent Inflation Pressures Weigh On Sentiment
Q1 Westpac consumer confidence fell to 89.2 from 97.5, the weakest since Q2 2024 which is before the RBNZ began easing. The data can be volatile though and the Q4/Q1 average is pointing to some improvement in consumption growth. Q4 real retail sales rose 0.9% q/q to be up 0.3% y/y after contracting the previous eight quarters. A spending recovery is still likely to remain lacklustre and 25bp cuts are probable for the April and May meetings.
- The Q1 softness was due to both the present and expected conditions indices. Present fell almost 9 points to 80.2, still higher than Q3, while expected 8 points to 95.2, the lowest since Q1 2024.
- Expected conditions were likely impacted by the steady negative news around the trade outlook from the shift in US policy. The US is NZ’s second largest export destination, while China is the largest. The US has imposed 20% tariffs on imports from China, which could indirectly impact NZ. Westpac notes that the associated market volatility with the announcements could also have pressured consumer confidence.
- Westpac notes that people continue to cite ongoing cost-of-living pressures as a major concern and this likely weighed on sentiment despite H2 2024 inflation being at its lowest since Q1 2021. Prices of food and council rates continue to rise materially.
- Westpac says that 27% of households they spoke to said they had cut back on “activities like dining out or in bars over the past year”. The “good time to purchase a major item for the home” index also fell.
- Card transaction data show spending is recovering but at a slow rate and data will be monitored to see if greater pessimism will weigh on it.
NZ consumption vs Westpac consumer confidence

NEW ZEALAND: Strong Export Growth Drives Narrower Deficits
The Q4 current account deficit was slightly wider than expected at $7.037bn but significantly narrower than Q3’s $10.84bn. As a share of GDP it fell 0.3pp to 6.2% YTD, the lowest in three years and down 0.7pp from 2023. There was strong growth in both goods and services exports with the total up 5.4% q/q and 10.4% y/y. Imports were not as robust but still rose 2.9% q/q.
NZ current account to GDP % YTD
- Merchandise exports rose 3.8% q/q to be up 9.0% y/y in Q4 after 4.4% y/y, driven by dairy and meat. Services jumped 9% q/q to be up 13.4% y/y due to increased spending by overseas tourists while in NZ.
- Statistics NZ observed that travel exports were higher than Q4 2019 for the first time. Visitor numbers are still below pre-pandemic levels but spending is now stronger.
- Goods imports increased 3% q/q to be up 2.1% y/y after -2.4% y/y, while services rose 2.8% q/q to be up 8.7% y/y following 7.1% y/y.
- This resulted in the trade deficit narrowing $0.55bn to $1.71bn, the smallest since Q2 2021.
- There was a net outflow of $3.2bn from the financial account in Q4. As the deficit is expected to be financed by net inflows, Statistics NZ notes that the contradictions in the accounts show the difficulty in measuring investment transactions.
NZ exports vs imports y/y%

NEW ZEALAND: Economy Forecast To Have Developed As RBNZ Expected In Q4
Q4 GDP prints on Thursday and Bloomberg consensus is forecasting the production-based measure to rise 0.4% q/q but still be down 1.4% y/y after falling 1.0% q/q & 1.5% y/y the previous quarter. The RBNZ’s February projection is slightly lower at 0.3% q/q but the annual rate is in line with consensus. With the economy developing broadly in line as it expects, it is likely to cut rates 25bp at each of the April and May meetings.
- Forecasts are in a wide range between +0.2% q/q and +1.3% q/q but most are around 0.3-0.5% q/q.
- ANZ is in line with consensus and ASB & Kiwibank with the RBNZ. BNZ is less optimistic forecasting a rise of 0.2% q/q resulting in an annual decline of 1.5%. Westpac is more optimistic projecting a 0.5% q/q increase and a 1.3% y/y fall, but this is due to seasonal adjustment and its other calculations imply that there was no sectoral growth in Q4.
- Expenditure-based GDP fell 0.8% q/q and 1.1% y/y in Q3 and the RBNZ expects it to rise only 0.2% q/q in Q4 to be down 0.9% y/y.
- Q4 data showed a solid rise in manufacturing volumes (+1.1% q/q) and real retail sales (+0.9% q/q). Building volumes were very weak contracting 4.4% q/q as the construction sector continues to struggle. There could be a positive contribution from net exports though as export volumes rose 1.3% q/q and imports fell 1.7% q/q.
FOREX: USD Index Edges Up, Yen Steady Post BOJ, FOMC Later
The USD BBDXY index sits slightly higher in the first part of Wednesday dealings, last near 1263.1. We are still close to recent multi-month lows at 1261.15. Today's gain is around 0.10% at this stage.
- Today's main focus has been the BOJ decision, but as widely expected, the central bank left rates on hold at 0.50%. The statement appeared balanced, in that the door was left firmly ajar for further hikes (virtuous wage and price cycle was described as intensifying), but significant uncertainty around the economic outlook was also highlighted (particularly from a trade standpoint). We have Ueda's press conference in just under 2 hours.
- USD/JPY was last near 149.55, slightly up on end Tuesday levels, with ranges of 149.20/64 so far. We had earlier data on trade and machine orders. The trade position moved back into surplus, while machine orders were weaker than forecast. Sentiment in the FX space didn't shift though. broadly USD/JPY is wedged between key support and resistance levels.
- NZD/USD has ticked down, back to 0.5810, off close to 0.20%. Q1 Westpac consumer confidence fell to 89.2 from 97.5, the weakest since Q2 2024 which is before the RBNZ began easing. The Q4 current account deficit was slightly wider than expected at $7.037bn but significantly narrower than Q3’s $10.84bn. Note tomorrow we get Q4 GDP. Upside focus for the currency is at 0.5860, the 200-day EMA. The 100-day at 0.5765 may act as downside support.
- AUD/USD has also edged down a touch, last near 0.6355/60. The currency remains sub key resistance at 0.6409, the Feb 21 high and bull trigger.
- In the cross asset space, US equity futures are slightly higher, but away from best levels. US Tsy yields have ticked up, the 10yr back to 4.295%, up a little over 1bps.
- Later the Fed’s decision is announced and includes updated projections and Chair Powell’s press conference. No change in rates is widely expected. The ECB’s de Guindos and Elderson speak later and February euro area CPI data print.
ASIA STOCKS: A Mixed Day as Indonesia Bounces Back.
Following a disastrous day for the Jakarta Composite yesterday, attempts by authorities to stabilize things appear to be working as it posts some solid gains whilst bourses around the region are mixed.
- Yesterday in Indonesia the Jakarta Composite fell by -6.8% at one stage, sufficient to see a trading halt before recovering to finish just -3.8% down. The intervention, along with intervention in the currency markets has calmed investors and the index is up by +1.00% today.
- China’s bourses are mixed with the Hang Seng holding on to slender gains up +0.15%, the CSI 300 +0.05 whilst the Shanghai Comp fell -0.06% and Shenzhen is down -0.20%.
- The KOSPI was one of the other strong performers today up +0.78%, following and on track to deliver three successive days of gains.
- Malaysia’s FTSE Malay KLCI fell by -0.64% today, having enjoyed three straight days of gains.
- Singapore’s FTSE Straits Times is up +0.50%, the Philippines +0.20% whilst Taiwan is the worst performer in the region, down by -1.11%.
- As India’s NIFTY 50 starts it’s trading day up marginally, it follows on from yesterday’s very strong performance gaining +1.45%
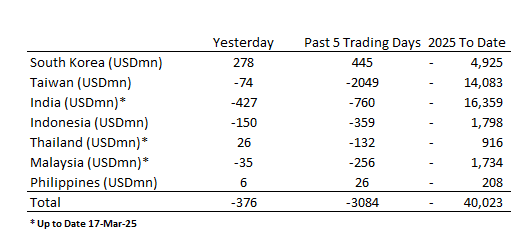
ASIA STOCKS: Korean Inflows Continue.
South Korea recorded a third successive day of inflows as outflows dominated elsewhere.
- South Korea: Recorded inflows of +$278m yesterday, bringing the 5-day total to +$445m. 2025 to date flows are -$4,925m. The 5-day average is +$89m, the 20-day average is -$172m and the 100-day average of -$113m.
- Taiwan: Had outflows of -$74m yesterday, with total outflows of -$2,049 m over the past 5 days. YTD flows are negative at -$14,083m. The 5-day average is -$410m, the 20-day average of -$590m and the 100-day average of -$208m.
- India: Saw outflows of -$427m as of the 17th, with a total outflow of -$760m over the previous 5 days. YTD outflows stand at -$16,359m. The 5-day average is -$152m, the 20-day average of -$288m and the 100-day average of -$197m.
- Indonesia: Posted outflows of -$150m yesterday, bringing the 5-day total to -$359m. YTD flows are negative at -$1,798m. The 5-day average is -$72m, the 20-day average is -$62m the 100-day average of -$35m.
- Thailand: Recorded inflows of +$26m yesterday, totaling -$132m over the past 5 days. YTD flows are negative at -$916m. The 5-day average is -$26m, the 20-day average of -$38m the 100-day average of -$19m.
- Malaysia: Experienced outflows of -$35m as of 17th, contributing to a 5-day outflow of -$256m. YTD flows stand at -$1,734m. The 5-day average is -$51m, the 20-day average of -$45m the 100-day average of -$33m.
- Philippines: Saw inflows of +$6m yesterday, with net inflows of +$26m over the past 5 days. YTD flows are negative at -$208m. The 5-day average is +$5m, the 20-day average of -$3m the 100-day average of -$7m.
OIL: Crude Slightly Lower Ahead Of The Fed & EIA Inventory Data
Oil prices are moderately lower during APAC trading today after falling around a percent on Tuesday. It has been pressured by softer risk appetite and US industry data pointing to another crude stock build. Hopes of a Ukraine peace deal have also pressured prices, but with Russia’s president Putin only agreeing to a partial ceasefire, an end to the war and sanctions is likely some way off.
- WTI is down 0.4% to $66.64/bbl off the intraday low of $66.58. Brent is 0.3% lower at $70.36/bbl following a trough of $70.22. The USD index is up 0.1%.
- Moves today have been muted as markets wait for the Fed decision. The impact of increased protectionism on global growth has been worrying crude and a hawkish or very concerned Fed would add to that.
- Geopolitical risks persist with not just the Russian/Ukraine situation but rising tensions in the Middle East with the end of the Gaza ceasefire and the US targeting rebel Houthis in Yemen and saying it will blame Iran if any Red Sea shipping is attacked. It has also said it will tighten sanctions on Tehran.
- Bloomberg reported that there was a US crude inventory build of 4.59mn barrels last week, according to people familiar with the API data. However, there was a product stock drawdown of 1.71mn barrels for gasoline and 2.15mn for distillate. The official EIA data is out today.
- Later the Fed’s decision is announced and includes updated projections and Chair Powell’s press conference. No change in rates is widely expected (see MNI Fed Preview).
- The ECB’s de Guindos and Elderson speak later and February euro area CPI data print.
Gold Consolidates with Eye on Middle East.
- Israel launched attacks at Hamas officials overnight ending a tenuous cease fire with a vow from the Israeli PM to “act with increasing military strength.”
- The insatiable demand for gold had seen the precious metal break through the US$3,000 barrier this week and the overnight news spurred it even higher.
- As key global investments banks and asset managers around the world race to increase their forecasts for gold’s peak this year the risk could be that the price gets there sooner rather than later.
- Gold opened the trading day at $3,034.63 selling off initially down to $3,027.48 before rallying up to $3,030.01.
- It then gave back some of those gains to settle at $3,036.17
- Gold is up +1.75% this week already, following on from last week’s strongest weekly rally of the year.
- Up over 16% year to date, the range on forecasters predictions currently are from $3,200 to $3,500.
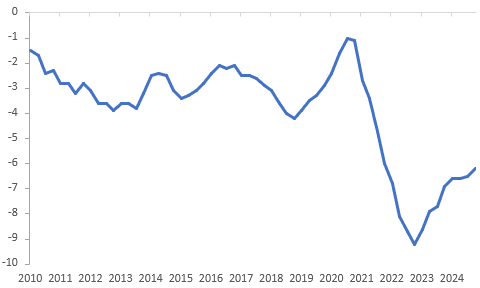
INDONESIA: The Jakarta Composite Fall in Recent Context.
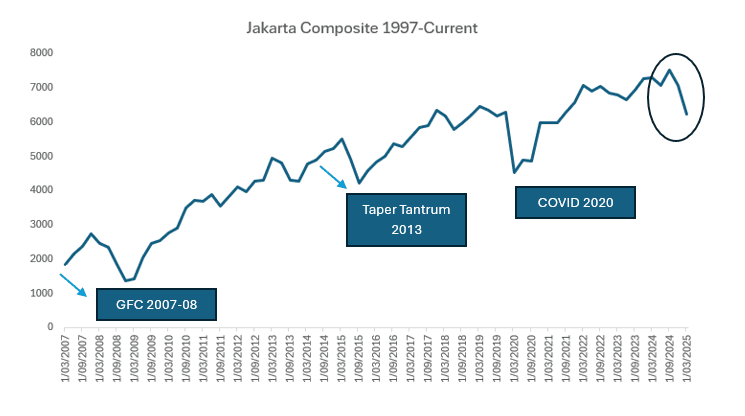
- GFC 2008 : the financial crisis of 2008 hit emerging economies hard as developed markets were faced with a crisis in the global financial sector. The Jakarta composite was not immune falling from its peak in December 2007 through to its trough in December 2008 by just over -50%.
In 2008 the Indonesian Rupiah depreciated c. 39%
- Taper Tantrum 2013: when Ben Bernanke (the then chairman of the Federal Reserve) hinted that they may taper the bond buying program, financial markets reacted negatively at the prospect which led to a surge in global volatility, causing investors to pull capital from these markets, leading to currency depreciation and rising yields. From the Fed’s May meeting when the language was introduced to the lows in August, the Jakarta Composite declined -23%. We also saw meaningful weakness in 2015 for local equities, in the lead up to the first Fed hike.
In 2013 the Indonesian Rupiah depreciated c. 26%.
- COVID Shutdown 2020: the world went into shutdown as a virus spread globally with many countries shutting their borders, decimating supply chains and seriously hurting export orientated economies. From it’s pre-COVID peak in January 2020, to the lows in March the Jakarta Composite fell -37%.
In 2020 the Indonesian Rupiah depreciated c. 22%
When President Trump was elected to the White House last year, he was done so on the mantra of protectionism underscored by tariffs. This has been a primary driver in the global economy since and as with any period of volatility, the USD strengthens. Since the US election the Indonesian Rupiah has depreciated c. 9%.
- Yesterday the Jakarta Composite finished -3.8% down, having been down by -6.8% earlier leading to a halt in market trading. However this is not a one off event. The Jakarta composite has been in a bearish trend since September, with a peak to trough decline in the Index of -21%.
The move in the Jakarta Composite (when compared to recent volatile periods) is not insignificant and is due to a range of factors including the looming trade war and Indonesia’s reliance on China trade. There are also fiscal concerns, with a recent delay in the budget data.
The well regarded finance minister Sri Indrawati came out yesterday and dispelled rumours of her resignation. Ms Indrawati is well regarded by global markets as a former Managing Director of the Word Bank.
This all comes as Bank Indonesia meets today to decide whether to move on interest rates. A cut could shake markets into thinking there is a broader, darker underlying theme yet equally a no change decision could be seen as not doing enough (see MNI BI Preview Here).
With very little key economic data out for the rest of the month it will ultimately fall on Bank Indonesia and its FX reserves as the likely source to calm markets in an economy otherwise forecast to grow 5.0% in 2025.
ASIA FX: USD/IDR Spot Above 16500, BI Intervening, NEA FX Softer
USD/Asia pairs are mixed in the first part of Wednesday trade, but most pairs are seeing a slightly firmer USD bias. In North East Asia, CNH, KRW and TWD are all weaker. In SEA, IDR has fallen sharply, but this spot move largely reflects catch up with the NDF weakness seen through Tuesday. PHP and MYR are outperforming somewhat.
- USD/CNH has drifted higher, support at the simple 200-day MA still holding (near 7.2210). We were last around 7.2375/80. The CNY fixing maintained recent ranges, while the onshore equity backdrop has slowed in terms of upside momentum. Markets may be waiting to see the impact or extent of consumption stimulus plans.
- Spot USD/KRW has also firmed, the pair last around 1453. This keeps us within recent ranges though. Onshore equities are higher for the Kospi, but lower for the Kosdaq. The onshore policy focus remains on curbing aggressive house price rises. Spot USD/TWD was little changed, holding above 33.00 in latest dealings.
- Spot USD/IDR rose above 16500 at the open, but further upside has been limited. BI has stated it is conducting bold intervention to maintain rupiah supply and demand. There may be some sensitivity given multi year highs above 16600 aren't too far away. Onshore equities have rebounded somewhat, the JCI up around 1% at this stage. A lawmaker stated military personnel will not occupy positions in state companies.
- USD/PHP is slightly lower, last in the 57.20/25 region, with the Peso continuing its recent outperformance trend. The Finance Chief is very bullish on this year's growth prospects, while local equities have drawn inflows from offshore so far this month (bucking the broader outflow trend seen in the region).
- USD/THB up a little, last near 33.60/65, but remains within recent ranges. The BOT minutes showed that focus is shifting to growth, following the recent 25bps cut.
- USD/MYR is back to the low 4.4300 region, as onshore markets returned today. Recent lows close to 4.4000 remain intact.
UP TODAY (TIMES GMT/LOCAL)
| Date | GMT/Local | Impact | Country | Event |
| 19/03/2025 | 0430/1330 | ** | Industrial Production | |
| 19/03/2025 | 1000/1100 | *** | HICP (f) | |
| 19/03/2025 | 1100/0700 | ** | MBA Weekly Applications Index | |
| 19/03/2025 | 1200/1300 | ECB de Guindos In Madrid | ||
| 19/03/2025 | 1300/1400 | ECB Elderson At European Financials Conference | ||
| 19/03/2025 | 1430/1030 | ** | DOE Weekly Crude Oil Stocks | |
| 19/03/2025 | 1800/1400 | *** | FOMC Statement | |
| 19/03/2025 | 2000/1600 | ** | TICS | |
| 20/03/2025 | 2145/1045 | *** | GDP | |
| 20/03/2025 | - | Swiss National Bank Meeting | ||
| 20/03/2025 | 0030/1130 | *** | Labor Force Survey | |
| 20/03/2025 | 0700/0700 | *** | Labour Market Survey | |
| 20/03/2025 | 0700/0800 | ** | PPI | |
| 20/03/2025 | 0800/0900 | ECB's Lagarde At ECON Hearing | ||
| 20/03/2025 | 0830/0930 | *** | SNB PolicyRate | |
| 20/03/2025 | 0830/0930 | *** | Riksbank Interest Rate Decison | |
| 20/03/2025 | 0830/0930 | *** | SNB Interest Rate Decision | |
| 20/03/2025 | 0900/1000 | Q1 Regional Network Survey | ||
| 20/03/2025 | 1000/1100 | ** | Construction Production | |
| 20/03/2025 | 1100/1100 | ** | CBI Industrial Trends | |
| 20/03/2025 | 1200/1200 | *** | Bank Of England Interest Rate | |
| 20/03/2025 | 1200/1200 | *** | Bank Of England Interest Rate | |
| 20/03/2025 | 1200/1300 | ECB's Lane At UCC Economics Society's Conference | ||
| 20/03/2025 | 1200/1200 | Agents summary of business conditions | ||
| 20/03/2025 | 1230/0830 | * | Industrial Product and Raw Material Price Index | |
| 20/03/2025 | 1230/0830 | *** | Jobless Claims | |
| 20/03/2025 | 1230/0830 | ** | WASDE Weekly Import/Export | |
| 20/03/2025 | 1230/0830 | ** | Philadelphia Fed Manufacturing Index | |
| 20/03/2025 | 1230/0830 | * | Current Account Balance |