
Why MNI
MNI is the leading provider
of intelligence and analysis on the Global Fixed Income, Foreign Exchange and Energy markets. We use an innovative combination of real-time analysis, deep fundamental research and journalism to provide unique and actionable insights for traders and investors. Our "All signal, no noise" approach drives an intelligence service that is succinct and timely, which is highly regarded by our time constrained client base.Our Head Office is in London with offices in Chicago, Washington and Beijing, as well as an on the ground presence in other major financial centres across the world.
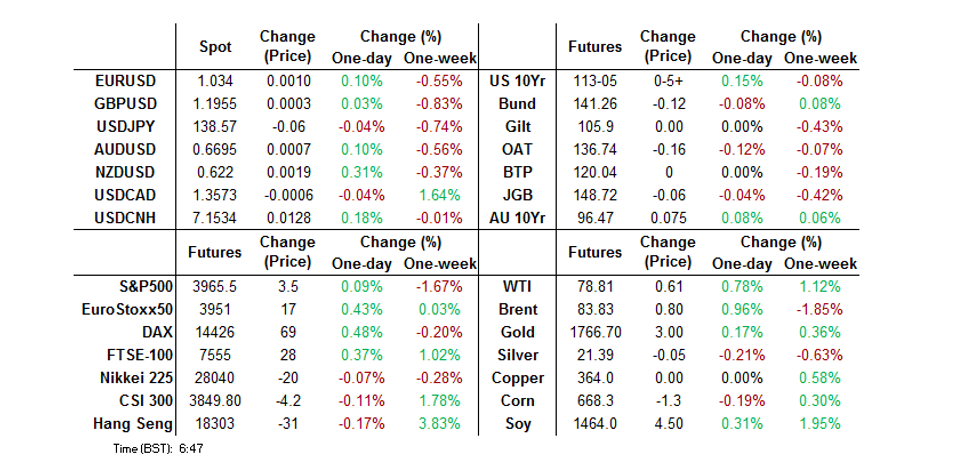
- Softer than expected Australian CPI data and weak Chinese PMIs headlined during Asia-Pac hours.
- The USD has remained on the back foot for much of the session. The BBDXY is down 0.25%, back to the low 1276/77 region. Generally positive equity market sentiment, coupled with a slight downtick in UST yields, has weighed on the dollar.
- Coming up, we have Eurozone, French and Italian CPI as well as a slew of US data including ADP employment, MNI Chicago PMI and the release of the Fed’s Beige Book. Fedspeak from Bowman and Cook is also due, although their comments will be overshadowed by Chair Powell’s latest address, covering the economic outlook and the labour market.
US TSYS: Moderately Firmer On Asia-Pac Data, Powell Headlines Busy Docket
TYH3 deals at 113-04+, +0-05, a touch off the peak of its narrow 0-07 range, on volume of ~80K (which includes some residual roll activity). Cash Tsys run 1-2bps richer across the curve, with the belly leading the bid.
- The uptick in Tsys was aided by softer than expected Australian CPI data and a weak round of Chinese PMI readings.
- Reports of a district in the Chinese city of Shanghai stockpiling "anti-COVID materials" helped at the margins.
- Looking ahead, Eurozone, French and Italian CPI will cross in London hours. Meanwhile, NY hours will see a slew of U.S. data including ADP employment, pending homes sales and MNI Chicago PMI. Fedspeak from Bowman and Cook is also due, although their comments will be overshadowed by Chair Powell’s latest address, covering the economic outlook and the labour market.
JGBS: Oscillating In Narrow Range
The broader bid in core global FI markets (fleshed out elsewhere) allowed JGBs to briefly firm during the Tokyo afternoon, before some weakness crept in ahead of the bell. Futures now print -7 ahead of the close, while cash JGBs are little changed to 1.5bp cheaper across the curve.
- That was after a sedate round of morning dealing saw a modest uptick in JGB yields, while JGB futures traded on the backfoot. This was perhaps a catch-up play to Tuesday’s cheapening in U.S. Tsys.
- Softer than expected domestic industrial production data failed to inspire price action.
- Broader domestic headline flow was limited at best, with no meaningful market reaction to news of a brief joint incursion by Russian & Chinese military aircraft into Japanese airspace.
- Looking ahead, Thursday’s local docket includes capex & final manufacturing PMI data and 10-Year JGB supply. We will also hear from BoJ’s Noguchi.
AUSSIE BONDS: Firmer & Flatter On Domestic CPI & China PMIs
Aussie bonds have firmed, with softer than expected domestic CPI data and weak official PMI prints out of China facilitating the bid.
- The richening in the long end extended into the close, even with sub-average projections for month-end index extensions noted, while YM was capped by its post-CPI Sydney peak.
- That left YM +7.0 at the close, while XM was +7.5. Cash ACGBs ran 6.5-10.5bp richer on the day, bull flattening, after the previously flagged data releases more than reversed the early bear steepening.
- The latest round of ACGB Apr-33 supply went well. The recent stabilisation of the space away from cycle cheaps and edging of the line towards 10-Year benchmark status likely aided takedown.
- Bills were 3-10bp richer through the reds, while RBA dated OIS nudged lower post-data. Just under 20bp of tightening is now priced for the Bank’s Dec ’22 meeting, while terminal cash rate pricing is in to ~3.75%.
- Looking ahead, Thursday’s local docket includes capex data, the final m’fing PMI survey from S&P Global and the CoreLogic house price print.
AUSTRALIA: October Inflation Shows Early Signs Heading In Right Direction
Headline CPI inflation for October fell to 6.9% y/y from 7.3% in September, which was not only lower than expected but also below the lower end of forecasts. But the ABS notes that with the previous weights it would have been 7.1%. The Trimmed mean was steady at 5.3% y/y. The CPI only rose a seasonally-adjusted 0.2% m/m and the trimmed mean 0.3%.
- Despite the new monthly inflation data coming in well below expectations, it is still elevated. The RBA has said that it will continue to focus on the quarterly data for now, given that the monthly series has a limited history and a narrower basket. The stabilisation of underlying inflation in October though should be seen by the RBA as an early sign that prices might be moving in the right direction.
- The biggest contributors to the rise were new dwellings (+20.4% y/y) and automotive fuel (+11.8% as cut to excise expired).
- The easing in headline inflation was driven by some large moves in a number of categories. Fruit & vegetables inflation dropped to +9.4% y/y from 17.4% last month, as supply increased. Holiday-related inflation also moderated to 3.7% y/y from 12.6% and the weight of international travel increased to 1.9% from 0.1% in the weighting revisions.
- The ABS noted that "Typically, annual updates to the weights have limited impact on the overall CPI. This year, however, the significant changes in spending patterns over 2021 and 2022 meant that the reweight had a larger impact on the CPI than usual."
- See press release here.

Source: MNI - Market News/ABS
AUSTRALIA: Variations Of Monthly CPI Elevated But Point To Possible Peak
Headline CPI inflation for October moderated to 6.9% y/y with the travel & food components and reweighting putting downward pressure on prices. The trimmed mean stabilised at 5.3%. If we look at some alternative measures of CPI inflation, it does look like that there is a tentative peaking in price pressures but they are still running well above the top of the RBA’s target band. The data point to further rate hikes but remaining at 25bp.
- 3-month annualised momentum in headline inflation has turned down decisively to 5.5% from a peak of 8.6% in April in line with the downtrend in fuel prices. Momentum in the trimmed mean measure moderated in October for the first time this year dropping to 5.7% from 6% last month, but one month doesn’t make a trend and this peak is very tentative.
- Our proxy for retail prices looks to have peaked in August at 7.7% and moderated to a still elevated 7.4% y/y in October. The median of the major components (median CPI) returned to its August rate in October of 4.5% y/y.
- The official CPI ex volatile items also moderated in October to 6.4% y/y from 6.8% last month.
Fig. 1: Australia CPI momentum 3m/3m ave ann%

Source: MNI - Market News/ABS
Fig. 2: Australia inflation measures y/y%

Source: MNI - Market News/ABS
AUSTRALIA: Housing Affordability Deteriorates Sharply And Poses Risk To Outlook
Today the Sydney Morning Herald reported that average mortgage payments are now 42.8% of incomes in Australia, which is the highest since 1990, according to BetaShares modelling, and could put significant strain on spending. In Sydney it is even higher at 57.8%. Still elevated house prices with rising mortgage rates is impacting affordability significantly and could result in a sharper economic downturn than is currently expected.
- The RBA’s cumulative 275bp of monetary policy tightening so far this year has impacted housing affordability significantly more than the 6.6% drop in house prices from their April 2022 peak has helped it, as house prices rose 25% from September 2020.
- House prices to disposable income peaked in Q1 2022 but well below the 2003 peak. However, our housing affordability index (HAI) peaked in Q3 2020 at its highest since the series began in 1980 due to record low interest rates. It is now down 26.7% y/y.
- The HAI began to decline before the RBA tightened because booming house prices resulted in deteriorating affordability. In Q2 2022, the quarter the RBA began tightening, the HAI fell below trend and is likely to continue to deteriorate into 2023.
- The house price to CPI rents ratio is a good proxy for housing valuation. At the start of the year, it was showing that residential property was almost 20% overvalued. While that has moderated the latest data continues to show it is overvalued but with house prices falling and rents firming, that should correct to some extent.

Source: MNI - Market News/Refinitiv
Fig. 2: Australia housing valuation %

Source: MNI - Market News/Refinitiv
NZGBS: Curve Twist Steepens, Off Cheaps On Data & Receiver-Side Swap Flows
Cash NZGBs twist steepened on Wednesday, with the major benchmarks running 0.5bp richer to 3bp cheaper, pivoting around 5s. Receiver-side swap flow in lieu of weak domestic business confidence data, as well as softer than expected Australian CPI data and Chinese PMI readings, seemingly aided a move away from session cheaps, with swap spreads tightening across the curve as swap rates finished little changed to 5bp lower on the day (with the swap curve steepening).
- RBNZ dated OIS continue to price just under 70bp of tightening for the first RBNZ meeting of ’23, while terminal OCR pricing continues to hover around 5.40%.
- The RBNZ “launched a second consultation as part of the five-yearly review of the Monetary Policy Committee’s (MPC) Remit that guides monetary policy decisions.” The Bank noted that “this second consultation seeks feedback on the recommendations we are intending to provide to the Government about possible changes to the Remit.” When it comes to the return of inflation to target, the RBNZ has noted that “the Reserve Bank considers the Remit best supports wellbeing by leaving the time horizon undefined.”
- Looking ahead, tomorrow’s local docket includes CoreLogic house price data and the weekly round of NZGB auctions (covering NZGB-27, -33 & -51).
NEW ZEALAND: ANZ Indicators Show RBNZ Tightening Taking Its Toll On Businesses
ANZ activity indicators for November were very soft with the activity outlook falling to -13.7, the worst since the pandemic-affected August 2020 reading. Business confidence fell to -57.1, the second consecutive monthly fall and the worst since June 2022. Both series are well below their long-term averages of +24.5 and +4.6 respectively. The RBNZ’s 400bp of tightening appears to be impacting business sentiment and further data prints such as this are likely to mean a slowing in the pace of tightening in February 2023.
Fig. 1: NZ Growth outlook

Source: MNI - Market News/Refinitiv/ANZ
FOREX: USD Weighed By Firmer Risk Appetite
The USD has remained on the back foot for much of the session. The BBDXY is down 0.25%, back to the low 1276/77 region. Generally positive equity market sentiment, coupled with a slight downtick in UST yields, has weighed on the dollar.
- Data outcomes have generally been disappointing, particularly the China PMI trends, which fell further into contractionary territory. This had no lasting impact on sentiment though.
- AUD/USD dipped post a decent monthly CPI miss, but the pull back to 0.6670 was supported, the pair last at 0.6700. AU bond yields are lower, the 2yr off by 6bps. AUD/NZD is lower, last around 1.0760, but we are yet to test recent lows around 1.0750.
- NZD/USD is the best performer within the G10 space, up 0.40% since the open to 0.6225. Weaker domestic confidence figures didn't weigh on the Kiwi.
- The yen generally lagged the rest of the G10, in line with firmer risk appetite. USD/JPY is still slightly lower, last at 138.50. EUR and GBP are both around +0.30% firmer for the session.
- Coming up, we have Eurozone, French and Italian CPI as well as a slew of US data including ADP employment, MNI Chicago PMI and the release of the Fed’s Beige Book. Fedspeak from Bowman and Cook is also due, although Chair Powell also speaks on the economic outlook and the labour market, which will likely be the main focus.
AUDNZD: Rate Spreads Still A Headwind, Other Macro Drivers Less So
Relative rate differentials continue to point to lower AUD/NZD cross levels. Post this morning's AU monthly CPI miss, the AU-NZ 2yr swap spread is at fresh YTD lows of -142bps, see the chart below. Beyond this is lows around -152bps recorded in November last year.
- Still, despite these relative monetary policy headwinds for the A$, the cross has been range bound for the past week. The pair has been supported around the 1.0750 level, while moves above 1.0800 have drawn selling interest.
Fig 1: AUD/NZD Versus AU-NZ 2yr Swap Differential
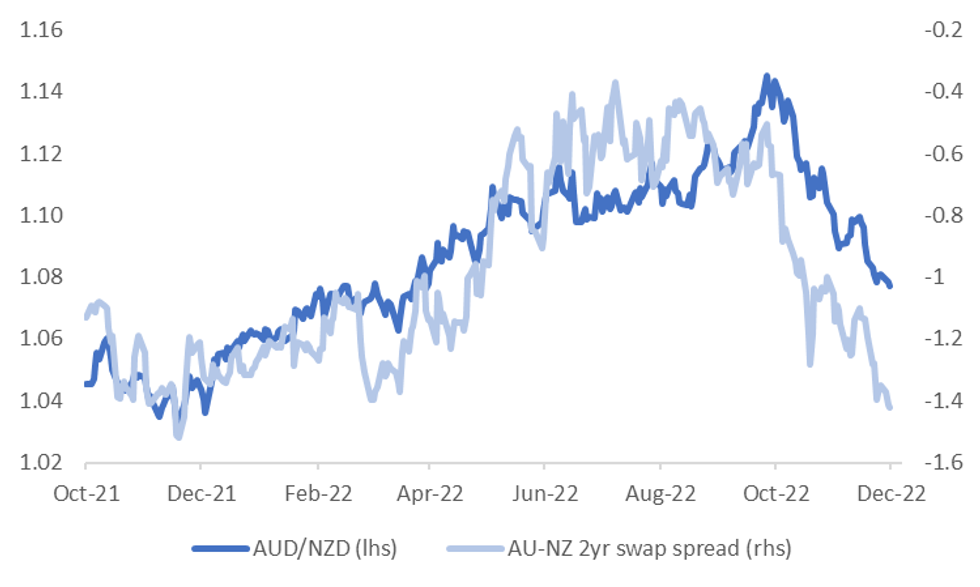
Source: MNI - Market News/Bloomberg
- Other indicators are pointing to less downside for the cross. This was signified this morning with the poor NZ ANZ business activity print. The second chart below plots the difference between the AU NAB business conditions measure and this NZ activity index. Note the latest observation in the chart assumes an unchanged NAB business conditions reading for November.
- It may take a more dovish RBNZ backdrop to re-establish the relationship between the cross and relative business conditions. This may take some time given the RBNZ's focus on bringing inflation down (even if it comes at the expense of the growth backdrop).
- Still, other indicators, like the relative terms of trade backdrop, are also pointing to a less downside in the AUD/NZD cross, which may be helping slow the rate of descent in the pair.
Fig 2: AUD/NZD Versus Relative Business Conditions
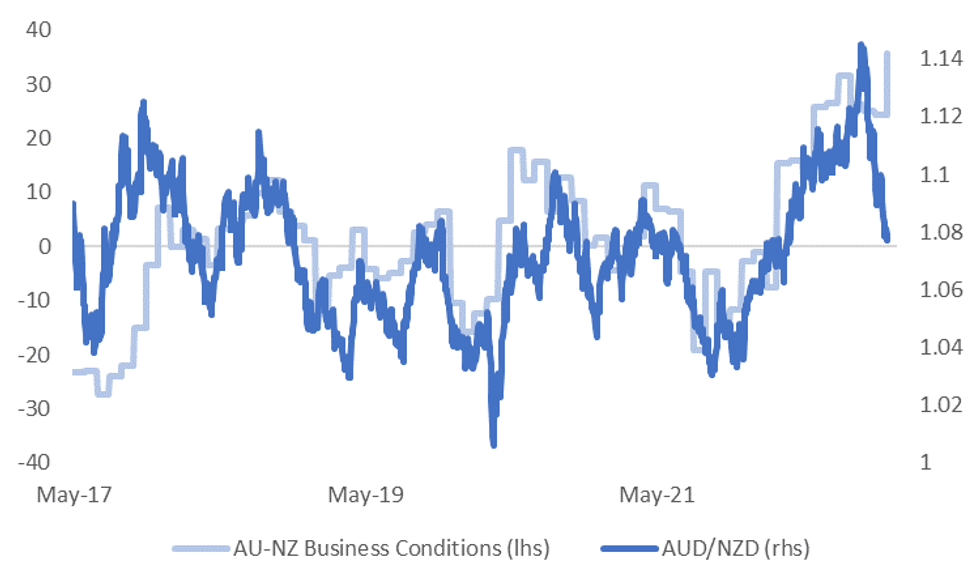
Source: ANZ/NAB/MNI - Market News/Bloomberg
ASIA FX: USD Weakness Not Uniform
USD/Asia pairs are mostly lower, although not in a uniform fashion. CNH has been a laggard, as have INR and IDR. KRW, MYR, THB and MYR have led the gains. Still to come is the BoT decision (+25bps expected) and Indian Q3 GDP. Tomorrow the focus will be on the China Caixin PMI, South Korean November trade data and a host of PMI readings for the region. Indonesia CPI also prints.
- USD/CNH popped above 7.1600 after the PMI prints disappointed, but this level found selling interest. On the downside moves sub 7.1400 were supported. The USD/CNY fix was close to neutral. We were last close to 7.1500.
- USD/KRW has shrugged off poor domestic news around data and on-going trucker/rail staff strikes. The pair has fallen to 1315, fresh lows back to mid-November. Onshore equities are higher by over 1%.
- USD/INR is back to 81.60/65, but lagging broader USD moves. The pair remains within recent ranges, while Q3 GDP, due later, is expected to show noticeably. A good proportion of this reflects base effects though.
- USD/IDR is holding steady around 15740. This comes despite reported intervention by the authorities. There was a number of comments by officials, with President Jokowi's comments generally painting a tougher macro picture in 2023, while the current account position is expected to worsen.
- USD/THB is lower, close to the simple 200-day MA (35.28, versus 35.33 for spot currently). We haven’t been below this support level since March of this year. The BoT is widely expected to hike rates by 25bps later today.
CHINA DATA: PMIs Disappoint, But Limited Market Impact
China official PMIs came in well below market expectations. The manufacturing printed at 48.0, versus a 49.0 forecast, while non-manufacturing PMI fell to 46.7, against the 48.0 forecast. Both series are above their trough points from earlier in the year, around the Shanghai lock down, but continue to trend down.
- Both series suggest the economy lost further momentum mid-way through Q4. The detail in both surveys was fairly negative across the board, with new orders for both PMIs not suggesting an imminent turnaround.
- As we noted yesterday though, a weaker economic back drop is well known for China at the moment.
- Perhaps reflecting this, and also re-opening/less stringent Covid restrictions hopes, the market reaction has been limited to the misses. USD/CNH popped above 7.1600 shortly after the data printed, but is now back around 7.1400 unchanged for the session.
- AUD/USD and NZD/USD have generally pushed higher as well, now that the dust has settled post the prints.
- One school of thought in the market may well be that the bleaker the economic data is the greater the likelihood the authorities will move away from stringent lock down conditions.
SOUTH KOREA: IP Weaker Than Expected, Capacity Utilization Rates Dip Back To 2020 Levels
South Korean industrial production growth missed estimates for October, coming in at -3.5% m/m, versus a -1.0% forecast, while September figures were revised down a touch. This puts the y/y pace at -1.1%, the first negative y/y print since September last year.
- Manufacturing capacity utilization fell back to 72.40%, a steep fall from last month's 75.1%. This is the lowest utilization levels since Q3 2020, see the chart below. Weaker external demand, as signified by falling export growth, is a likely part driver of this trend.
- In terms of other data, retail sales fell by -0.2% m/m, while the cyclical leading index was unchanged at -0.1.
Fig 1: South Korea IP Growth & Capacity Utilization Rates
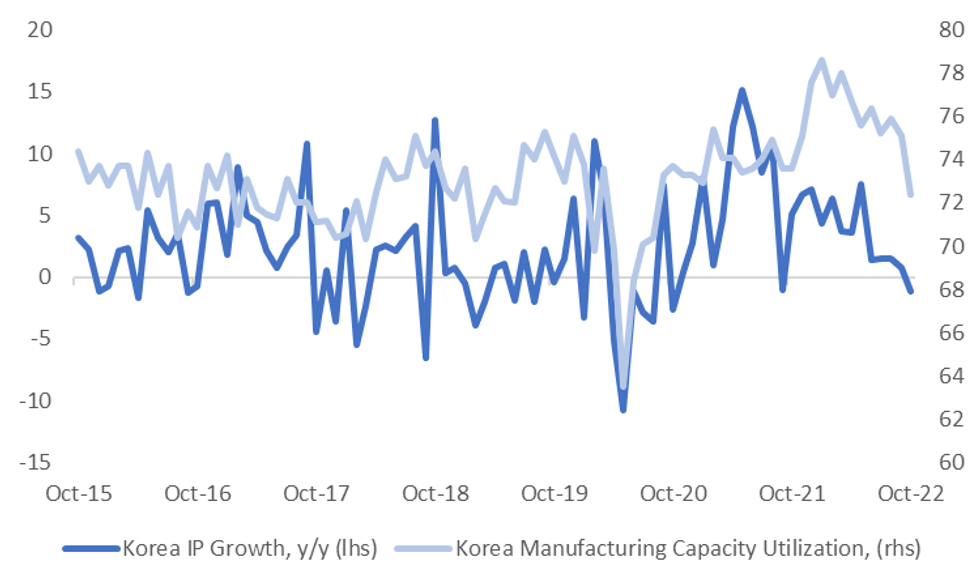
Source: MNI - Market News/Bloomberg
EQUITIES: Positive Momentum Persists
Asia Pac equities (ex Japan) are mostly higher. Markets have shrugged off generally poor economic data throughout the Asia Pac region. US futures are up slightly, with the major bourses firmer by +0.10/+0.20%.
- Onshore China markets have ticked higher, although gains are more modest compared to yesterday's session, with the CSI 300 and Shanghai Composite +0.10% higher at this stage.
- Covid cases ticked modestly lower again, while the market appeared to interpret the weaker official PMI prints as a sign that Covid restrictions need to be eased further to turn economic momentum around. This is likely to remain a delicate balancing act though, as we head into the winter months.
- The HSI is up 1%, while the Kospi (+1%) and Taiex (+0.85%) have performed strongly as well.
- The ASX 200 is firmer by 0.43%, as resource names lead the move higher. Japan stocks remain laggards, the Nikkei 225 down 0.40%.
GOLD: Prices Up Again Ahead Of Fed Chairman Powell
Gold prices are up again today by 0.3% to $1754.50/oz supported by a weaker USD (DXY -0.3%). Bullion has been trading above $1750 for most of the session.
- Trend conditions for gold remain bullish but prices have not made much progress to the bull trigger at $1786.50, the November 15 high.
- November has been a good month for gold prices driven by signals that the Fed will slow its tightening pace at its December meeting. A clear communication from China that it is going to ease restrictions should boost gold prices further.
- Tonight Fed Chairman Powell speaks and is expected to signal the size of the next rate move. Gold prices are likely to react inversely to the USD. Fed Governors Cook and Bowman are also scheduled to speak. On the data front there is US trade, JOLTS and ADP job data.
OIL: Oil Prices Up Again Today But Waiting For EU And OPEC+ Announcements
Oil prices are 1.1% higher during trading today with WTI now around $79.10/bbl, close to resistance of $79.90, and Brent $84 supported by a lower USD. Overall oil has been in tight ranges, as the market awaits the EU’s decision on the oil price cap and the weekend’s OPEC+ meeting.
- Overnight the US API data showed a crude inventory drawdown of 7.9mn barrels after a 4.8mn drop last week showing the tightness of the market. However, distillate stocks rose 4mn and gasoline +2.9mn.
- There continues to be speculation that OPEC+ will agree to an output cut this weekend despite denials from members overnight.
- Markets remain concerned about the demand outlook, especially from China.
UP TODAY (Times GMT/Local)
| Date | GMT/Local | Impact | Flag | Country | Event |
| 30/11/2022 | 0700/1500 | ** |  | CN | MNI China Liquidity Suvey |
| 30/11/2022 | 0730/0730 |  | UK | DMO Publishes FQ4 Issuance Calendar | |
| 30/11/2022 | 0745/0845 | *** |  | FR | HICP (p) |
| 30/11/2022 | 0745/0845 | ** | | FR | PPI |
| 30/11/2022 | 0745/0845 | ** | | FR | Consumer Spending |
| 30/11/2022 | 0745/0845 | *** | | FR | GDP (f) |
| 30/11/2022 | 0800/0900 |  | ES | Retail Sales | |
| 30/11/2022 | 0800/0900 | * |  | CH | KOF Economic Barometer |
| 30/11/2022 | 0830/0830 | | UK | BOE Pill Speech at ICAEW Summit | |
| 30/11/2022 | 0855/0955 | ** |  | DE | Unemployment |
| 30/11/2022 | 0900/1000 | *** |  | IT | GDP (f) |
| 30/11/2022 | 1000/1100 | *** | | IT | HICP (p) |
| 30/11/2022 | 1000/1100 | *** |  | EU | HICP (p) |
| 30/11/2022 | 1200/0700 | ** |  | US | MBA Weekly Applications Index |
| 30/11/2022 | 1315/0815 | *** | | US | ADP Employment Report |
| 30/11/2022 | 1330/0830 | *** | | US | GDP (2nd) |
| 30/11/2022 | 1330/0830 | ** | | US | Advance Trade, Advance Business Inventories |
| 30/11/2022 | 1350/0850 | | US | Fed Governor Michelle Bowman | |
| 30/11/2022 | 1445/0945 | ** | | US | MNI Chicago PMI |
| 30/11/2022 | 1500/1000 | ** | | US | NAR pending home sales |
| 30/11/2022 | 1500/1000 | ** | | US | JOLTS jobs opening level |
| 30/11/2022 | 1500/1000 | ** | | US | JOLTS quits Rate |
| 30/11/2022 | 1530/1030 | ** | | US | DOE weekly crude oil stocks |
| 30/11/2022 | 1735/1235 | | US | Fed Governor Lisa Cook | |
| 30/11/2022 | 1830/1330 | | US | Fed Chair Jerome Powell | |
| 30/11/2022 | 1900/1400 | | US | Fed Beige Book | |
| 01/12/2022 | 2200/0900 | ** |  | AU | IHS Markit Manufacturing PMI (f) |
Why MNI
MNI is the leading provider
of intelligence and analysis on the Global Fixed Income, Foreign Exchange and Energy markets. We use an innovative combination of real-time analysis, deep fundamental research and journalism to provide unique and actionable insights for traders and investors. Our "All signal, no noise" approach drives an intelligence service that is succinct and timely, which is highly regarded by our time constrained client base.Our Head Office is in London with offices in Chicago, Washington and Beijing, as well as an on the ground presence in other major financial centres across the world.