
Why MNI
MNI is the leading provider
of intelligence and analysis on the Global Fixed Income, Foreign Exchange and Energy markets. We use an innovative combination of real-time analysis, deep fundamental research and journalism to provide unique and actionable insights for traders and investors. Our "All signal, no noise" approach drives an intelligence service that is succinct and timely, which is highly regarded by our time constrained client base.Our Head Office is in London with offices in Chicago, Washington and Beijing, as well as an on the ground presence in other major financial centres across the world.
US TSYS: A Touch Flatter On Election Interference Talk, Fiscal Deal Elusive
T-Notes continue to hold to the 0-04 range that was established relatively early in the overnight session, with macro headline flow light in Asia-Pac hours, outside of the comments from the U.S. security service which pointed to Russian & Iranian efforts to interfere in the upcoming U.S. election. The DC fiscal impasse also continues to bubble in the background, with talks set to continue on Thursday. Contract last -0-01 at 138-17+, with the curve bull flattening on the aforementioned election intervention story, as cash Tsys sit unchanged to 1.9bp richer across the curve.
- Fiscal dynamics drove the space during NY hours, with the curve bear steepening as longer dated yields extended through their recent range tops. Wednesday's 20-Year auction was solid enough, stopping virtually on the screws, with an in line with average cover ratio, and a slightly below average dealer takedown.
- Eurodollar futures are virtually unchanged through the reds, with the only real flow of note coming in the form of upside exposure via EDZ1 100.00 calls.
- Weekly Jobless claims headlines the U.S. economic docket on Thursday. Elsewhere, Fedspeak from Barkin & Kaplan is due, and we will also see 5-Year TIPS supply. That all comes before the final Trump-Biden debate.
JGBS: Chopping Around The Range
JGB futures have chopped around within a relatively narrow range, last -5 at worst levels of the day, as both the JGB and swap curves steepen, with some weakness in the respective super-long ends in the wake of the steepening seen on the U.S. Tsy curve on Wednesday.
- There was little of note to drive matters on the domestic front.
- The latest round of weekly international security flow data revealed that foreign investors registered a 3rd straight week of net purchase of Japanese bonds (Y392.4bn), as the 4-week rolling sum of the measure moved into positive territory for the 1st week in 4.
- Flash PMI and CPI data headline the local docket on Friday.
JAPAN: Weekly Net International Security Flows Moderate
Net flows moderated in outright size terms across all 4 of the major measures eyed in the weekly Japanese international security flow data
- Japanese investors pulled back on net buying of foreign bonds (Y419.8bn). This would suggest that lifers may have pulled back after some H2FY investment plan related deployment in the previous week (which saw a net Y1.9368tn worth of net purchases)
- Japanese investors also flipped to net sellers of foreign equities (Y162.8bn) lodging net sales for a 5th week in 6.
- Foreign investors registered a 3rd straight week of net purchase of Japanese bonds (Y392.4bn), as the 4-week rolling sum of the measure moved into positive territory for the 1st week in 4.
- Foreign investors reverted to net sales of Japanese equities in the most recent week (Y94.0bn), although the 4-week rolling sum jumped further into positive territory as one week of sizable net sales fell out of the sample.
AUSSIE BONDS: Weak Longs Likely Aid Steepening
The Aussie bond space has also drifted steeper, with e-minis off lows. YM -0.5, with XM -2.0. Once again, weaker longs may be folding, amplifying any modest pressure in the space as XM traded through yesterday's lows, before recovering from worst levels.
- Bills sit unchanged to -1 through the reds, with today's 3-Month BBSW fixing holding at record low levels of 0.06%.
- Focus tomorrow turns to flash PMI data, A$1.5bn worth of ACGB 0.50% 21 September 2026 supply and the release of the AOFM's weekly issuance schedule.
AUCTION/DEBT SUPPLY
JGBS AUCTION: Japanese MOF sells Y3.1320tn 6-Month Bills:
The Japanese Ministry of Finance (MOF) sells Y3.1320tn 6-Month Bills:- Average Yield -0.1002% (prev. -0.1202%)
- Average Price 100.050 (prev. 100.060)
- High Yield: -0.0982% (prev. -0.1122%)
- Low Price: 100.049 (prev. 100.056)
- % Allotted At High Yield: 89.3911% (prev. 44.8082%)
- Bid/Cover: 3.622x (prev. 3.701x)
TECHS
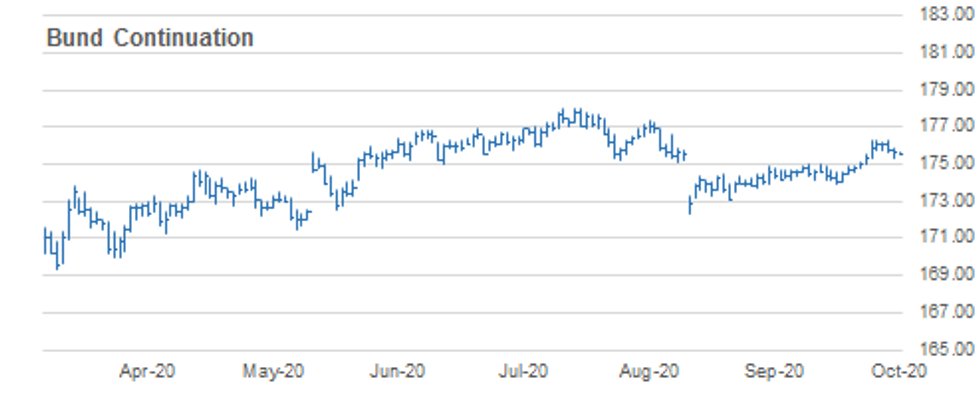
BUND TECHS: (Z0) Pullback Considered A Correction
- RES 4: 176.57 1.618 proj of Aug 28 - Sep 9 rally from the Sep 10 low
- RES 3: 176.32 1.500 proj of Aug 28 - Sep 9 rally from the Sep 10 low
- RES 2: 176.29 High Oct 16 and the bull trigger
- RES 1: 175.86 High Oct 21
- PRICE: 175.55 @ 04:47 BST Oct 22
- SUP 1: 175.34 Low Oct 21
- SUP 2: 175.08 High Aug 4, 20-day EMA and recent breakout level
- SUP 3: 174.76 Low Oct 13
- SUP 4: 174.49 50-day EMA
Bund gains have stalled this week with key resistance defined at 176.29, Oct 16 high. The pullback is likely a correction following recent sharp gains. Attention turns to the next support at 175.08, Aug 4 high and the recent breakout level as well the 20-day EMA. On the upside, clearance of 176.29, the bull trigger, would confirm a resumption of the uptrend and open 176.32/57, Fibonacci projections. Initial resistance is at 175.86.
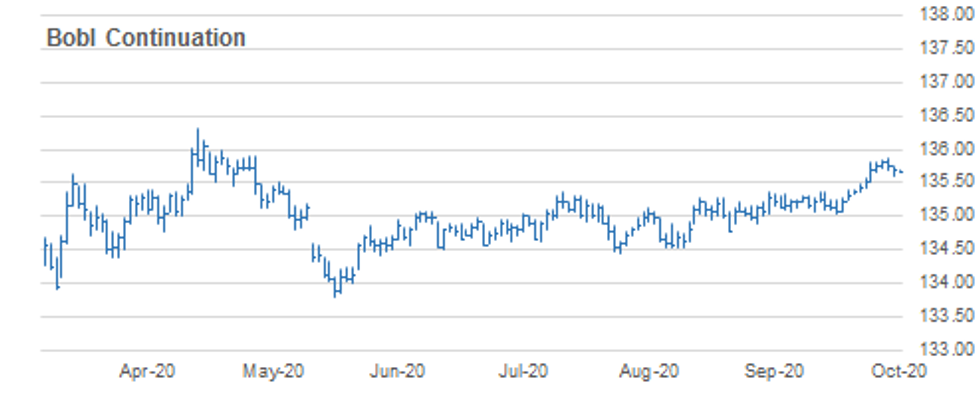
BOBL TECHS: (Z0) Remains In A Corrective Cycle
- RES 4: 136.060 2.000 retracement of the May - Jun sell-off (cont)
- RES 3: 136.000 Round number resistance
- RES 2: 135.907 1.764 proj of Sep 1 - Sep 9 rally from Sep 10 low
- RES 1: 135.860 High Oct 20 and the bull trigger
- PRICE: 135.670 @ 04:55 BST Oct 22
- SUP 1: 135.600/543 Low Oct 21 / 38.2% of the Oct 7 - 20 rally
- SUP 2: 135.510 Low Oct 15
- SUP 3: 135.440 20-day EMA
- SUP 4: 135.370 High Sep 21 and Oct 5 and former breakout level
BOBL gains have stalled this week and are correcting lower. Key resistance has been defined at 135.860, Tuesday's intraday high. Attention is on the next support at 135.510, Oct 15 low ahead of the 20-day EMA at 135.440. A break of the average would signal scope for a deeper pullback. On the upside, clearance of 135.860, the bull trigger, would confirm a resumption of the uptrend and open 135.907, a Fibonacci projection ahead of 136.00.
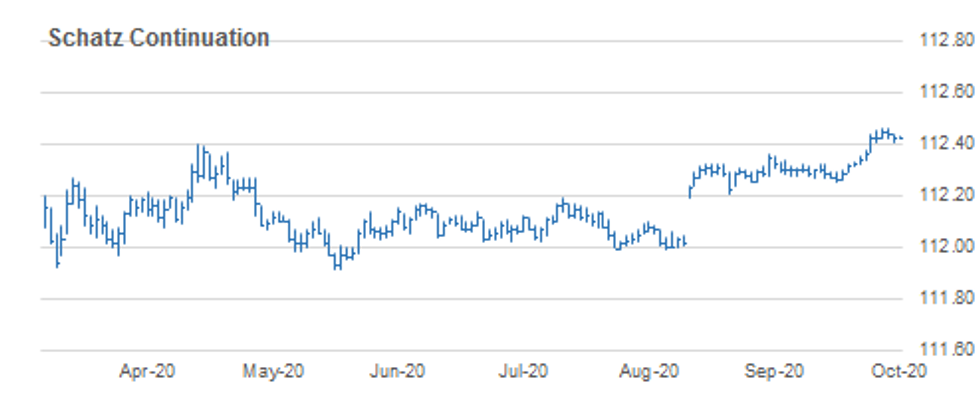
SCHATZ TECHS: (Z0) Trading Below Recent Highs
- RES 4: 112.505 61.8% retracement of the Mar - Jun sell-off (cont).
- RES 3: 112.490 2.000 proj of Aug 26 - Sep 9 rally from the Sep 10 low
- RES 2: 112.457 1.764 proj of Aug 26 - Sep 9 rally from the Sep 10 low
- RES 1: 112.460 High Oct 19 / 20 and the bull trigger
- PRICE: 112.430 @ 05:08 BST Oct 22
- SUP 1: 112.410 Low Oct 16 and Oct 21
- SUP 2: 112.360 High Sep 21 and the recent breakout level
- SUP 3: 112.356 20-day EMA
- SUP 4: 112.340 Low Oct 14
Schatz futures are trading below recent highs. Pullbacks are likely a correction following recent sharp gains and key resistance has been defined at 112.460, Oct 19 and 20 high. Attention is on support at 112.410, Oct 15 and 21 low ahead of the recent breakout level at 112.360, Sep 21 high. The 20-day EMA intersects at 112.356. On the upside, clearance of 112.460, would resume the uptrend and open 112.490, a Fibonacci projection.
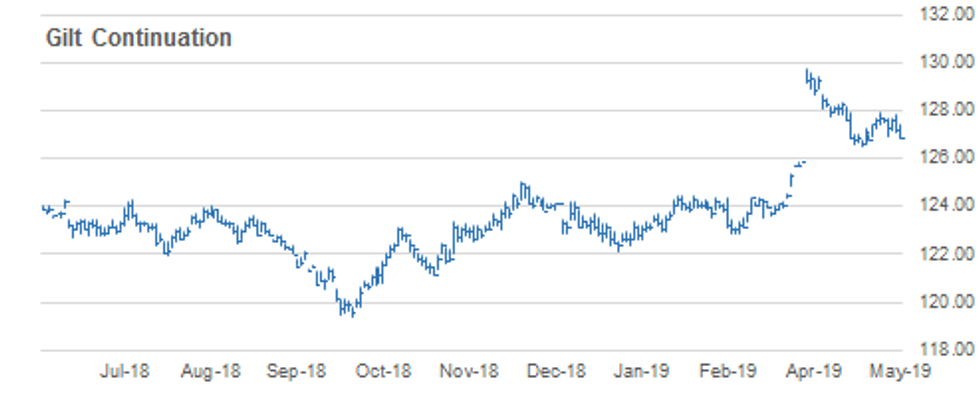
GILT TECHS: (Z0) Sharp Correction Lower
- RES 4: 137.04 High Sep 21 and a key resistance
- RES 3: 136.97 High Oct 16 and the bull trigger
- RES 2: 136.75 High Oct 20
- RES 1: 136.27 High Oct 21
- PRICE: 135.95 @ Close Oct 21
- SUP 1: 135.79 Low Oct 21 / 61.8% retracement of the Oct 7 - 16 rally
- SUP 2: 135.51 76.4% retracement of the Oct 7 - 16 rally
- SUP 3: 135.29 Low Oct 9
- SUP 4: 135.06 Low Oct 7 and the bear trigger
Gilt futures traded sharply lower yesterday as a strong correction unfolds following recent gains between Oct 7 - 16. Price has pulled back as far as 135.79, 61.8% of the recent upleg. A break lower would signal scope for a deeper pullback and open 135.51, the next Fibonacci retracement level. On the upside, initial resistance is at yesterday's high of 136.27. A return above this level would refocus attention on recent highs at 136.97.
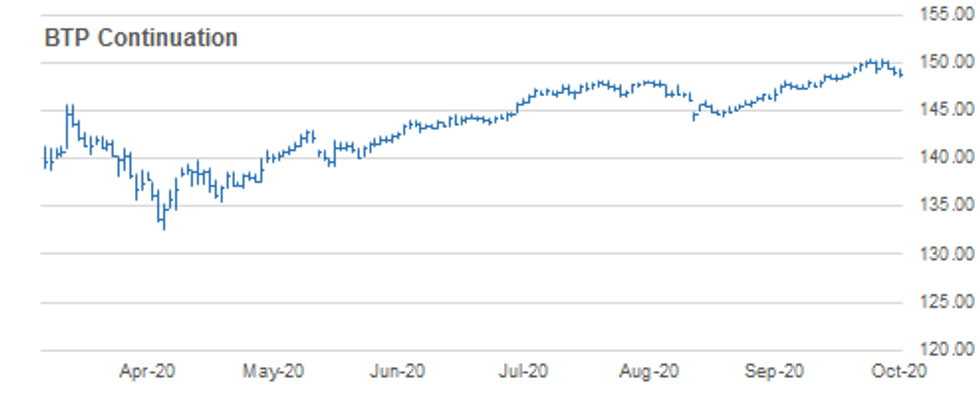
BTPS TECHS: (Z0) Probes The 20-Day EMA
- RES 4: 152.00 Round number resistance
- RES 3: 151.17 0.764 of Jun 10 - Aug 20 swing from Sep 9 low (cont)
- RES 2: 150.46 High Oct 16 and the bull trigger
- RES 1: 149.58 Oct 20 high
- PRICE: 148.84 @ Close Oct 21
- SUP 1: 148.62 Low Oct 21
- SUP 2: 148.03 38.2% retracement of the Sp 1 - Oct 16 rally
- SUP 3: 147.46 Low Sep 30
- SUP 4: 147.27 50.0% retracement of the Sp 1 - Oct 16 rally
BTPS outlook remains bullish despite this week's continued pullback, a correction. The contract has probed the 20-day EMA at 148.76. A clear break would allow for a deeper move lower potentially towards 148.03, a Fibonacci retracement level. The underlying bullish outlook remains intact following recent gains in uncharted territory. Initial resistance is at 149.58, Oct 20 high. A break of 150.46, Oct 16 high resumes the uptrend.
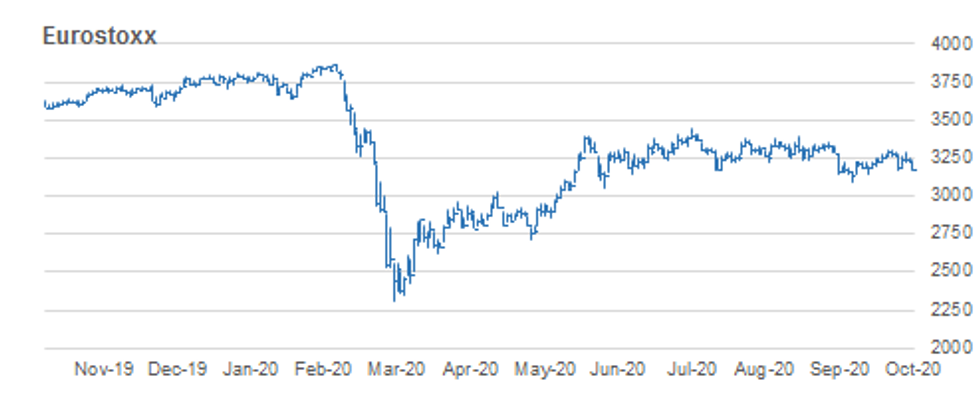
EUROSTOXX50 TECHS: Bearish Focus
- RES 4: 3348.77 High Sep 16
- RES 3: 3326.79 High Sep 18
- RES 2: 3305.77 High Oct 12 and the bull trigger
- RES 1: 3282.52 High Oct 19
- PRICE: 3180.70 @ Close Oct 21
- SUP 1: 3174.64 Low Oct 15
- SUP 2: 3147.28 Low Oct 2 and key support
- SUP 3: 3097.67 Low Sep 25 and the bear trigger
- SUP 4: 3054.11 Low June 15
A bearish EUROSTOXX 50 focus remains intact and the index traded sharply lower yesterday. Recent weakness off the 3305.77 high from Oct 12 potentially reverses the recent Sep 25 - Oct 12 recovery. Attention is on 3147.28, Oct 2 low where a break would expose the key support handle at 3097.67, Sep 25 low. Clearance of this level would mark an important bearish break. Key near-term resistance is at 3282.55, Oct 19 high.
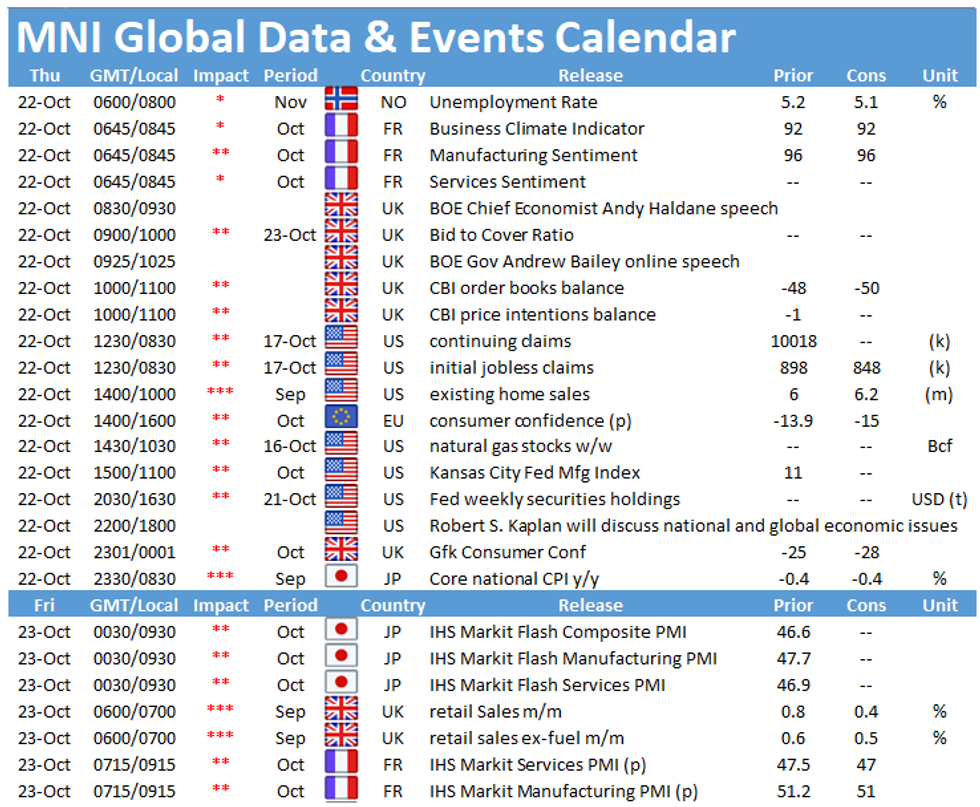
LOOK AHEAD
Why MNI
MNI is the leading provider
of intelligence and analysis on the Global Fixed Income, Foreign Exchange and Energy markets. We use an innovative combination of real-time analysis, deep fundamental research and journalism to provide unique and actionable insights for traders and investors. Our "All signal, no noise" approach drives an intelligence service that is succinct and timely, which is highly regarded by our time constrained client base.Our Head Office is in London with offices in Chicago, Washington and Beijing, as well as an on the ground presence in other major financial centres across the world.