
Why MNI
MNI is the leading provider
of intelligence and analysis on the Global Fixed Income, Foreign Exchange and Energy markets. We use an innovative combination of real-time analysis, deep fundamental research and journalism to provide unique and actionable insights for traders and investors. Our "All signal, no noise" approach drives an intelligence service that is succinct and timely, which is highly regarded by our time constrained client base.Our Head Office is in London with offices in Chicago, Washington and Beijing, as well as an on the ground presence in other major financial centres across the world.
- Friday's Wall St. rally spilled over into Asia-PAc hours, with the major regional indices moving higher.
- It was a different story in the FX space, where Friday's recovery in risk appetite proved fragile as the Antipodeans paced losses while the yen outperformed. A turnaround in U.S. e-mini futures failed to entail a reversal of initial risk-off moves in G10 FX space.
- Looking ahead, the U.S. will report pending home sales & flash durable goods orders today. Comments are due from ECB's Lagarde & Villeroy
US TSYS: Pickup In Equities Weighs On Tsys
TYU2 took out Friday’s low in overnight trade, with the contract last dealing -0-07 at 117-04, 0-01+ off the base of its overnight range, on sub-standard volume of ~63K lots. Meanwhile, cash Tsys run 0.5-4.0bp cheaper as the curve bear steepens.
- Firmer equities and a rally in the major Asia-Pac equity indices allowed the Tsy space to cheapen in overnight dealing, after a lacklustre round of early trade. The Chinese COVID situation and the impending resumption of indirect U.S.-Iran nuclear talks were positives for wider sentiment (with a strong lead from Friday’s Wall St. session also supporting), while the ongoing G7 gathering presents continued headline risk as the respective leaders discuss a potential oil price cap for Russian crude. This comes after the group agreed on ban on fresh Russian gold imports, while Russia has seemingly been forced to default on payments surrounding two foreign-currency denominated bonds. Note that e-minis and oil more than reversed early losses as regional equity benchmarks rallied.
- A block buyer in FVU2 (+2.0K) headlined on the flow side during Asia-Pac hours.
- Looking ahead, the NY session will see the release of prelim. durable goods data, pending home sales and the latest Dallas Fed m’fing activity reading, in addition to 2- & 5-Year Tsy supply (owing to the holiday-shortened week).
JGBS: Bearish Steepening Seen
The weakness in JGB futures has extended through the afternoon, after the impetus from Friday’s cheapening in U.S. Tsys, coupled with a rally in domestic equities and a lack of a meaningful richening in core global FI markets allowed JGB futures to soften in the first half of Tokyo trade. An extension lower in wider core global FI markets has allowed the move in futures to accelerate during the Tokyo afternoon, with the contract last -21, a little above worst levels of the session. Cash JGBs run 0.5-4.0bp cheaper across the curve, with bear steepening in play. The summary of opinions from the BoJ’s latest monetary policy decision offered little in the way of actionable headline flow, while domestic news flow focused on supply/demand imbalances in the energy space. Looking head, 2-Year JGB supply headlines domestic matters on Tuesday.
AUSSIE BONDS: Cheaper As Tsys Soften
Aussie bonds have cheapened further on the back of a move lower in U.S. Tsys, leaving YM and XM 5.0 and 4.0 weaker, respectively, operating below their respective overnight session lows. The ACGB cash curve has bear steepened, with the major benchmarks running 5.0bp to 9.5bp cheaper across the curve as the long end leads the way lower, while bills have held on to earlier losses, last trading -4 to -6 through the reds.
- The latest round of ACGB Jun-51 supply was absorbed relatively smoothly, with the previously-flagged upsizing in supply accounting for the softer cover ratio (1.55x vs. 2.56x prev.). Pricing ultimately remained firm, with the weighted average yield printing 0.72bp through the prevailing mids (per Yieldbroker).
- There was little in the way of major news flow to digest after the Sydney open. A quick reminder that weekend news flow saw Australian Treasurer Chalmers stress that the cost of living crisis will get worse, while he suggested that the recent RBA communique re: inflation hitting the 7% level before the end of the year was in the right ballpark. Chalmers also seemed to support calls for the RBA board to be more representative of the wider Australian community.
- STIR markets continue to price in ~44bp of tightening for the July meeting, little changed on the day, with a cumulative ~240bp of tightening priced in for calendar ‘22.
- The local economic data docket is virtually empty tomorrow (weekly ANZ-Roy Morgan consumer confidence data is due), with retail sales expected to provide the first point of interest later this week on Wednesday.
FOREX: Yen Holds Lead As Rebound In E-Minis Fails To Spark Risk Recovery In G10 FX Space
Friday's recovery in risk appetite proved fragile as the Antipodeans paced losses while the yen outperformed. A turnaround in U.S. e-mini futures failed to entail a reversal of initial risk-off moves in G10 FX space.
- The summary of opinions from the BoJ's most recent monetary policy meeting, which echoed the Board's familiar train of thought re: inflation. One member said the Bank should pay "due attention" to FX market developments.
- USD/JPY 1-month risk reversal continued to lose altitude, declining for the fifth consecutive day, with bearish sentiment among options traders still firming.
- Regional risk barometer AUD/JPY was the big mover at the start to the week, virtually unwinding its advance from the prior trading day. Its 1-week implied volatility fell to the lowest point since Jun 2.
- Antipodean cross AUD/NZD shed a handful of pips despite a degree of tightening in AU/NZ 2-Year swap spread. Financial markets in New Zealand re-opened after a long weekend.
- A rebound in crude oil prices allowed the loonie to recover, even as the Antipodeans continued to lag.
- The U.S. dollar index (BBDXY) remained heavy, touching its lowest levels since Jun 16.
- Looking ahead, the U.S. will report pending home sales & flash durable goods orders today. Comments are due from ECB's Lagarde & Villeroy.
FOREX OPTIONS: Expiries for Jun27 NY cut 1000ET (Source DTCC)
- EUR/USD: $1.0445-55(E1.5bln)
- USD/JPY: Y135.00($603mln), Y137.00($550mln)
- USD/CAD: C$1.2920($835mln)
ASIA FX: USD/CNH Trying To Break 50-Day MA, PHP Depreciates Further
Most USD/Asia pairs are lower, in line with the risk on mood presented by equities. USD/CNH remains is trying to break below its 50-day MA though, while PHP continues to depreciate.
- CNH: USD/CNH has once again found support sub the 6.6800 level. Note the 50 day MA comes in at 6.6801 and we haven't been meaningfully below this level since mid-March. The pair is trying to break lower though. The USD/CNY fix came out in line with expectations. China/Hong Kong equities continue to push higher, although the rest of the region (for the most part) are also seeing positive gains as well.
- KRW: USD/KRW spot is down 1.3% at this stage to the 1282 level. Onshore equities continue to recover, with the Kospi up a further 2% today, while the Kosdaq has gained over 3%. The won can benefit from a further recovery in equity market sentiment.
- INR: USD/INR spot has opened back below 78.30, modestly down on last week's close. The 1 month NDF is steady at just under 78.50. Some slight loss of momentum for INR as oil has rebounded. Onshore equities have opened up +1% though.
- THB: An anaemic recovery attempt in spot USD/THB has been capped by comments from the BoT's quarterly analyst meeting, which stressed the need for timely adjustment of monetary policy to anchor inflation expectations. The BoT said that the baht may strengthen in the medium term as economic recovery gains traction. USD/THB is back sub 35.45, versus a recent peak just above 35.55.
- PHP: USD/PHP dips continue to be supported. We have pushed above 55.00, last at 55.13. BSP has ruled out a 'line in the sand' from a currency defence standpoint. The twin deficits continue to weigh.
- IDR: USD/IDR dipped back below 14800 before support emerged, last at 14801. The currency has benefited from better risk appetite and lower Fed tightening expectations. Onshore, the Finance Ministry said it was postponing the implementation of a new carbon tax scheduled to enter into force next month.
EQUITIES: Strong Start To The Week; Chinese And Hong Kong Stocks Extend Outperformance
Virtually all Asia-Pac equity indices are higher at typing, following a strongly positive lead from Wall St. The MSCI Asia-Pacific Index is on track for a third consecutive day of gains, with Chinese and Hong Kong equities leading the bid.
- The Hang Seng leads regional peers, dealing 3.2% firmer at typing, operating around fresh 12-week highs. Optimism surrounding China’s economic recovery from pandemic control measures is evident, with Shanghai’s leader declaring victory over COVID on Sunday as the city continues to ease measures laid down since March ‘22. Broad gains were observed across virtually every sub-index while China-based tech leads the bid, seeing the Hang Seng Tech Index sit 5.7% better off at typing.
- The Nikkei 225 trades 1.3% higher after opening in the green, shrugging off the latest round of JPY strength to hit fresh one-week highs at writing. Large-caps and commodity-related equities lead the bid, with electricity/utility stocks such as Tokyo Electric Power Company (+7.6%) outperforming after the government issued a power crunch advisory on Monday, raising expectations for higher power prices and corporate profits.
- The ASX200 sits 2.0% better off at writing, on track for a third straight session of gains, and its best daily performance since mid-May. Commodity and tech-related equities lead the bid with the S&P/ASX All Technology Index trading 2.9% higher, while the major miners and ‘Big 4’ Australian banks received strong bids as well.
- U.S. e-minis sit 0.1% to 0.5% firmer at typing, reversing earlier losses. NASDAQ contracts lead gains heading into European hours, tracking outperformance in high-beta names during the Asian session.
ASIA STOCKS: Can EM Asia Offshore Equity Outflows Recover?
Net equity outflows on the part of offshore investors continue to be a feature for EM Asia markets. However, there is now a reasonable wedge between these trends and the rebound in equity flow momentum for China markets seen over the past month.
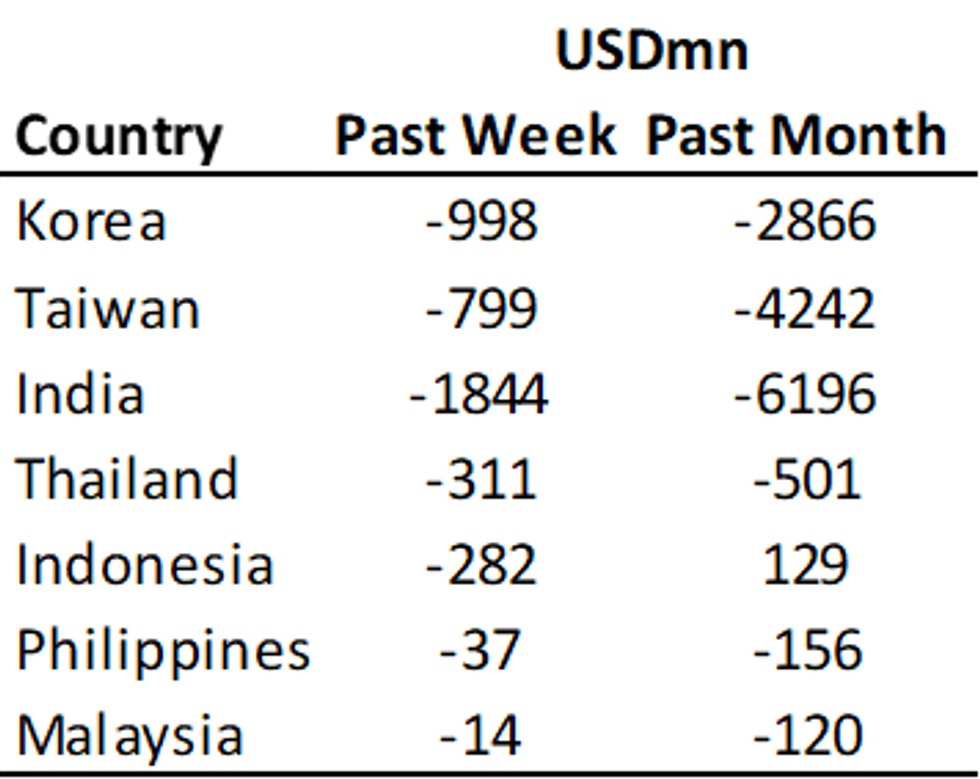
- Net outflows for the past week were strongest in India, although this is only data up to last Thursday (as the data is released with a lag). Next was South Korea and Taiwan. All other markets recorded net outflows, albeit in much smaller magnitudes in absolute terms.
- For the past month, net outflows have also been recorded in every market, except for Indonesia.
Table 1: Net Equity Flows For EM Asia Economies
 Source: MNI - Market News/Bloomberg
- Still, last week saw a reduced pace of net outflows compared with the previous week. In the week ending June 17th, we saw larger net outflows for all markets except Indonesia.
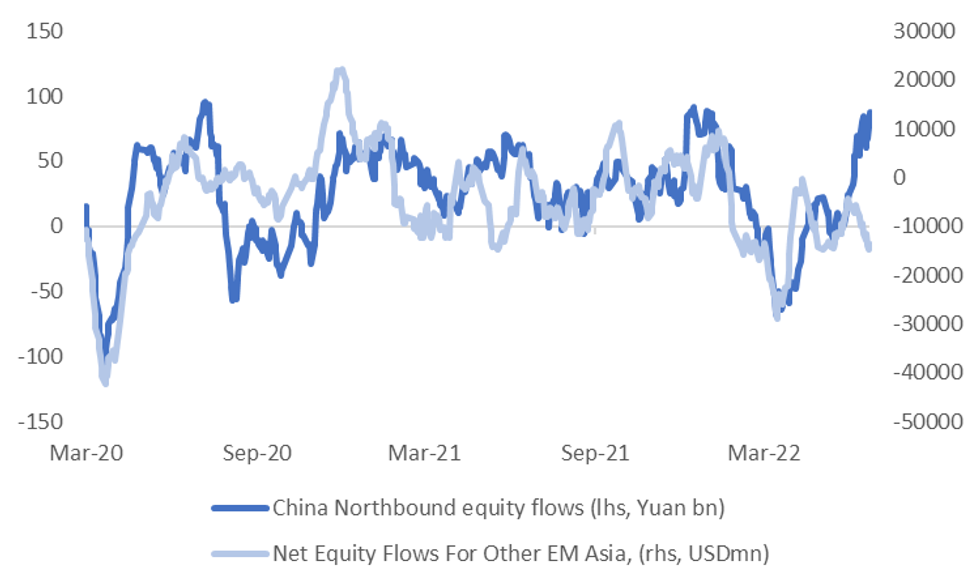
- The trend improvement in net inflow momentum for China equities suggests we can see an improved picture for the rest of EM Asia. The chart below plots the rolling monthly sum of net inflows for China via the stock connect schemes, against the aggregate sum of net inflows for the rest of EM Asia (namely - South Korea, India, Taiwan, Thailand Indonesia, Philippines and Malaysia).
- The two series share a reasonable correlation over the medium term. China inflows have been buoyed by a sense of easier policy settings, particularly compared to the major developed economies, coming out of Covid lockdowns, which should improve data flow and potentially less regulatory burden for tech sector.
- A better macro backdrop for China should aid inflow momentum into regional equities, all else equal. Of course, other factors e.g. a moderation in Fed tightening expectations and lower commodity prices, can also help.
- There is likely to be limits on how far equity flow sentiment can stabilise, with the threat of a US/global recession continuing to cast a shadow. However, a short term improvement in the flow picture can have positive flow-on effects to local equities and FX performance.
Fig 1: Net Equity Flows - China & The Rest Of EM Asia (Rolling Monthly Sums)
 Source: MNI - Market News/Bloomberg
GOLD: Light Bid On G7 Import Ban; Remains Unchanged For June
Gold sits ~$8/oz better off to print ~$1,835/oz at typing, operating just below session highs after paring opening gains.
- The move higher was facilitated by the G7 announcing intent to unveil an import ban on newly mined/refined Russian gold later this Tuesday, formally cutting supplies from the world’s second-largest gold producer. ~90% of all Russian gold went to G7 countries in ‘20.
- Moves in bullion were likely muted as Russian gold exports have been facing difficulties since Q2 ‘22 after the initial round of sanctions from the West, with trade data pointing to Russian exports of gold to the UK hitting 73kg in April (particularly after moves such as the London Bullion Market Association’s suspension of deliveries from Russian refineries in March).
- To recap Friday’s price action, gold closed ~$4/oz higher on Friday, with a downtick in U.S. real yields and the USD (DXY) providing support for the space. Bullion ultimately sits virtually unchanged in June however, with few drivers observed apart from ongoing debate re: a Fed-led economic slowdown.
- Bullion also sits comfortably off its mid-June lows ($1,805.2/oz on Jun 14), with U.S. real yields broadly backing away from cycle highs made then, while the USD (DXY) notched its first weekly loss in four weeks on Friday.
- From a technical perspective, previously outlined support and resistance levels remain intact at $1,787.0/oz (May 16 low) and $1,889.1/oz (trendline resistance from Mar 8 high) respectively.
OIL: Turning Bid; Chinese Demand On The Rise
WTI and Brent deal ~+$0.40 higher apiece at typing, operating within ~$1.00 of their respective best levels made on Friday. Both benchmarks have reversed losses near the open, with little by way of major, related headline drivers to explain the bid.
- Looking to China, a broad BBG analysis of early economic indicators has pointed to a limited improvement in China’s economy for June, centred around manufacturing and export-oriented industries.
- Keeping within China, electricity demand across the country is continuing to rise amidst an ongoing heat wave in at least 12 of the country’s 31 provinces and regions, adding to additional demand from the return of COVID-restricted industrial output.
- Top African oil producer Nigeria has pledged to meet OPEC+ production quotas by end-August, effectively representing a ~300K-500K bpd increase from current levels as per previous survey estimates and source reports.
- Ecuador has warned that the country’s ~500K bpd output (as of levels around May ‘22) is in danger of halting “in less than 48 hours” due to ongoing anti-government protests. Ecuadorian President Lasso has just announced the deployment of police and army resources to restore order, with the situation continuing to play out at typing.
UP TODAY (Times GMT/Local)
| Date | GMT/Local | Impact | Flag | Country | Event |
| 27/06/2022 | 0700/0900 | ** |  | ES | PPI |
| 27/06/2022 | 1230/0830 | ** |  | US | durable goods new orders |
| 27/06/2022 | 1400/1000 | ** | | US | NAR pending home sales |
| 27/06/2022 | 1430/1030 | ** | | US | Dallas Fed manufacturing survey |
| 27/06/2022 | 1530/1130 | * | | US | US Treasury Auction Result for 2 Year Note |
| 27/06/2022 | 1530/1130 | * | | US | US Treasury Auction Result for 26 Week Bill |
| 27/06/2022 | 1700/1300 | * | | US | US Treasury Auction Result for 13 Week Bill |
| 27/06/2022 | 1700/1300 | * | | US | US Treasury Auction Result for 5 Year Note |
| 27/06/2022 | 1830/2030 |  | EU | ECB Lagarde Opens ECB Forum | |
| 27/06/2022 | 1900/2100 | | EU | ECB Schnabel on Financial Stability at ECB Forum | |
| 27/06/2022 | 2230/1830 | | US | New York Fed President John Williams |
Why MNI
MNI is the leading provider
of intelligence and analysis on the Global Fixed Income, Foreign Exchange and Energy markets. We use an innovative combination of real-time analysis, deep fundamental research and journalism to provide unique and actionable insights for traders and investors. Our "All signal, no noise" approach drives an intelligence service that is succinct and timely, which is highly regarded by our time constrained client base.Our Head Office is in London with offices in Chicago, Washington and Beijing, as well as an on the ground presence in other major financial centres across the world.