
Why MNI
MNI is the leading provider
of intelligence and analysis on the Global Fixed Income, Foreign Exchange and Energy markets. We use an innovative combination of real-time analysis, deep fundamental research and journalism to provide unique and actionable insights for traders and investors. Our "All signal, no noise" approach drives an intelligence service that is succinct and timely, which is highly regarded by our time constrained client base.Our Head Office is in London with offices in Chicago, Washington and Beijing, as well as an on the ground presence in other major financial centres across the world.
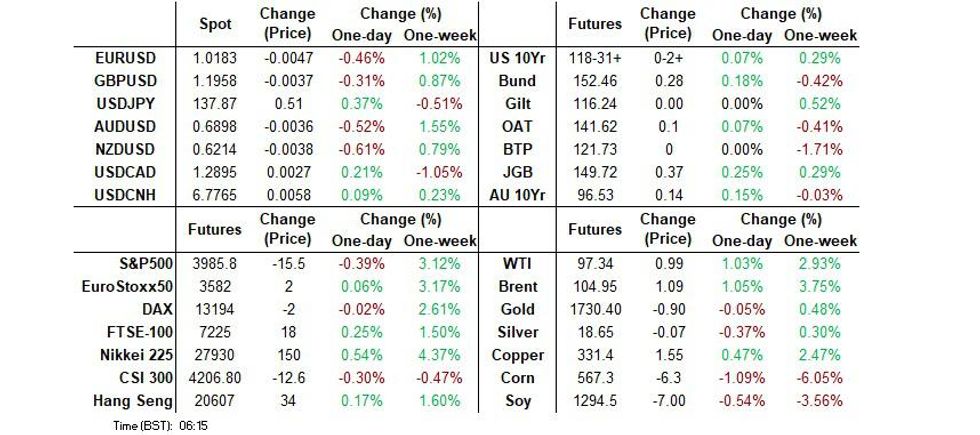
- Asia-Pac participants were happy to fade Thursday’s richening in Tsys, with the front end of the curve leading the weakness.
- U.S. e-mini futures faced some headwinds after Snap Inc. released a disappointing earnings report, while regional players parsed disappointing U.S. data released Thursday. This generated demand for traditional safe havens, but the yen had to give way to the greenback, with the USD aided by the aforemntioned bear flattening of the Tsy curve.
- Flash PMIs from across the globe will keep hitting the wires going forward, other data highlights include UK & Canadian retail sales. Elsewhere, ECB's Villeroy will speak on payments security.
US TSYS: Asia Fades Thursday’s Move
Asia-Pac participants were happy to fade Thursday’s richening. The early weakness extended as the major cash Tsy benchmarks run 2.5-5.0bp cheaper, with the front end leading the weakness and the early bear flattening of the curve holding. TYU2 last +0-02+ at 118-31+, 0-01+ off the base of its 0-08 range, operating on volume of ~90K (an uptick from what has been seen in recent sessions).
- As we noted earlier, the front-end led nature of the overnight move in Tsys would suggest to us that regional participants are happy to express faith in the continuation of the expeditious Fed tightening cycle at the levels that prevailed at the NY close, given the lack of meaningful macro headline flow observed thus far.
- A block sale of TY futures (-4K) headlined on the flow side during the overnight session..
- Weakness in in e-mini futures in lieu of a soft earnings print from Snapchat has been noted, with the NASDAQ 100 contract leading the way lower, last -0.7%, which may have provided some counter to the cheapening.
- Eurodollar futures run 2.0-4.5 lower through the reds.
- Flash PMIs from across Europe headline the broader docket ahead of Friday’s NY session, with the U.S. suite of flash Markit PMI prints set to headline the domestic docket.
JGBS: Futures Lead Space Higher On Breach Of Recent High
JGB futures shunted higher during the Tokyo morning, extending on their overnight bid, last +36.
- The move came as Japanese Finance Minister Suzuki reaffirmed the independence of the BoJ, while he flagged the need to monitor the downside risks that inflation poses to the Japanese economy. This wasn’t particularly new news, but the language deployed may have supported the space. Elsewhere, Chief Cabinet Secretary Matsuno highlighted the need to monitor downside risks to the economy.
- A break through the 7 July high for futures may provide a better explanation of the shunt higher, introducing a technical element to the bid, with the fact that 7s represent the joint-firmest point on the curve pointing to a futures driven move for JGBs on the whole (wider cash JGBs are flat to 3.5bp richer on the session)
- Elsewhere, weekly international security flow data pointed to the continued covering of short JGB positions by foreign investors.
- The latest liquidity enhancement auction covering off-the-run 5-15.5 Year JGBs saw firm pricing, with spreads firming vs. the previous auction (likely linked to demand for the CtD bond of JBU2 futures, as we flagged in our auction preview), while the spread tail narrowed a little. Elsewhere, the cover ratio came in at 3.66x, sharply lower vs. the high print observed in the last auction (6.15x), with short covering already well underway in the space after June’s BoJ meeting/defence of YCC (likely limiting wider demand at today’s auction). Note that this metric was below the six-auction average of 4.40x.
- Looking ahead, BoJ Rinban operations covering 1- to 25-Year JGBs headline the domestic docket on Monday.
AUSSIE BONDS: Off Best Levels But Comfortably Firmer
Aussie bonds have edged away from their extremes, having unwound a blip lower after Westpac’s Bill Evans revised guidance for the RBA’s terminal cash rate to 3.35% (prev. 2.60%), with the revised rate ultimately undershooting the rate of tightening priced into the market (IBs see a cash rate of ~3.40% by year end, per BBG WIRP). Cash ACGBs run 8.0-13.0bp richer across the curve, with the 7- to 12-Year zone leading the bid. YM and XM are +11.0 and +13.5, respectively, a little off best levels after bettering their respective overnight highs early on. Bills run 7 to 13 ticks richer through the reds, bull flattening.
- The latest round of ACGB Sep-26 supply went well, with the weighted average yield printing 1.65bp through prevailing mids (per Yieldbroker). The cover ratio ticked higher to 3.40x (albeit with a slightly smaller amount on offer), coming in above 3.00x and bettering the previous auction’s 3.28x, pointing to solid demand. The result builds on the recent strong run of shorter-dated ACGB auctions, supported by the stabilisation of Aussie bonds away from outright cycle cheaps.
- The AOFM issuance slate announced for next week will see a “reduced” A$1.3bn in ACGBs on offer (from the “usual” A$1.5bn), with the issuance of Notes moderating to A$2.0bn as well (from the “usual” A$2.5bn).
- Looking to next week, Monday will see A$300mn of the ACGB Mar-47 Bond on offer, while the domestic data docket is virtually empty, with Q2 CPI expected to provide the first point of interest on Wednesday.
JAPAN: Familiar Patterns Observed In Weekly International security Flow Data
The latest round of Japanese weekly international security flow data saw the eighth consecutive week of net selling of foreign bonds on the part of Japanese investors, while foreign investors were net buyers of Japanese bonds for a fourth consecutive week.
- The recent run of Japanese selling of foreign bonds is likely owing to increased market volatility and elevated hedging costs.
- Meanwhile, the run of net purchases of Japanese bonds by foreign investors points to continued covering of JGB shorts on the part of foreign investors after the BoJ doubled down on its defence of its current YCC settings in June, while stressing that it has no plan to alter its monetary policy settings at present. Note that the cumulative net purchases observed in the last 4 weeks are still ~Y1.1tn lower than the cumulative net sales observed in the 2 weeks prior to that run (when the international investor community was testing the BoJ’s will), pointing to continued space for foreign investors to cover recently established shorts.
- Note that both of the bond flow metrics are off of their respective recent extremes in weekly net terms.
- When it comes to equity flows, Japanese investors were net buyers of foreign equities for a fifth consecutive week, albeit at a reduced pace, while foreign investors were net buyers of Japanese equities for a second consecutive week, once again at a reduced pace.
| Latest Week | Previous Week | 4-Week Rolling Sum | |
|---|---|---|---|
| Net Weekly Japanese Flows Into Foreign Bonds (Ybn) | -919.6 | -1489.1 | -5422.0 |
| Net Weekly Japanese Flows Into Foreign Stocks (Ybn) | 321.7 | 688.1 | 2253.0 |
| Net Weekly Foreign Flows Into Japanese Bonds (Ybn) | 1753.5 | 2066.5 | 4817.4 |
| Net Weekly Foreign Flows Into Japanese Stocks (Ybn) | 476.0 | 526.4 | 93.0 |
FOREX: Greenback Outperforms Amid Reluctance To Take On Risk
U.S. e-mini futures faced some headwinds after Snap Inc. released a disappointing earnings report, while regional players parsed disappointing U.S. data released Thursday. This generated demand for traditional safe havens, but the yen had to give way to the greenback as U.S. Tsy yield curve bear flattened.
- USD/JPY recouped its initial losses, with good demand emerging over the Tokyo fix. Renewed buying of the spot rate was out of sync with the move lower in USD/JPY 1-month risk reversal, which pulled back from a multi-week high registered Thursday.
- Japan's CPI figures fell in line with expectations, with core prices posting the biggest one-month increase since Sep 2008 (when adjusted for the sales tax hike impact). While core CPI growth is above the BoJ's target of +2.0% Y/Y, the Bank continues to stress that current price pressures are being driven by supply-side factors rather than demand-pull matters.
- NZD paced losses in G10 FX space, which allowed AUD/NZD to climb past NZ$1.1100 and plumb a fresh multi-week high at NZ$1.1107 (y'day's peak was NZ$1.1106).
- The European FX bloc showed some weakness amid lingering concerns over Russian gas supplies & Italian political turmoil.
- Manufacturing PMIs from across the globe will keep hitting the wires going forward, other data highlights include UK & Canadian retail sales. ECB's Villeroy will speak on payments security.
FX OPTIONS: Expiries for Jul22 NY cut 1000ET (Source DTCC)
- EUR/USD: $1.0080-00(E1.4bln), $1.0140-50(E925mln), $1.0200-10(E562mln)
- USD/JPY: Y135.00($1.1bln), Y139.00($630mln), Y140.00($990mln)
- EUR/JPY: Y141.00(E485mln)
- AUD/USD: $0.6800(A$1.2bln), $0.6900(A$1.1bln)
- USD/CAD: C$1.2900($965mln), C$1.3000($602mln)
- USD/CNY: Cny6.7500($1.7bln), Cny6.8000($1.1bln)
AUD: Relative Data Momentum Still Helping A$ Outperformance
Relative data momentum remains in the AUD's favor. Amongst the major economies and other commodity currencies, Australia's Citi EASI reading is comfortably the highest, see the first chart below. This is likely helping A$ outperformance, which is second only to CAD within the G10 FX space over the past month in terms of spot returns. However, we remain mindful that global recession concerns can still influence the currency, particularly via the commodity price channel.
- Overnight, the much weaker than expected US Philly Fed survey sent the US Citi EASI tumbling, unwinding a chunk of the recent improvement. As the first chart below highlights, all the major economy EASIs are comfortably in negative territory.
- The resilience of the Australian EASI likely reflects less tightness in financial conditions (particularly compared to the US) and less idiosyncratic shocks (like the Ukraine conflict and the EU).
- This relative performance is also being reflected in yield differentials as well. The AU-US 2yr spread is back to -36bps, from recent wides at -60bps. The same holds against the other major economies, (EU, UK and JP), although we are below June highs in terms of the differential.
Fig 1: Major Economy & Commodity Currency Citi EASIs
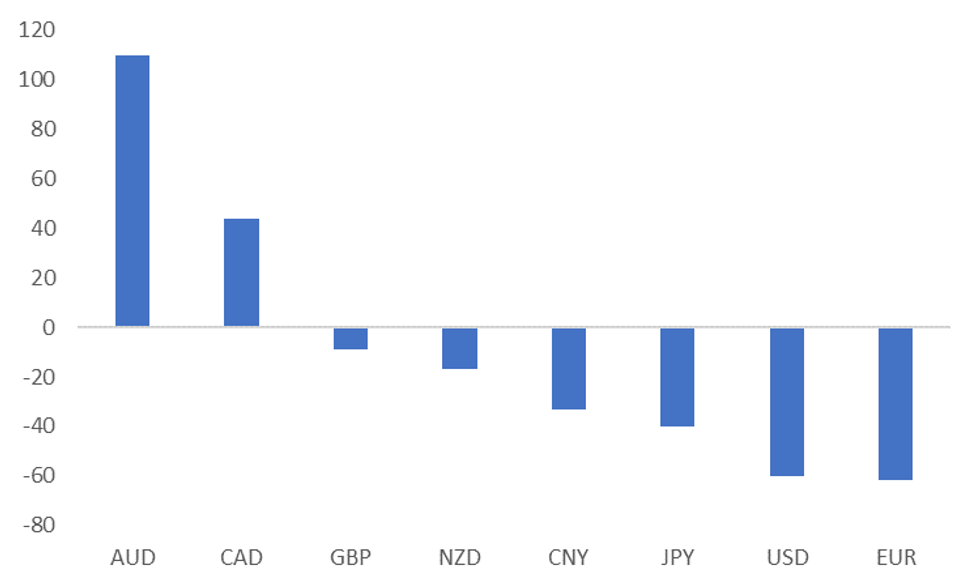 Source: Citi/MNI - Market News/Bloomberg
- Recessionary fears can still derail A$ outperformance. The second chart below plots the average EASI reading for the US, EU, JP and China, against the 3 month change in base metal prices. Weaker growth outcomes in the major economies should hurt cyclically sensitive commodities, all else equal.
- There is also a sense that AU data momentum could play some catch up to the downside, as domestic financial conditions tighten. Next week we get June retail sales data. This is likely to be overshadowed by Q2 CPI data though, which could still surprise on the upside given the recent experience in NZ, where Q2 inflation data was stronger than expected.
Fig 2: Major Economy EASIs & Base Metal Prices
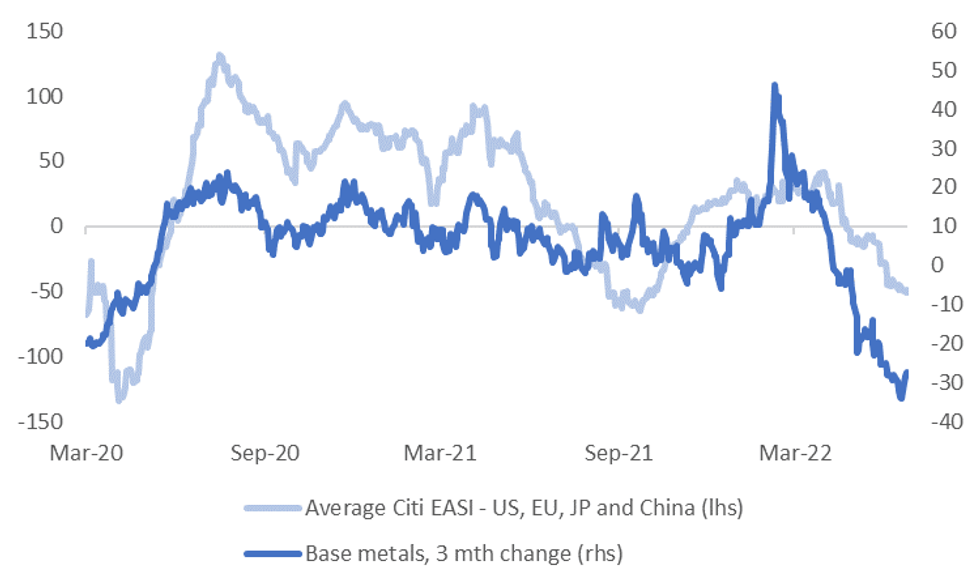 Source: Citi/MNI - Market News/Bloomberg
AUD/NZD: Attempting To Break Above 1.1100
AUD/NZD is attempting to break back above 1.1100. The pair probed above this level overnight but couldn’t sustain gains. A fresh break above this level would see us targeting the high 1.1100 region, last seen in June.
- Fundamentals are still pointing higher for the cross, although current levels look a little high relative to yield spreads. The chart below overlays AUD/NZD versus the 2yr swap spread. The divergence looks even larger against 2yr government bond spreads, although the gap is narrowing.
- Such a backdrop may hinder near term upside in AUD/NZD but dips are still likely to be supported. As we noted yesterday, the external account balance is heavily skewed in AUD's favor at present. Note the 50-day MA for the cross comes in at 1.1041.
- Next week's data will also help shape relative rate directions. The main focus will be on AU Q2 CPI (out Wednesday). Upside risks prevail given global trends and the firmer than expected Q2 prints in NZ, which still maintains a reasonable correlation with AU CPI data.
- The market consensus is for a further decent step up though - headline to 6.2% from 5.1% in Q1, 4.7% for the trimmed mean (the RBA’s preferred core measure) versus 3.7% last quarter.
- Retail sales for June on Thursday also print, while in NZ the focus will be on the ANZ business activity and confidence prints for July, which are out on Thursday.
- Underlying data momentum is still in AUD's favor. The Citi AU-NZ relative EASI differential is off record highs, but only marginally.
Fig 1: AUD/NZD & AU-NZ 2yr Swap Spread
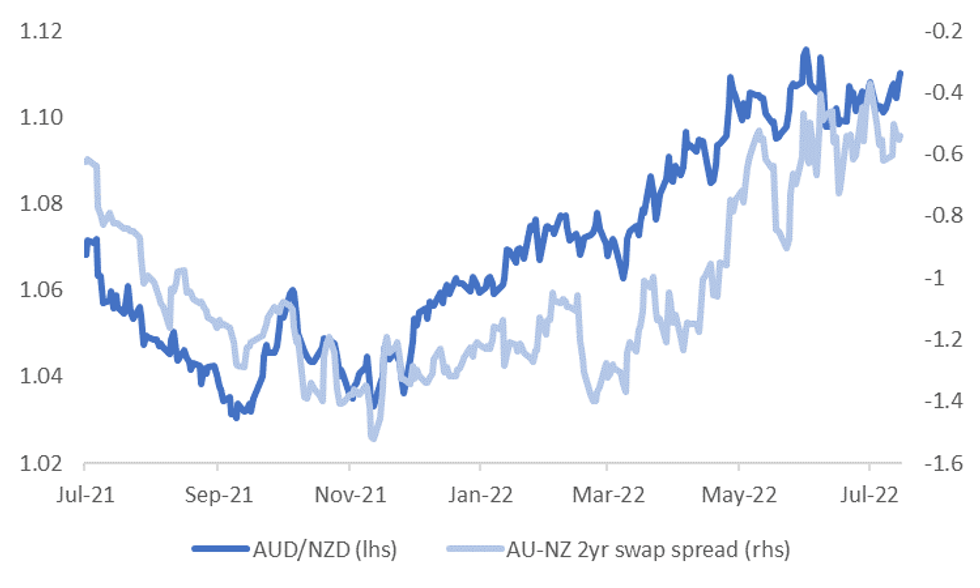 Source: MNI - Market News/Bloomberg
ASIA FX: A Mixed Session To Date, Despite A Firmer USD Elsewhere
A mixed session for USD/Asia pairs so far. USD/CNH remains rangebound, while USD/KRW is back above 1310 as equity sentiment softens. THB has seen some relief from BoT rhetoric, while USD/INR is holding below 80.00. These moves come despite a firmer USD against the majors.
- CNH: USD/CNH remains range bound. We haven't drifted too far away from the 6.7750 level. The CNY fixing was slightly weaker than expected, while onshore equities have struggled to gain any positive traction. CNH is outperforming broader USD strength though.
- KRW: USD/KRW has pushed back above 1310, in line with broader USD strength and a slightly softer tone to local equities. 1305/06 remains the recent base for now. Earlier, the PPI printed close to 10% YoY, highlighting underlying inflation pressures.
- INR: USD/INR is holding below 80.00, with onshore equities opening slightly higher. This week has seen just over $1bn in net inflows to local equities, bringing month to date flows almost back to flat.
- IDR: The rupiah went offered as Bank Indonesia kept its 7-Day Reverse Repo Rate unchanged late yesterday. More liquidity will be withdrawn though, Governor Warjiyo said the central bank will sell off ~IDR70tn of short-term government bonds to accelerate the absorption of excess liquidity. USD/IDR is down slightly today to 15023, versus yesterday's close of 15033.
- THB: Spot USD/THB nudged away from session highs as BoT Gov Sethaput dialled up the hawkish overtones in his rhetoric, pointing to the need to adjust monetary policy "near the normal level from super accommodative approach." We last traded 36.875, versus an earlier high above 36.91.
- SGD: USD/SGD is back above 1.3900, after dipping below this level late in NY trading. The SGD NEER continues to push higher though amidst broad USD strength. Next Monday's CPI data will be eyed, although most economists already expect a further tightening from the MAS at the October meeting.
EQUITIES: Cautiously Higher In Asia; Nikkei Hits Six-Week High
Major Asia-Pac equity indices are mostly higher at typing, following a positive lead from Wall St.
- The Nikkei 225 sits 0.5% better off, operating around freshly made six-week highs at typing, and on track for a sixth higher daily close. The tech and real estate sectors lead the way higher, countering losses in utilities and energy.
- The ASX200 sits 0.2% firmer at typing, reversing earlier losses as a steady rally in financials (+0.9%) eventually offset losses observed in commodity-related equities. The “Big 4” banks led by ANZ deal 0.5-3.3% firmer apiece, adding to gains observed in real estate and tech.
- The Hang Seng sits 0.2% better off at typing, trimming earlier gains of as much as 1.0%. A rise in the financials sub-index (+0.3%) narrowly neutralised losses in the utilities sub-gauge (-0.6%), while elsewhere, a strong bid in China-based tech in the wake of Didi’s ~$1.2bn fine on Thursday evaporated over the course of the session, with the Hang Seng Tech Index (+0.3%) back from its own highs of as much as +1.8%.
- The CSI300 has reversed earlier gains despite opening higher, dealing 0.2% weaker at writing. The IT sub-index underperformed, with the broader tech space contributing the most to the pullback in Chinese equities, seeing the ChiNext and STAR50 indices trade 0.6% lower apiece.
- E-minis deal 0.1-0.7% worse off apiece, maintaining relatively tight ranges throughout the session, with NASDAQ contracts leading losses in the wake of Snap Inc’s earnings disappointment.
GOLD: A Little Lower In Asia; Clinging To Post-ECB Gains
Gold deals ~$3/oz weaker to print ~$1,716/oz at typing, operating within a fairly limited ~$4/oz range since the re-open. The precious metal has edged away from Thursday’s best levels amidst an uptick in nominal U.S. Tsy yields, but holds on to the bulk of its post-ECB gains.
- To recap, gold closed ~$20/oz higher on Thursday, having reversed losses from fresh 15-month lows ($1,680.99/oz) made earlier in the session. The rebound was facilitated by the ECB’s larger-than-expected 50bp rate hike, with the USD (DXY) whipsawing between session highs and lows before closing lower on the day. Elsewhere, recession-related worry resurfaced as well, aiding some haven demand amidst the previously-flagged miss in Philly Fed expectations and weekly jobless claims coming in at eight-month highs.
- The move higher in gold on Thursday ultimately failed to breach highs witnessed earlier in the week ($1,723.9/oz, Jul 18 high), with debate continuing to focus on bullion’s vulnerability amidst recent Dollar strength, aggressive Fed expectations, and technical weakness.
- From a technical perspective, gold remains in a downtrend, with moving average studies continuing to point to bearish conditions. The yellow metal has successfully tested support $1,680.5/oz (1.764 proj of the Mar8-29-Apr18 price swing), and sits at a comparable distance to initial resistance at $1,745.4/oz (Jul 13 high).
OIL: Off Best Levels In Asia; Demand Worry Remains In Focus
WTI is ~+$1.20 and Brent is ~+$1.40, with both benchmarks edging away from their respective session highs after a ~$1.50 surge earlier, with that move higher potentially being a delayed reaction to reports of a disruption to the Canada-U.S. Keystone pipeline.
- To elaborate, BBG sources pointed to Keystone operator TC Energy reducing flows to the crude storage hub in Cushing (where WTI is delivered) by ~15% due to a “power supply glitch”, raising worry re: tightness in Cushing inventories.
- WTI and Brent have however come nowhere near challenging their respective best levels on Thursday, with the well-documented rise in recession-related worry on Thursday (particularly in the U.S. and EU) exacerbating concern from some quarters re: reduced energy demand.
- Elsewhere, Libyan crude output has risen above 700K bpd, short of the ~1.2mn bpd pre-crisis (keeping in mind the NOC had promised to restore production “within a week”, last Friday).
- Brent’s prompt spread continues to point to rising worry re: near-term crude supply, with the measure hitting ~$4.69 at typing, compared to ~$4.00 at the start of the week.
- Elsewhere, daily COVID case counts in China remain near two-month highs, with 880 reported for Thu vs. 826 for Wed. While the situation in major cities continues to stabilise, worry re: the country’s economic output remains elevated, with some participants likely eyeing industrial profit data next week, following warnings from the country’s steel industry earlier this week re: weak demand and other business challenges.
UP TODAY (Times GMT/Local)
| Date | GMT/Local | Impact | Flag | Country | Event |
| 22/07/2022 | 0600/0700 | *** |  | UK | Retail Sales |
| 22/07/2022 | 0715/0915 | ** |  | FR | IHS Markit Services PMI (p) |
| 22/07/2022 | 0715/0915 | ** | | FR | IHS Markit Manufacturing PMI (p) |
| 22/07/2022 | 0730/0930 | ** |  | DE | IHS Markit Services PMI (p) |
| 22/07/2022 | 0730/0930 | ** | | DE | IHS Markit Manufacturing PMI (p) |
| 22/07/2022 | 0800/1000 |  | EU | ECB Survey of Professional Forecasters | |
| 22/07/2022 | 0800/1000 | ** | | EU | IHS Markit Services PMI (p) |
| 22/07/2022 | 0800/1000 | ** | | EU | IHS Markit Manufacturing PMI (p) |
| 22/07/2022 | 0800/1000 | ** | | EU | IHS Markit Composite PMI (p) |
| 22/07/2022 | 0830/0930 | *** | | UK | IHS Markit Manufacturing PMI (flash) |
| 22/07/2022 | 0830/0930 | *** | | UK | IHS Markit Services PMI (flash) |
| 22/07/2022 | 0830/0930 | *** | | UK | IHS Markit Composite PMI (flash) |
| 22/07/2022 | 1230/0830 | ** |  | CA | Retail Trade |
| 22/07/2022 | 1230/0830 | ** | | CA | Retail Trade |
| 22/07/2022 | 1345/0945 | *** |  | US | IHS Markit Manufacturing Index (flash) |
| 22/07/2022 | 1345/0945 | *** | | US | IHS Markit Services Index (flash) |
Why MNI
MNI is the leading provider
of intelligence and analysis on the Global Fixed Income, Foreign Exchange and Energy markets. We use an innovative combination of real-time analysis, deep fundamental research and journalism to provide unique and actionable insights for traders and investors. Our "All signal, no noise" approach drives an intelligence service that is succinct and timely, which is highly regarded by our time constrained client base.Our Head Office is in London with offices in Chicago, Washington and Beijing, as well as an on the ground presence in other major financial centres across the world.