
Why MNI
MNI is the leading provider
of intelligence and analysis on the Global Fixed Income, Foreign Exchange and Energy markets. We use an innovative combination of real-time analysis, deep fundamental research and journalism to provide unique and actionable insights for traders and investors. Our "All signal, no noise" approach drives an intelligence service that is succinct and timely, which is highly regarded by our time constrained client base.Our Head Office is in London with offices in Chicago, Washington and Beijing, as well as an on the ground presence in other major financial centres across the world.
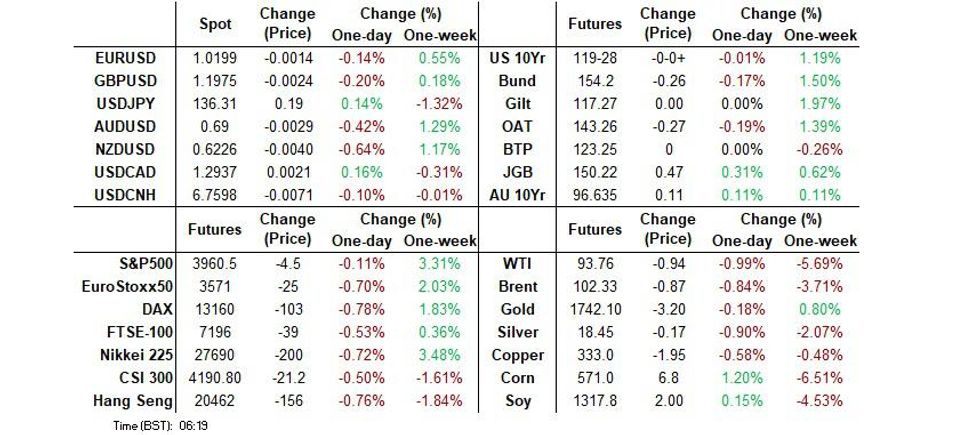
- U.S. Tsy yields nudged higher for a second consecutive Asia-Pac session, once again countering the trend seen in the prior European/NY session.
- Equities were generally lower overnight, with Russia & Sino-U.S. worry evident, although reports pointing to potential state-based support for the Chinese property sector limited losses.
- The latest German Ifo Survey and regional Fed activity readings take focus on the data front, after a data-light Asia session.
US TSYS: A Little Cheaper In Asia
TYU2 hovers around the middle of its 0-11 overnight range, last dealing -0-00+ at 119-28, on sub-par volume of ~75K, while cash Tsys run 2.0-3.5bp cheaper across the curve.
- Early Asia trade saw regional participants sell Tsys on the back of a rally in European/NY hours for a second consecutive session, which could suggest that the regional impulse has been dominated by profit taking on existing long positions over the past couple of sessions, as opposed to an attempt to fade the richening, given the degree of the pull lower in yields in pre-Asia trade.
- Modest losses for crude oil futures (which more than reversed the early uptick), coupled with a downtick for equities and continued focus on the recession-related risks (which drove Friday’s bid in core global FI markets, in lieu of soft European and U.S. PMI data) then took the edge off the initial cheapening, even with the White House continuing to play down any such fears. Meanwhile, subsequent talk of potential support for the Chinese property sector limited the downtick in wider equity indices.
- Elsewhere, weekend headline flow focused on simmering Sino-U.S. tensions surrounding Taiwan and a Russian missile attack on the port of Odesa, which came hours after the two countries agreed a pact to allow Ukraine to export grain (note that this particular attack wouldn’t breach that pact, if Russia’s suggestion that it was targeting naval hardware prove to be true).
- Overnight flow was dominated by a block buyer of TY futures (+3.3K).
- Looking ahead, the NY calendar is headlined by regional Fed activity indices from Chicago & Dallas, along with 2-Year Tsy supply.
JGBS: Off Best Levels, New BoJ Board Members Set To Speak
JGBs operate shy of best levels, after JGB futures failed to force a break of the overnight session high.
- Local headline flow has been light thus far, leaving wider core FI dynamics since Friday’s Tokyo close and the unwind of an early uptick in crude futures at the fore.
- Futures sit +45 vs. Friday’s settlement, ~20 off their Tokyo peak. Cash JGBs run little changed to ~3.5bp richer on the day, after playing catch up to Friday’s richening in wider core global FI markets, with swaps lagging across the curve, resulting in a widening of swap spreads.
- The details of BoJ Rinban operations covering 1- to 25-Year JGBs may have provided some pressure on the 10- to 25-Year zone of the curve, given the uptick in offer/cover in that bucket.
- 10-Year JGB yields briefly showed below 0.18%, hitting the lowest level observed since March in the process, given the BoJ’s YCC parameters a little more breathing room.
- The BoJ has flagged an impending address from new board members Takata & Tamura (17:00 Tokyo/09:00 London). As noted by our policy team in their most recent insight piece, Takata, most recently an economist at brokerage Okasan Securities, has previously voiced concern over side-effects of powerful monetary easing, although he is expected to side with current policy settings at the upcoming BoJ decisions. Meanwhile, Tamura, most recently a senior adviser at Sumitomo Mitsui Banking Corp, has reportedly voiced concern on the BoJ’s bond market operations distorting markets, but is also likely to support Kuroda when it comes to maintaining easy policy through the end of the Governor’s term.
AUSSIE BONDS: Richer, But Off Best Levels
Aussie bonds deal shy of best levels, with a modest downtick in U.S. Tsys applying some pressure, although ACGBs have held on to the bulk of gains made after catching up to Friday’s recession worry-driven richening in core global FI markets. Cash ACGBs run 7-11bp richer across the curve, with the belly leading the bid. YM and XM are +9.5 & +11.0, respectively, after failing to challenge their overnight session peaks. Bills run 6 to 11 tick richer through the reds, bull flattening.
- The latest round of ACGB-47 supply went smoothly, with the weighted average yield printing 2.22bp through prevailing mids (per Yieldbroker). The cover ratio improved to 2.46x (from 2.09x prev.), although the low frequency at which the line is issued (last auction in Dec ‘19) may limit the usefulness of comparisons to past results. The earlier-flagged, easily-digestible DV01 and inversion in the ACGB Mar-47/Jun-51 spread likely contributed to the smooth auction, adding to tailwinds from the broader stabilisation in Aussie bonds from outright cycle cheaps.
- The domestic data docket and RBA speaker slate is empty on Tuesday, with Q2 CPI expected to provide the first point of interest for the week when it crosses on Wednesday.
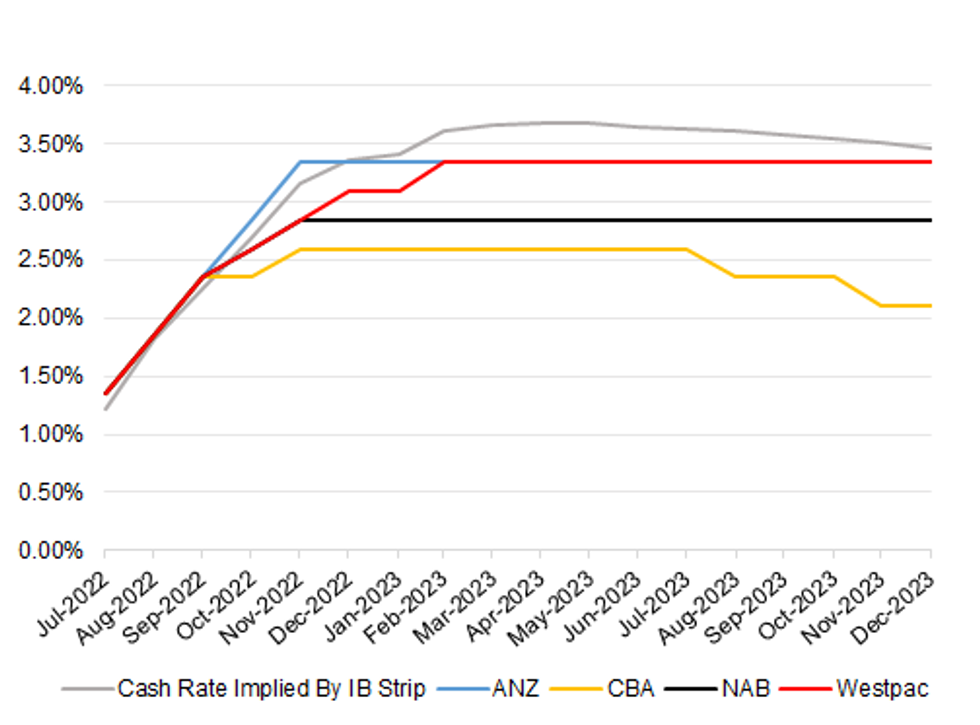
RBA: Big 4 Views Vs. Market Pricing
After the latest round of hawkish adjustments to the RBA views held by the Big 4, ANZ have the most aggressive hiking view, at least in the immediate term (with their view briefly outstripping what is priced into markets at present, based on IB strip settlement levels at Friday’s close), given that they now look for a further 4 consecutive 50bp rate hikes through November before an elongated pause. This still leaves their terminal rate assumption below that portrayed in wider market pricing. Westpac’s hiking cycle assumptions eventually catch up with ANZ’s, after lagging in the period between the September and February decisions, with an equal terminal rate projection.
- Further out, CBA are the only one of the big 4 with cuts pencilled into their projections before the end of ’23 and also have the shallowest terminal rate assumption (2.60%), which they still deem to be comfortably above their assessment of neutral (1.60%). Meanwhile, Westpac look for 100bp of cuts in ’24 (beyond the forecast horizon provided in the chart). Elsewhere, NAB note that “a combination of below trend growth and inflation moving back to target over 2023 and into 2024, as in our forecasts, raises the possibility of rate cuts at some point in 2023 or 2024,” although their official forecast track has no cuts pencilled in through its horizon. Meanwhile, the IB strip was pricing in circa 22bp of easing in its ’23 cash rate profile, from peak rate to post-peak trough, as of Friday’s close. A reminder that terminal pricing re: the RBA's current tightening cycle operates well shy of its cycle peak at present.
- A reminder that last week saw RBA Governor Lowe stress that the Bank will do what is necessary when it comes to anchoring inflation expectations, with the Bank set to steadily raise interest rates, while he noted that the cash rate will reach the “neutral” level at some point (which he noted sits at 2.50%, at a minimum). This came after Deputy Governor Bullock pointed to a neutral real cash rate of 0.5-1.5% (which equates to 2.5-3.5% in nominal terms when referencing the lower boundary of the Bank’s inflation target range, and 3.0-4.0% when using the mid-point of the range).
- Domestic Q2 CPI data & the latest monetary policy decision from the U.S. Federal Reserve (both due Wednesday) provide the meaningful risk events for participants and economists to digest this week. With the tight labour market, inflation dynamics and supersized rate hikes deployed by some of the RBA’s global counterparts cited as potential trigger points for larger than 50bp moves from Martin Place.
 Source: MNI - Market News/ASX/Bloomberg
FOREX: Antipodeans Sag In Cautious Asia-Pac Trade
The week in Asia started on a cautious note, as lingering recession fears and geopolitical backdrop dented sentiment, with U.S. e-mini futures operating in negative territory.
- The greenback outperformed as U.S. Tsy yields firmed. That said, the U.S. dollar index (BBDXY) pared most of its initial gains.
- USD/JPY gave away the bulk of its initial gains after the Tokyo fix but managed to stay in positive territory. U.S./Japan 10-year yield spread widened by ~6bp, moving away from one-month narrows touched last Friday.
- The Antipodeans went offered amid broader aversion to risk. AUD/USD staged a brief foray below the $0.6900 mark before trimming losses. AUD/NZD crept higher in tandem with Australia/New Zealand 2-year swap rate gap.
- The European FX bloc traded on a slightly firmer footing, with sterling lagging its regional peers.
- German Ifo Survey will take focus after the data-light Asia session.
FX OPTIONS: Expiries for Jul25 NY cut 1000ET (Source DTCC)
- EUR/USD: $1.0200(E641mln), $1.0250(E1.8bln)
- USD/JPY: Y134.20($550mln)
- AUD/USD: $0.6750(A$1.1bln), $0.6950-55(A$910mln), $0.7000(A$1.1bln)
- NZD/USD: $0.6100(N$651mln)
- USD/CAD: C$1.3010($700mln), C$1.3100($530mln)
- USD/CNY: Cny6.7500($2.2bln)
AUDJPY: AUD/JPY Correlations With Global Equities & Commodities Low By Historical Standards
AUD/JPY dipped sub 94.00 earlier before support emerge. The pair was last just under 94.10. The pair is around 2% off recent highs but still well above early July lows sub 91.50. At face value, AUD/JPY still looks too high relative to the evolution of global commodity and equity prices.
- However, as the table below shows, the recent correlations between AUD/JPY and these macro drivers hasn't been that high. Note these correlations are level based and are calculated for 1,3 and 6 month tenors.
- We have seen some pick up in correlation with global equities over the past month, but the more consistent correlation is with the 2yr AU-JP yield differential. i.e. carry trade related trends have been a more important driver of this cross.
- Even this most recent dip in AUD/JPY has been strongly correlated with relative yield momentum.
- During historical recession episodes AUD/JPY's correlation with global equities and commodities is typically much higher. We were well above 90% during the height of the covid pandemic and very high as well in 2008.
- There are of course differences in the current environment, with Australia's terms of trade outperformance relative to Japan, which is clearly aiding higher AUD/JPY levels.
- Still, in the current environment, if recession fears intensify, we would expect AUD/JPY correlations to rise with the likes of equities and commodity prices.
Table 1: AUD/JPY Correlations
| Tenor | Global Commodities | Base Metals | Global Equities | AU-JP 2yr Spread |
| 1 mth | 0.32 | -0.10 | 0.66 | 0.86 |
| 3 mth | -0.22 | -0.31 | -0.08 | 0.47 |
| 6 mth | 0.42 | -0.27 | -0.48 | 0.87 |
ASIA FX: Resilient Start To The Week
For the most part, Asian FX has outperformed stronger USD sentiment seen against the majors. Weaker equities also haven't impact sentiment a great deal, although weakness has been far from uniform in the equity space.
- CNH: USD/CNH has drifted lower today, but only modestly. The pair is back sub 6.7600, despite softness in onshore equities. The fixing was also modestly weaker than expected. We have seen CNH outperforming broader USD strength elsewhere, although these trends have reversed somewhat through the afternoon session.
- KRW: USD/KRW is lower. Spot is down 0.30% from last week's close to be tracking just under 1309. Local equities are higher by +0.75% at this stage, which is helping, as is lower USD/CNH levels. On the downside support has been evident recently at 1305/06, so that level will be watched.
- TWD: USD/TWD has drifted a little lower in spot terms, last at 29.90, little fazed by geopolitics from the weekend. The FT reported that "China has issued stark private warnings to the Biden administration about the upcoming trip to Taiwan by Nancy Pelosi," which were "significantly stronger than the threats that Beijing has made in the past." Senior U.S. security officials are known to be opposing the trip amid concerns that it could aggravate tensions with Beijing.
- INR: USD/INR is down slightly from last week's closing levels. Last at 79.83. Onshore equities are down slightly in early trade, off by 0.4%. RBI Governor Das's defence of the rupee last Friday may be working to calm market sentiment to a degree. FX reserve data released on Friday also showed a sharp drop in FX reserves to $572.7bn for mid July (a $7.5bn drop).
- THB: Spot USD/THB is around 0.15% higher versus last week's close, currently sitting at 36.75. PM Prayuth and 10 Cabinet ministers survived co confidence votes in parliament on Saturday. This gives the government some breathing space, with no more censure debates planned ahead of the general election that should take place early in 2023.
- PHP: The peso is slightly firmer. USD/PHP is back to 56.23. President Marcos is preparing to deliver his first State of the Nation Address later today. Ahead of the key policy address, Marcos announced his decision to keep Rosalia de Leon as the Treasurer and formally appoint Raphael Lotilla as Energy Secretary.
CNH: Back To Outperforming On Global Recession Fears?
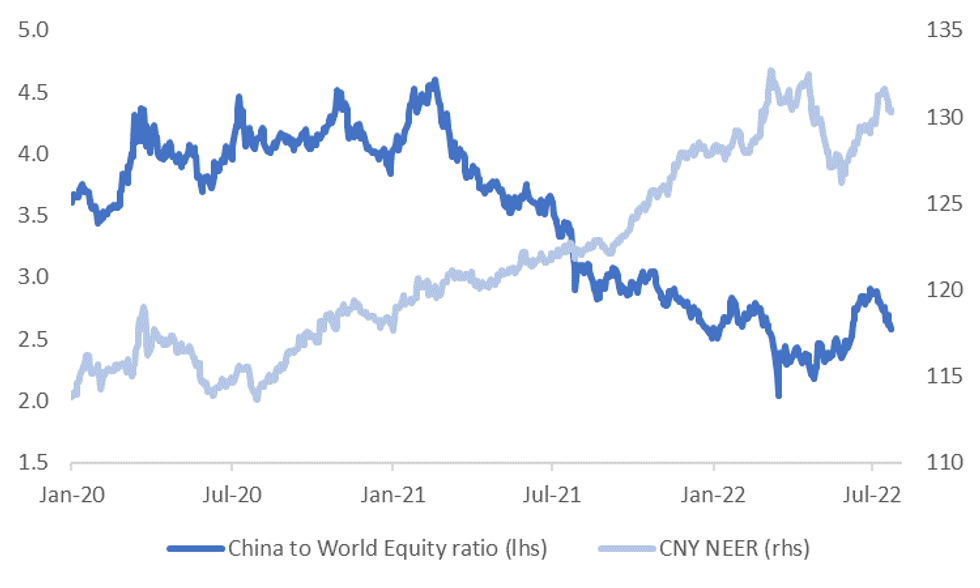
The CNY NEER has fallen just over 1% from its recent peak. The first chart below plots the CNY NEER and the ratio of China equity performance to global equity performance. Through much of July China equities have unperformed the rest of the world trend. This also caught up with CNY FX performance. As we outline below though, these relative trends could start to stabilize reverse somewhat.
Fig 1: CNY NEER & China Relative Equity Market Performance
 Source: MNI - Market News/Bloomberg
- If recessionary fears become a dominant theme in global markets there is certainly scope for these underperformance trends, in terms of relative China asset performance, to stabilize/reverse somewhat.
- To be sure, there are certainly clouds over the China growth outlook given the continued dynamic covid zero strategy. There is also concern around the housing sector, particularly in relation to mortgage repayments.
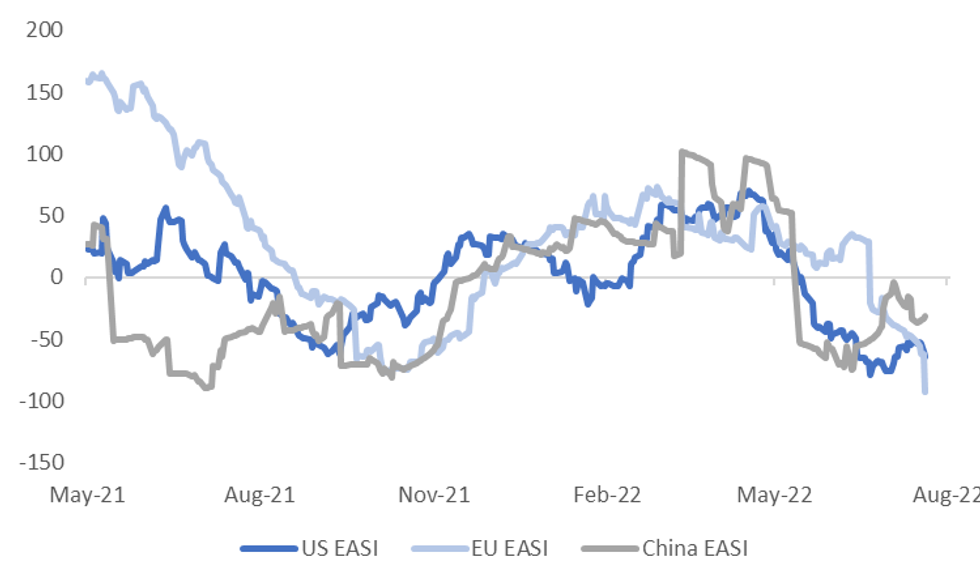
- Still, data momentum is moderating faster in the EU and US, at least according to Citi EASIs, see the see second chart below. At the margin, stimulus efforts in China could help as well, notwithstanding the challenges outlined above.
- If such trends continue, CNH may outperform in the FX space against higher beta plays and the EUR. Performance against the JPY is less clear given its historical outperformance during global recessionary periods.
- This Sunday's China PMI prints will be the next key update in terms of relative data trends. The market is forecasting resilient outcomes at this stage (manufacturing at 50.4 versus 50.2 in June, 53.9 for non-manufacturing versus 54.7 last month), particularly relative to the EU and US trends from late last week.
Fig 2: Relative Citi EASIs
 Source: Citi/MNI - Market News/Bloomberg
EQUITIES: Lower In Asia On Underperformance In Tech; U.S. Large-Cap Earnings Eyed
Major Asia-Pac equity indices sit flat to 0.8% lower at typing amidst underperformance from high-beta equities region wide, tracking a similar performance on Wall St. (particularly tech and advertising after Snap’s 39% plunge on Friday).
- The CSI300 sits 0.8% weaker, hitting fresh six-week lows at typing. The overall move lower comes despite a bid in the real estate sector, with the CSI300 Real Estate Index adding 1.9% at writing, with the richly-valued consumer staples and healthcare sub-indices leading the way lower.
- The Hang Seng deals 0.8% worse off, with gains in the property sub-gauge (+1.5%) unable to offset weakness in China-based tech. The Hang Seng Tech Index sits 2.2% weaker, dragged lower by Chinese EV stocks and tech large-caps, with the selloff coming despite FT source reports pointing to China planning a three-tiered strategy to avoid U.S. de-listings.
- The Nikkei 225 deals 0.7% lower at typing, on track to snap a six-session streak of higher daily closes. Major exporters and the IT sector struggled, with the negative lead from U.S. tech weighing on sentiment.
- The ASX200 trades virtually unchanged at typing in a relatively tepid session (perhaps ahead of Wednesday’s Q2 CPI print), seeing steep losses in tech (S&P/ASX All Tech Index:-1.4%) offset gains in the materials sub-gauge.
- E-minis sit flat to 0.1% worse off at typing, a little off their respective lows made on Friday.
- A busy week beckons for equities - 175 companies on the S&P500 will report earnings, headlined by large-caps including Apple, Amazon, and Microsoft. The Fed’s FOMC decision is due on Wed, while U.S. Q2 Advanced GDP will cross on Thu, followed by PCE data on Friday.
GOLD: A Little Lower In Asia
Gold sits ~$2/oz weaker at typing to print ~$1,725/oz, rising off session lows as nominal U.S. Tsy yields have come off of their earlier highs. The precious metal has struggled to rise above neutral levels in Asia after closing firmer for the first week in six last Friday, with that move higher aided by a pullback in Fed rate hike expectations from their mid-July, U.S. CPI-inspired extremes.
- To recap, gold initially surged to one-week highs on Friday (at $1,739.3/oz) after the U.S. services flash PMI printed below expectations (while also entering contractionary territory), before paring gains to close ~$10/oz higher.
- Gold however remains on track for a fourth straight monthly loss, with well-documented recession-related worry (particularly in the U.S. and Europe) countered by expectations of Fed hawkishness amidst persistently high inflation, and the USD (DXY) continuing to operate at historically elevated levels.
- July FOMC dated OIS now price in ~82bp of tightening for that meeting (off its mid-July peak ~93bp), pointing to ~30% odds of a 100bp move, while a cumulative ~181bp is priced in through to Dec ‘22 (against >210bp on Jul 14).
- From a technical perspective, gold’s move higher on Friday approached initial resistance at $1,745.4/oz (Jul 13 high). A breach of that level would expose further resistance at ~$1,764.0/oz (20-Day EMA), while on the downside, initial support is situated at $1,697.7 (Jul 14 low).
OIL: Lower In Asia As Demand Outlook In Focus
WTI and Brent are ~-$0.70 worse off apiece, with the former operating a shade below its Friday trough at typing. The move lower comes as participants in Asia react to the mix of disappointing PMIs out of Europe and the U.S., with the latter’s flash services PMI dipping into contractionary territory for the first time in nearly two years, exacerbating recession fears from some quarters ahead of this week’s FOMC, where a 75bp hike (or larger) may heighten expectations of reduced economic activity and energy demand.
- Daily COVID case counts in China have ticked lower (680 cases for Sun vs. 869 for Sat, with major cities continuing to report low case counts.
- Turning to oil supply concerns, the Canada-U.S. Keystone pipeline resumed normal operations over the weekend, restoring previously-reduced supply to the crude storage hub of Cushing.
- Elsewhere, Libya’s state oil operator reported on Friday that crude output has hit ~860K bpd, while pledging that “full” oil production (~1.2mn bpd) would be achieved within two weeks. Keeping within the country, deadly militia-led clashes were reported in the capital over the weekend and may be worth monitoring given the political bent of previous disruptions to crude production.
- Crude remains steeply backwardated, pointing to worsening tightness in near-term supply, with Brent’s prompt spread sitting at ~$4.97 at typing.
UP TODAY (Times GMT/Local)
| Date | GMT/Local | Impact | Flag | Country | Event |
| 25/07/2022 | 0800/1000 | *** |  | DE | IFO Business Climate Index |
| 25/07/2022 | 1000/1100 | ** |  | UK | CBI Industrial Trends |
| 25/07/2022 | 1300/1500 | ** |  | BE | BNB Business Sentiment |
| 25/07/2022 | 1430/1030 | ** |  | US | Dallas Fed manufacturing survey |
| 25/07/2022 | 1530/1130 | * | | US | US Treasury Auction Result for 26 Week Bill |
| 25/07/2022 | 1530/1130 | * | | US | US Treasury Auction Result for 13 Week Bill |
| 25/07/2022 | 1700/1300 | * | | US | US Treasury Auction Result for 2 Year Note |
Why MNI
MNI is the leading provider
of intelligence and analysis on the Global Fixed Income, Foreign Exchange and Energy markets. We use an innovative combination of real-time analysis, deep fundamental research and journalism to provide unique and actionable insights for traders and investors. Our "All signal, no noise" approach drives an intelligence service that is succinct and timely, which is highly regarded by our time constrained client base.Our Head Office is in London with offices in Chicago, Washington and Beijing, as well as an on the ground presence in other major financial centres across the world.