
Why MNI
MNI is the leading provider
of intelligence and analysis on the Global Fixed Income, Foreign Exchange and Energy markets. We use an innovative combination of real-time analysis, deep fundamental research and journalism to provide unique and actionable insights for traders and investors. Our "All signal, no noise" approach drives an intelligence service that is succinct and timely, which is highly regarded by our time constrained client base.Our Head Office is in London with offices in Chicago, Washington and Beijing, as well as an on the ground presence in other major financial centres across the world.
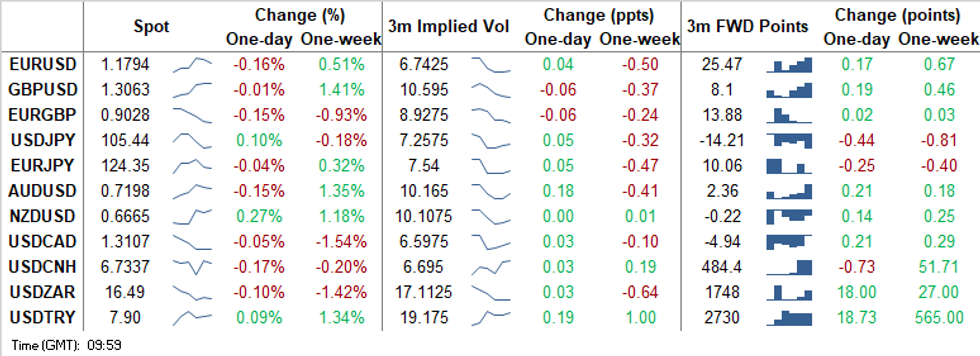
FOREX SUMMARY
A touch lower Cash Equity open, pushed the Futures lower this morning, helping the USD retain its overnight bid.
- USD is trading on the front foot a continuation from the Asian session, against most majors.
- Scandies, saw EURSEK jumps 1.5 big figures following the CPI miss, and the pair tested yesterday's high at 10.4162 (printed 10.4128 high).
- SEK has since recovered, as Equities lack clear downside momentum, bringing EURSEK below pre CPI data at 10.3750.
- AUD hovers around the figure at 0.7200, after seeing some selling pressure, following overnight concerns between Australia and China on Coal imports.
- Once again today, worth keeping an eye on FX expiry, which could act as a magnet for today's session, with 1.09bn worth of expiry between 0.7200-0.7220
- GBP has been mixed in early trading, mainly taking its cue from the USD moves, as investors and market participants wait on Brexit, news.
- CEE FX sees CZK losing ground against the Greenback, on Covid concerns for the country.
- USDCZK is up 0.65% at 23.1617.
- Looking ahead, Earning season begins for Q3, with JPM, J&J and Citi expected today.
- On the data front, US CPI is the highlight, while BoE Bailey, ECB de Cos, Riksbank Ingves and Fed Barkin are the scheduled speakers
EUR/USD: Bulls Pause for Breath
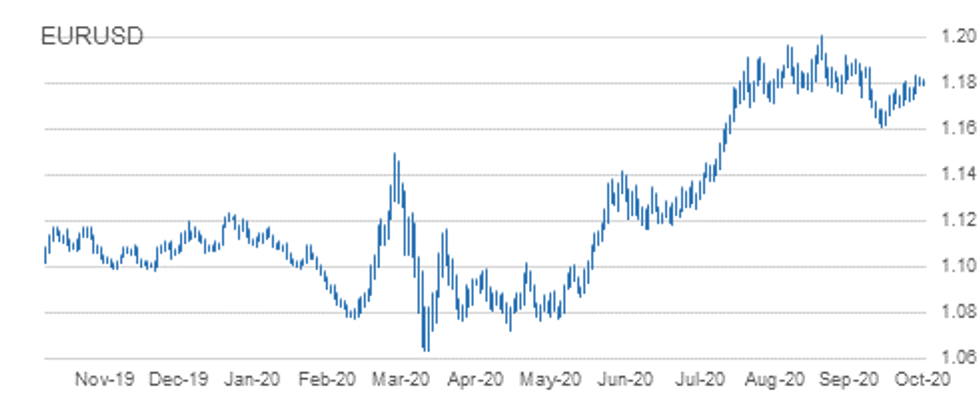
EURUSD trend remains up:
- Our intraday trend direction reading is pointing up. The signal was confirmed Sep 29.
- Levels below 1.1785 represent an area where support would be expected to materialise - the "buy-zone".
- At the extreme level, the key intraday support lies at 1.1725, Oct 6 low.
- The bull trigger is 1.1831, Oct 10 high.
GBP/USD: Holding Onto Gains
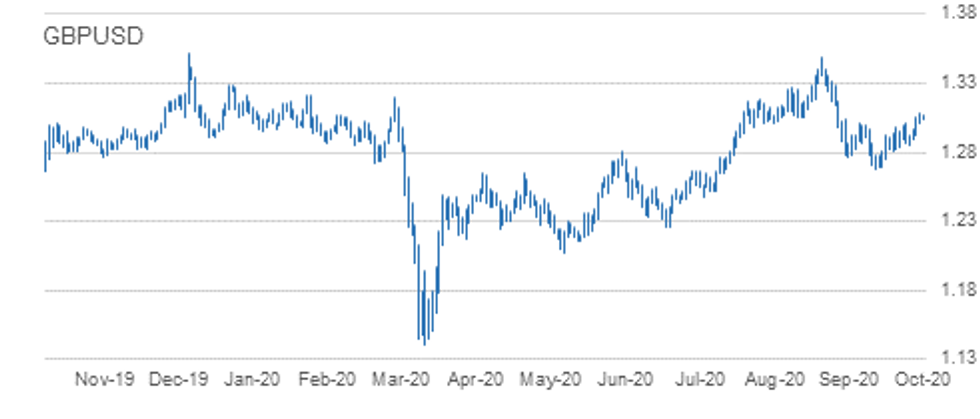
- RES 4: 1.2280 High Sep 7
- RES 3: 1.3174 61.8% retracement of the Sep 1 - 23 sell-off
- RES 2: 1.3139 Former trendline support drawn off the Mar 20 low
- RES 1: 1.3083 High Oct 12
- PRICE: 1.3055 @ 10:30 BST Oct 13
- SUP 1: 1.2939/31 20- day and 50-day EMA
- SUP 2: 1.2846 Low Oct 7 and key near-term support
- SUP 3: 1.2806 Low Sep 30
- SUP 4: 1.2745 Low Sep 28
GBPUSD maintains a bullish tone and is holding onto recent gains. The pair cleared key resistance at 1.3007 on Oct 9, negating recent bearish signals and confirming a resumption of the current bullish cycle. 1.3079 has been achieved opening 1.3139 next. The former is a Fibonacci retracement and the latter, the former trendline support drawn off the Mar 20 low. 1.3139 also marks a key pivot level. Key support has been defined at 1.2846, Oct 7 low.
EUR/GBP: Probes The Bear Trigger At 0.9025
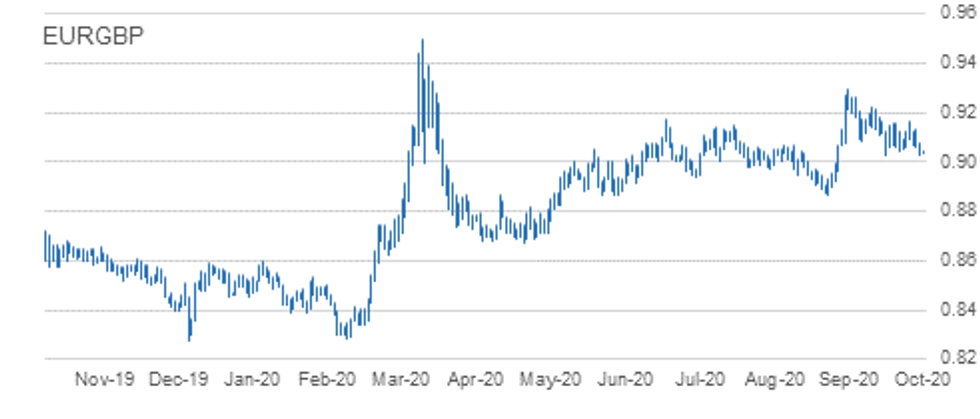
- RES 4: 0.9220 High Sep 22 and a key near-term resistance
- RES 3: 0.9190 61.8% retracement of the Sep 11 - 28 sell-off
- RES 2: 0.9162 High Oct 7 and the bull trigger
- RES 1: 0.9132 High Oct 10
- PRICE: 0.9037 @ 10:37 BST Oct 13
- SUP 1: 0.9020 Intraday low
- SUP 2: 0.9000 Round number support
- SUP 3: 0.8967 76.4% retracement of the Sep 3 - 11 rally
- SUP 4: 0.8808 Low May 13
EURGBP traded lower this morning. The recent inability to hold above trendline resistance drawn off the Sep 11 high weighs on the cross with further weakness likely near-term. Key support at 0.9025, Sep 28 low has been probed. A clear break would confirm a resumption of bearish trending conditions and open 0.8967, a retracement level. On the upside, firm resistance remains 0.9062, Oct 7 high.
USD/JPY: Corrective Pullback Extends
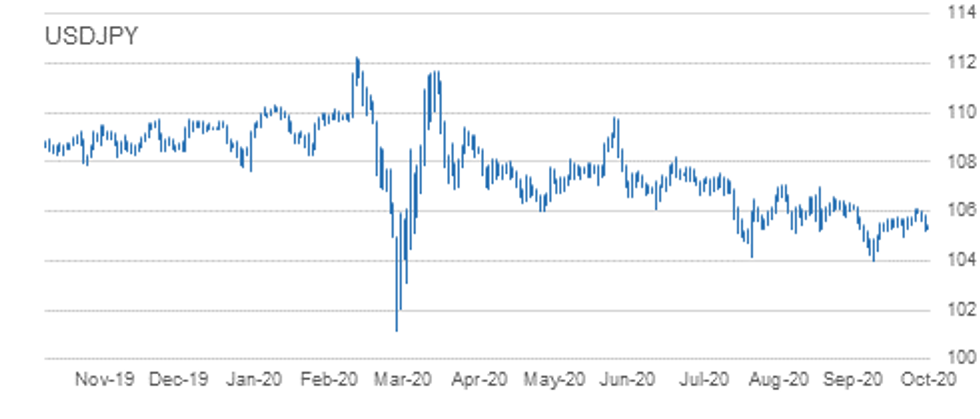
- RES 4: 106.62 Bear channel resistance drawn off the Mar 24 high
- RES 3: 106.55 High Sep 3
- RES 2: 106.11/38 High Oct 7 and the bull trigger / High Sep 8
- RES 1: 105.83 20-day EMA
- PRICE: 105.49 @ 10:39 BST Oct 13
- SUP 1: 105.24 Low Oct 12
- SUP 2: 104.94 Low Oct 2 and key near-term support
- SUP 3: 104.41 Low Sep 22
- SUP 4: 104.00 Low Sep 21 and the bear trigger
USDJPY started this week on a softer note having found resistance last week at 106.11, Oct 7 low. Short-term weakness however is considered a correction following last week's climb. Intraday momentum studies still point south however to strengthen a bearish theme, price needs to trade below key near-term support at 104.94, Oct 2 low. This would open 104.00, Sep 21 low. The bull trigger is at 106.11. A break resumes the recent uptrend.
EUR/JPY: Bullish Focus Intact Despite Pullback
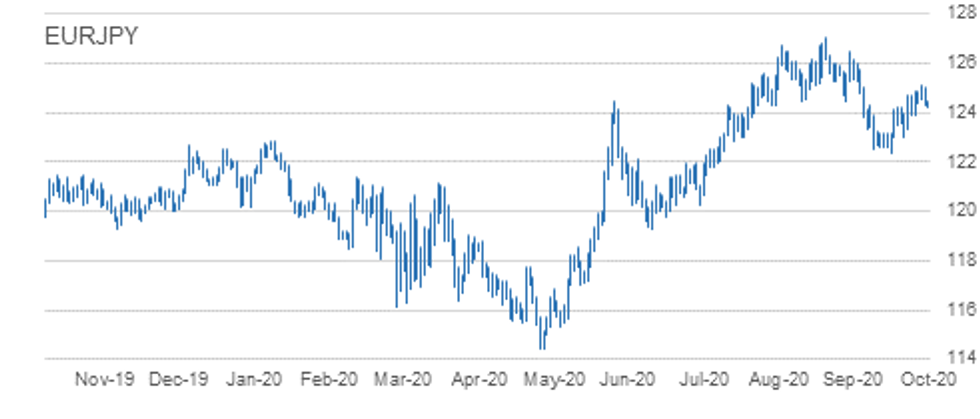
- RES 4: 127.08 High Sep 1 and primary resistance
- RES 3: 126.46 High Sep 10 and a key resistance
- RES 2: 125.77 High Sep 15
- RES 1: 125.09/28 High Oct 10 / 61.8% of the Sep 1 - 28 sell-off
- PRICE: 124.37 @ 10:47 BST Oct 13
- SUP 1: 124.12 50-day EMA
- SUP 2: 123.86 Low Oct 6
- SUP 3: 123.03 Low Sep 29 and Oct 2 and key near-term support
- SUP 4: 122.38/28 Low Sep 28 / 61.8% of the Jun 22 - Sep 1 rally
EURJPY is off recent highs but maintains a bullish tone. The cross rallied sharply higher on Oct 5 extending the bounce off the Oct 2 low of 123.03. Furthermore, resistance at 124.25, Sep 30 high has recently been cleared and this paves the way for a climb towards 125.28 next, a Fibonacci retracement. Initial key support has been defined at 123.03, Oct 2 low. First support lies at 124.12, the 50-day EMA.
AUD/USD: Trendline Resistance Still Intact
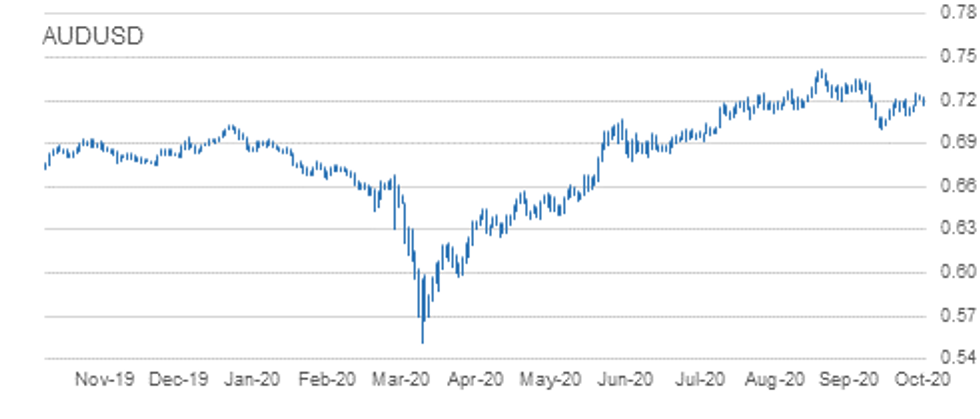
- RES 4: 0.7318 76.4% retracement September Sell-Off
- RES 3: 0.7318 High Sep 21
- RES 2: 0.7258 61.8% retracement September Sell-Off
- RES 1: 0.7243 High Oct 10 and the intraday bull trigger
- PRICE: 0.7194 @ 10:49 BST Oct 13
- SUP 1: 0.7161 Sep 9 low
- SUP 2: 0.7096 Low Oct 7 and the near-term bear trigger
- SUP 3: 0.7070 Low Sep 29
- SUP 4: 0.7006 Low Sep 25 and the bear trigger
AUDUSD rallied sharply higher Friday clearing resistance at 0.7209, Oct 1 and 6 high. This brought the pair into contact with trendline resistance drawn off the Sep 1 high. The line intersects at 0.7226 today and remains intact. A move above Friday's high of 0.7243, would confirm a breach of the line and reinforce S/T bullish conditions, opening 0.7258, a Fibonacci retracement. Initial support is 0.7161, a break would highlight a failure at the trendline.
TECHS: Heavy!
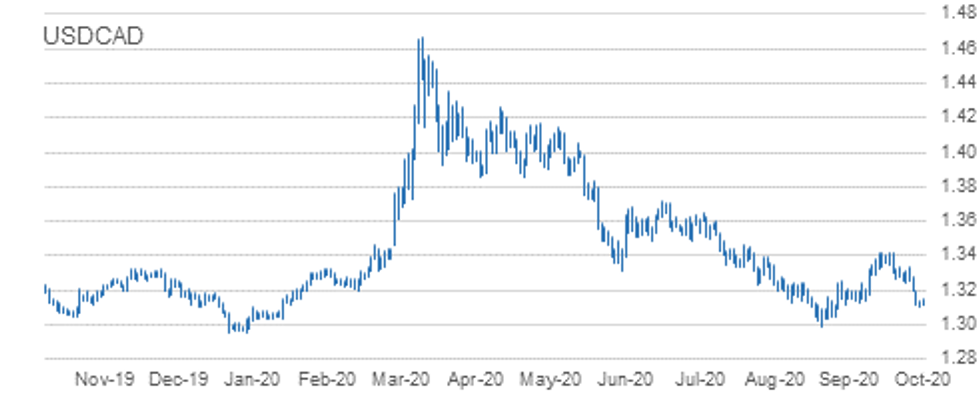
- RES 4: 1.3341 High Oct 7 and a reversal trigger
- RES 3: 1.3243 20-day EMA
- RES 2: 1.3273 High Oct 7 and key near-term resistance
- RES 1: 1.3202 Oct 9 high
- PRICE: 1.3112 @ 10:51 BST Oct 13
- SUP 1: 1.3100 Intraday low
- SUP 2: 1.3095 76.4% retracement of the Sep 1 - 30 rally
- SUP 3: 1.3038 Low Sep 2
- SUP 4: 1.2994 Low Sep 1
USDCAD edged lower again this morning, extending the pullback that started on Sep 30. The move lower follows the clear break last week of trendline support drawn off the Sep 1 low. Recent weakness has extended through 1.3157, a Fibonacci retracement to open the next retracement at 1.3095. Initial resistance is at Friday's high of 1.3202. Clearance of 1.3273 though, Oct 7 high is required to ease bearish pressure. Heavy!
LEVELS:
EUR/USD: MNI Key Levels:
- *$1.1917/29 Sep10 high/Sep02 high
- *$1.1900 Sep15 high
- *$1.1883 Upper 1.0% 10-dma envelope
- *$1.1872/76/82 Sep21 high/Upper Boll Band (2%)/Sep16 high
- *$1.1857/70 100-mma/Cloud top
- *$1.1817/27/31 Intraday high/Oct12 high/Oct09 high
- *$1.1801/02 55-dma/50-dma
- *$1.1793 ***CURRENT MARKET PRICE 09:56BST TUESDAY***
- *$1.1788/78 100-hma/Intraday low
- *$1.1768/56/55 200-hma/Oct09 low/21-dma
- *$1.1736/33/25 38.2% 1.3993-1.0341/Oct08 low/Oct07 low
- *$1.1696/85 Oct02 low/Sep30 low, Sep25 high
- *$1.1661/48 Sep29 low/Lower 1.0% 10-dma env
- *$1.1625/12 Lower Boll Band (2%)/Sep25 low
- *$1.1598/84 Cloud base/100-dma
- *$1.3266 Cloud top
- *$1.3221 Upper 2.0% 10-dma envelope
- *$1.3211 Upper Bollinger Band (3%)
- *$1.3173 Sep08 high
- *$1.3106 Upper Bollinger Band (2%)
- *$1.3083/92 Oct12 high/Upper 1.0% 10-dma env
- *$1.3072 Intraday high
- *$1.3055 ***CURRENT MARKET PRICE 09:56BST TUESDAY***
- *$1.3032/29 55-dma/50-dma
- *$1.3016/07 Intraday low/Sep16 high, Oct06 high
- *$1.3006 Oct12 low
- *$1.2983 100-hma
- *$1.2970 Oct08 high
- *$1.2955/53 200-hma/50-mma
- *$1.2941 200-wma
- *Gbp0.9168/81 Upper 1.0% 10-dma env/Sep24 high
- *Gbp0.9156/57/62 Oct01 high/Sep30 high/Oct07 high
- *Gbp0.9132 Oct09 high
- *Gbp0.9115/23 21-dma/Oct08 high
- *Gbp0.9079/82/85 Oct12 high/100-hma/200-hma
- *Gbp0.9052/57/59 Intraday high/55-dma/50-dma
- *Gbp0.9037 100-dma
- *Gbp0.9034 ***CURRENT MARKET PRICE 09:57BST TUESDAY***
- *Gbp0.9031/28/25 Intraday low/Oct12 low/Sep28 low
- *Gbp0.9021/19 Cloud top/Lower Boll Band (2%)
- *Gbp0.8986/73 Lower 1.0% 10-dma env/Lower Boll Band (3%)
- *Gbp0.8967 Sep08 low
- *Gbp0.8952 Cloud base
- *Gbp0.8925 Sep07 low
- *Gbp0.8900/96 Sep04 low/Lower 2.0% 10-dma env
USD/JPY: MNI Key Levels
- *Y106.04 Oct09 high
- *Y105.85 Oct12 high
- *Y105.79 50-dma
- *Y105.75 55-dma
- *Y105.74 100-hma
- *Y105.65 200-hma
- *Y105.50/53 Intraday high/Cloud Tenkan Sen
- *Y105.45 ***CURRENT MARKET PRICE 09:57BST TUESDAY***
- *Y105.38/28/24 21-dma/Intraday low/Oct12 low
- *Y105.21 Sep24 low
- *Y105.20 Aug28 low
- *Y105.19 Cloud Kijun Sen
- *Y105.10 Aug19 low
- *Y105.08 Sep22 high
- *Y104.94 Oct02 low
- *Y125.03 Oct12 high
- *Y124.93 Fibo 38.2% 149.78-109.57
- *Y124.85 50-dma
- *Y124.81 55-dma
- *Y124.80 50-mma
- *Y124.66 100-hma
- *Y124.42/48 Cloud Kijun Sen/Intraday high
- *Y124.36 ***CURRENT MARKET PRICE 09:58BST TUESDAY***
- *Y124.33 200-hma
- *Y124.16 Intraday low
- *Y124.06 Cloud Tenkan Sen
- *Y123.88 21-dma
- *Y123.87 Oct07 low
- *Y123.86 Oct06 low
- *Y123.45 Cloud base
- *$0.7382/89 Sep02 high/Upper3.0% 10-dma env
- *$0.7334/40 Sep18 high/Sep03 high
- *$0.7318/24/32 Upper 2.0% 10-dma env/Sep21 high/Upper Boll Band (2%)
- *$0.7264/73 50-mma/Cloud top
- *$0.7246/54 Upper 1.0% 10-dma env/Sep17 low
- *$0.7235/43/45 Sep22 high, Oct12 high/Oct09 high/200-wma
- *$0.7206/10/18 55-dma/50-dma/Intraday high
- *$0.7198 ***CURRENT MARKET PRICE 09:58BST TUESDAY***
- *$0.7185/76/74 100-hma/21-dma/200-hma
- *$0.7165/61 Intraday low/Oct09 low
- *$0.7124/23 Cloud base/Oct08 low
- *$0.7102/96 Lower 1.0% 10-dma env/Oct07 low
- *$0.7084/70 100-dma/Sep29 low
- *$0.7031/29 Lower 2.0% 10-dma env/Sep28 low
- *$0.7008/06 Lower Boll Band (2%)/Sep25 low
- *C$1.3263/73 21-dma/Oct08 high
- *C$1.3242 Oct06 low
- *C$1.3219/34 50-dma/55-dma, 200-hma
- *C$1.3202 Oct09 high
- *C$1.3179 100-hma
- *C$1.3161/63/74 Cloud base/200-wma/50-mma
- *C$1.3145 Intraday high
- *C$1.3110 ***CURRENT MARKET PRICE 09:59BST TUESDAY***
- *C$1.3108/01 Intraday low/Oct12 low
- *C$1.3096/87 Lower 1.0% 10-dma env/Sep08 low
- *C$1.3078 Lower Bollinger Band (2%)
- *C$1.3038 Sep02 low
- *C$1.2994/84 Sep01 low/Lower Boll Band (3%)
- *C$1.2976/64 Jan08 low/Lower 2.0% 10-dma env
- *C$1.2957/52 YTD Jan07 low/Dec31-2019 low
Why MNI
MNI is the leading provider
of intelligence and analysis on the Global Fixed Income, Foreign Exchange and Energy markets. We use an innovative combination of real-time analysis, deep fundamental research and journalism to provide unique and actionable insights for traders and investors. Our "All signal, no noise" approach drives an intelligence service that is succinct and timely, which is highly regarded by our time constrained client base.Our Head Office is in London with offices in Chicago, Washington and Beijing, as well as an on the ground presence in other major financial centres across the world.